SlideShare a Scribd company logo
1 of 4
Download to read offline
A sset A llocation over last 3 months
Content                                                                                                                                                C ash
                                                                                                                                                       F ixed Inco m e
Page                                  100.0%
                                                                                                                                                       Equities
     1
De huidige economische omgeving       75.0%

                                      50.0%


                                                                70.1%


                                                                          29.9%


                                                                                                       74.5%


                                                                                                                 25.5%


                                                                                                                                             59.0%


                                                                                                                                                       40.4%
Page
                                                      0.0%


                                                                                             0.0%


                                                                                                                                   0.7%
                                      25.0%

Activa2Klasse : Analyse                 0.0%
                                                               Okt 10                                N o v 10                              D ez 10


Page
     3
Huidige Activaverdeling                                        Besmetting: Made in Germany
                                     Als we de globale economische dynamiek en de                    Momenteel domineert de macro-economische omgeving
                                     regionale verschillen belijken dan is een van de                duidelijk de gemoedgesteldheid van de beleggers. Het
Page                                 meest extreme gevallen van divergentie zichtbaar                meeste slechte nieuws is reeds in de markten ingeprijsd.
                                     in de Europese Monetaire Unie. Het is weliswaar                 We zijn overtuigd dat de Europese Centrale Bank op een
     4
Rendementsanalyse                    een politieke unie, maar een met extreme                        gegeven moment gemandateerd zal worden door
                                     contrasten in de economische realiteit. Duitsland               Duitsland om de marktstress op een consistente manier
                                     heeft juist aangekondigd dat de werkloosheid                    voor iedereen zal systematiseren. Op dat moment zullen
                                     daalde tot een 18-jarig dieptepunt. Tegelijkertijd              de fundamentele factoren opnieuw domineren.
                                     kwan het nieuws dat de Europese werkloosheid
                                     steeg naar een 12-jarig hoogtepunt. Mede omwille                Het inflatie niveau in zowel de VS als in Europa staat op
                                     van de euro zwakte is de exportgedreven                         een niveau dat vraagt (en zelfs smeekt) om meer stimulus
                                     economie zeer sterk. Het is zo opvallend dat een                op korte tot middellange termijn. De kerninflatie in de VS
                                     cynicus het gedrag van de Duitse politici tegenover             staat op historisch lage niveau's. Alle inflatoire risico's
       Onze visie                    de PIIGS in de schuldencrisis egocentrisch is. Na
                                     Griekenland dat in de eerste plaats een geloof-
                                                                                                     omwille van het kwantitatief ingrijpen lijken op dit moment
                                                                                                     ongefundeerd te zijn. De taal van de centrale bankiers lijkt
                                     waardigheidscrisis was, was het Iers probleem van               meer en meer in inflaterende richting te evolueren. Zozeer
Omwille van gedwongen                bij het begin een bankencrisis. Hierdoor is het                 als investeerder hen de schuld gaven van een verkeerde
aankopen van PIIGS                   probleem structureler van aard.                                 beslissing te nemen met QE2, zo sterk zijn de cijfers een
obligaties, zal de ECB vroeg                                                                         bewijs van het tegendeel.
of laat gedwongen worden             Deze crisis werd versneld door de politieke retoriek
geld te drukken. dit zal de          van Duits kanselier Angela Merkel en haar Franse                Ondertussen zijn de aziatische landen, aan het begin van
EUR verder onder druk                collega Sarkozy. Haar opmerking eind oktober, dat               een globale economische heropleving, hun eigen
plaatsen.                            vanaf 2011, investeerders in overheidsobligaties                economieën aan het afremmen ten einde een
                                     een deel van het risico zullen moeten dragen. Dit               gelopperende inflatie te vermijden. In de veronderstelling
                                     stuurde de risicopremie voor deze obligaties van                dat deze economieën op zichzelf kunnen groeien is dit
Ondernemingsobligaties die
                                     landen met potentiële probleem de dieperik in.                  niet zo een probleem. We denken echter dat dit nog niet
minder renderen dan
                                     Hierdoor werden een aantal landen versneld                      het geval is en dat dit op kortere termijn de vraag naar
overheidsobligaties is een           verplicht om hulp te vragen. Hierdoor werd de ECB               westerse producten wat kan afremmen. Dit kan op dit
abnormale situatie.                  in een positie van enige koper geduwd. Dit met                  moment gecompenseerd worden door het stijgende
                                     enige tegenzin, want men was reeds van plan om                  vertrouwen van de Amerikaanse consument die met meer
Duitse economische                   de genomen maatregelen terug te schroeven. De                   vertrouwen lijkt te spenderen. Dit komt op een zeer
«kolonisatie» van Europa zal         ECB strategie van monetaire sterilisatie is                     gelegen moment met het belangrijke eindejaarsseizoen in
pas eindigen op het moment           onhoudbaar. De recent gekochte obligaties                       zicht.
dat duidelijk wordt hoe sterk        (voornamelijk Griekse en Ierse) zijn snel in waarde
de Duitse banken aan de              aan het dalen, waardoor de balans van de ECB
PIIGS blootgesteld zijn.             onder druk komt. Dit heeft een remmend effect op
                                     de economie, tenzij het gecompenseerd wordt
Duitse banken zijn heel sterk        met nieuw geld.
blootgesteld aan PIIGS.           EFSF :European Financial Stability Facility : dit is een speciaal vehikel dat op 9 mei 2010 overeengekomen werd door de 27 lidstaten van
Volgend jaar moeten ze 30%        de Europese Unie. De doelstelling was om de financiële stabiliiteit in Europa te bewaren door middel van financiële ondersteuning van
van hun obligaties                lidstaten met problemen. de EFSF is in Luxemburg gevestigd. De Europese Inveseringsbank verzorgt de thesaurie. en administratieve
                                  ondersteuning. De EFSF kan met €60 miljard van het Europese Financial Stabilisation Mechanism (dat op zijn beurt fondsen werft van de
herfinancieren. Dit kan tot       Europese Commissie met het EU budget as onderpand) en tot €250 miljard van het International Monetary Fund (IMF) om in totaal €750
stress leiden in de kern van      miljard financiële slagkracht te komen.
Europa.                           ESM: European Stability Mechanism. Een permanent reddingsmechanisme dat het EFSF na de einddatum in Juni 2013. Het ESM moet
                                  het EFSF permanent maken,met als belangrijkste verschil dat ESM leningen boven staatspapier staan, terwijl EFSF leningen dit niet zijn.
                                  Als eerste stap in de steun is een schuldhaalbaarheidsanalyse, uitgevoerd door de commissie, het IMF en de ECB. Indien het land
                                  insolvent geacht wordt starten onderhandelingen voor een herstructureringsplan met hun crediteurs. Een systeem van «collective action
                                  clauses» (CACs) laat toe dat een gekwalificeerde meerderheid een herstructurering bindend maakt voor alle betrokken partijen.
                                  Bovendien vallen alle uitstaande obligaties onder dit plan. Na deze haalbaarheidsanalyse moet ondersteuning unaniem goedgekeurd
                                  door de eurogroep ministers over ondersteuning. Een finale beslissing over de werking van het mechanisme wordt genomen op de
                                  meeting van de Raad van Europa op 16 December, 2010.
                                                                 www.nautilusag.com
                                                                info@nautilusag.com
                                                                                                                                                               Page 1 of 4
Decem ber-2010
Algemene Markt Rendementen (November 2010)                                                                                                                  Activa Verdeling (December 2010)

   Market                                                                      Month-to-date                                 Year-to-date                   Cash (0.6%,+0.6%): beperkte stijging. De korte termijn rendementen
                                                                                                                                                            beginnen te stijgen als teken van de spanning in het banksysteem.
                               Performance                                                                                  Performance
   3M Treasury Bill                   0.0%                                                                                        0.1%                      Obligaties (59%, -15%): Nu de the impact van QE2 (kwantitafief
   Barclays US Treasury 1-3Y Index-0.2%                                                                                           2.6%                      ingrijpen) aan het wegebben is na de mededeling van de FED om nog
   Barclays US Treasury 7-10Y Index -0.8%                                                                                       13.3%                       eens 600 miljard USD geld te drukken werd de allocatie in obligaties
   Barclays US Treasury +20Y Index1.3%
                                    -                                                                                           13.6%                       serieus teruggeschroefd. In de weging werden de 1-3 jaarsobligaties
                                                                                                                                                            met 5% verhoogd en de 20+ jarige obligaties met 18%. Dit ten nadele
   Barclays Corp.Inv.Grade Index -0.8%                                                                                          10.0%
                                                                                                                                                            van de weging in de 7-10 jarige die met 11% afgebouwd werden. De
   Dow Jones World Index            -1.9%                                                                                         5.4%                      positie ondernemingsobligaties werden volledig afgebouwd. We
                                                                                                                                                            denken dat de verkoopsgolf op de langetermijnobligaties overdreven
                            Top 5 perform ing sectors                                                                                                       was en dat kwantitatief ingrijpen van de centrale banken een proces is
               Sector          Return (Nov 2010) Allocation (Nov 2010)                                                                                      dat nog steeds gaande is en zelfs in Europa kan starten. Deze
                Energy                1.35%              0.00%                                                                                              kwantitatieve programma›s zullen eveneens op de lange
            Basic Materials           0.56%             11.23%                                                                                              termijnobligaties gaan toespitsen, omdat hier de grootste
              Industrial              0.30%              0.00%
                                                                                                                                                            economische stimulus gerealiseerd kan worden. Dit is een
                                                                                                                                                            dynamische herweging en moet gezien worden in het kader van de
          Consumer Services          -0.57%              5.88%                                                                                              verlaging van de obligatieweging met 15%.
           Consumer Goods            -0.75%              1.62%
                                                                                                                                                            De duration in het model steeg van 9 tot 10.5 deze maand.
                                                               Flop 5 perform ing sectors
                                   Sector                          Return (Nov 2010) Allocation (Nov 2010)                                                  Aandelen (40%, +15%): Het meeste slechte macro-economische
                                 Technology                             -1.44%               6.06%                                                          nieuws zit reeds in de prijzen verwerkt. De groeilanden zagen een
                                 Healthcare                             -3.37%               0.00%                                                          duidelijk daling in november, samen met de ontwikkelde markten, met
                                  Financials                            -5.07%               0.00%                                                          Europa voorop. Met het resultatenseizoen achter de rug, werd het
                                                                                                                                                            duidelijk dat de ondernemingen in goede vorm zijn en dat de
                                  Telecoms                              -5.52%               0.40%
                                                                                                                                                            winstmarges op de hoogste niveaus staan sinds enkele decennia. Dit
                                    Utilities                           -5.63%               0.00%                                                          weerspiegelde zich in de voorbije maanden niet in de
                                                                                                                                                            aandelenkoersen die overschaduwd werden door macro-
                                      Europese CDS spreads en EUR/USD (Okt-Nov 2010)                                                                        economische berichten. We behouden onze blootstelling aan de
                                                                                                                                                            financiële sector uiterst laag, gezien dit de sector blijft met het grootste
                                                                                                                                      1.44
                             500
                                            B ilaterale o vereenko mst tussen M erkel en Sarko zy die
                                             zei dat de privé secto r tevens risico mo et meedragen.
                                                                                                                                                            risico tegenover de landencrisis.

                                                                                                                                      1.42                  Sector weging
                             400
                                                                                                                                      1.4                   De voornaamste overgewichten en ondergewichten van vorige maand
    CDS Spread (% points)


                                                                                                                                                            worden bevestigd en in sommige gevallen verstevigd. Basic materials
                                                                                                                                             EUR/USD rate


                                                                                                                                      1.38                  (11.3%, -0.6%), Consumentengoederen (10%, +8.3%) en
                             300                                                                                                                            consumenten diensten (7%, +1.5%).Grootste ondergewichten blijven
                                                                                                                                      1.36                  Olie&gas (0.7%, +0.7%), Financiële sector (2.6%, +2.5%) en
                                                                                                                                                            nutsbedrijven (0.9% +0.9%). het gewicht in de technologiesector werd
                             200                                                                                                      1.34                  verlaagd met -4.2% tot 1.9%.

                                                                                                                                      1.32
                                                                                                                                                            Het grootste overgewicht hebben we in basismaterialen. Momenteel is
                             100
                                                                                                                                                            er een consolidatiegolf gaande. Bovendien lijkt de evolutie in de USD
                                                                                                                                                            meer en meer ontkoppeld van de evolutie van de grondstofprijzen.
                                                                                                                                      1.3
                                                                                                                                                            Eenmaal dit duidelijk wordt, kan een tweede stijging van de grondstoffen
                                                                                                                                                            aanvatten.
                                 0                                                                                                    1.28
                                     01 0
                                       .1         08.10       1 0
                                                               5.1    22.10      29.10      05.11        1 1
                                                                                                          2.1     1 1
                                                                                                                   9.1       26.11
                                     P o rtugal           Spain        Italy        B elgium            Germany          EUR/USD (right scale)              Geografisch weging
                            B ro n : B lo o mberg, Nautilus

                                                                                                                                                            Een duidelijke stijging van het gewicht in Japan dat met 16.9% duidelijk
De bovenstaande grafiek illustreert de Europese miserie made in                                                                                             het grootste gewicht krijgt in de portefeuille. De Japanse beurs deed het
Germany. het toont de marktreactie op de aankondiging van de                                                                                                zeer goed in de voorbije maand en heeft nog meer ruimte om te
bilaterale gesprekken tussen Duitsland en Frankrijk die zeiden dat de                                                                                       herstellen gezien zijn slecht rendement sinds het begin van dit jaar.
obligatiemarkt een deel van de schade moet dragen bij landen die                                                                                            Bovendien zal een recente verzwakking van de Yen tegenover de
geholpen worden. Dit werd als zeer negatief gezien door de                                                                                                  munten van de voornaamste handelspartners de exportsector helpen.
investeerders die direct een hogere risicopremie eisten voor het                                                                                            Alle andere landen blijven ondergewogen tegenover de benchmark,
aanhouden van staatsobligaties uit risicolanden. Zelfs de kernlanden                                                                                        met uitzondering van de VS dat neutraal gewogen blijft. De VS zal
kwamen onder druk in het voordeel van Duits staatspapier. Deze                                                                                              blijven profiteren van het kwantitatief programma dat nog 5 maanden
bewoording werd ondertussen gewijzigd. Schade is echter toegericht.                                                                                         loopt.


                                                                                                                                        Nautilus Capital AG
                                                                                                                                        www.nautilusag.com
                                                                                                                                       info@nautilusag.com                                                                  Page 2 of 4
 Decem ber-2010
Current Asset Allocation
 Asset Allocation                                                                                           Historical Asset Allocations                                     Cash
                                                                     Cash
                                                                                                            (Last 5 years)                                                   Fixed Inco me
 80.0%                                                               Fixed Inco me
                                                                                                                                                                             Equity
                                                                     Equity
                                                                                                             100.0%

 60.0%
                                                                                                              75.0%


 40.0%
                                                                                                              50.0%


 20.0%                                                                                                        25.0%


                             0.7%           59.0%            40.4%
                                                                                                               0.0%
   0.0%
                                                                                                                  Dez 05          Dez 06         Dez 07       Dez 08     Dez 09        Dez 10
                                       A sset Classes


 Fixed Income Allocation: Sector                                                                            Fixed Income Allocation: Duration
                                                                                                             40.0%
   40.0%


   30.0%                                                                                                     30.0%


   20.0%                                                                                                     20.0%


   10.0%                                                                                                     10.0%

                 2.9%               35.6%           20.5%              0.0%                                                       2.9%                    35.6%             20.5%
    0.0%                                                                                                      0.0%
             UST 1 Year UST 7-1 Year UST 20+ Year
                  -3           0                                 US Co rp.Inv                                                <3 Years                7-1 Years
                                                                                                                                                        0                10-20 Years


 Equity Allocation: Regions                                                                                 Equity Allocation: Industries
                             0%       4%         8%        12%       16%      20%                                                 0%        2%       4%           6%   8%     10%       12%

           United Kingdom     2.2%                                                                           B asic M aterials      10.7%
                                                                                                               Co ns. Go o ds       10.0%
           No rth A merica    14.5%
                                                                                                             Co ns. Services        7.4%
            Latin A merica    0.0%                                                                                 Financials       2.6%
                                                                                                                 Health Care        1.3%
                    Japan     16.9%
                                                                                                                   Industrials      3.8%
    Europe, Ex-UK (Eme)       0.0%                                                                                   Oil & Gas      0.7%

                              5.1%                                                                               Techno lo gy       1.9%
    Europe, Ex-UK (Dev)
                                                                                                                       Telco s      1%
                                                                                                                                    .1
  A sia/P acific, Ex-Japan    1.6%                                                                                                  0.9%
                                                                                                                      Utilities


Equity Allocation: Under/Over Regions                                                                       Equity Allocation: Under/Over Industries

   Europe, Ex-UK (Eme)                         -87.1%                                                             B asic M aterials                  166.0%
                                                                                                               Co nsumer Go o ds                     105.3%
   Europe, Ex-UK (Dev)                        -28.3%
                                                                                                              Co nsumer Services                     91.7%
            United States                               1%
                                                        .1                                                               Financials         -69.2%
                                                                                                                       Health Care          -49.0%
          United Kingdom                       -3.0%
                                                                                                                         Industrials        -30.4%
           Latin A merica                     -100.0%                                                                      Oil & Gas        -83.2%
                                                                                                                       Techno lo gy         -44.1%
                   Japan                                435.6%
                                                                                                                             Telco s        -44.8%
 A sia/P acific, Ex-Japan                     -64.3%                                                                        Utilities       -52.5%

                        -50%           -25%           0%         25%          50%                                                        -50 -25 0% 25 50          75 100 125 150 1 200
                                                                                                                                                                                   75
                                                                                                                                          % %       % %            % % % % % %

                                                                                      Nautilus Capital AG
                                                                                      www.nautilusag.com
                                                                                     info@nautilusag.com                                                                          Page 3 of 4
 Decem ber-2010
Performance Analysis

                                                                                                                      DRM                US 3M                 US Aggregate Benchmark**          Dow Jones
                                                                                                                                        Treasury
                                                                                                                                  Agg. World      Bond Index
                                                 Return Currency                             USD                           USD          USD USD        USD
                                                 Month Return (Nov-10)                      -0.8%                         -1.2%        -1.9%0.0%      -0.6%
                                                 Year-to-date Return                         3.1%                          6.6%         5.4%0.1%       7.7%
                                                 Last 12 Months Return                       3.9%                          6.7%         7.6%0.1%       6.0%
                                                 Last 24 Months Return                       3.7%                         12.8%        20.1%0.1%       8.8%
                                                 Total Annual Return *                       8.9%                          5.3%         4.9%2.1%       5.7%
                                                 Standard Deviation (Volatility) *           7.5%                          8.4%        16.9%0.5%       3.8%
                                                 Semi-Standard Deviation (<0) *              7.1%                          9.9%        19.2%   NM      3.8%
                                                 Sharpe Ratio * ( rf = 2.07% )               0.91                          0.38         0.17   NM       0.97
                                                 Sortino Ratio * ( rf = 2.07% )              0.96                          0.33         0.15   NM       0.97
                                                 Positive Months *                         67.3%                          64.5%            99.1%
                                                                                                                                       58.9%         69.2%
                                                 Average Monthly Return *                    0.7%                          0.4%         0.4%0.2%       0.5%
                                                 All figures are annualized measures of returns.
                                                 * Period: Jan-02 to Nov-10.
                                                 ** Benchmark = 5% UST 3M + 22.5% UST 1-3Y + 9% UST 7-10Y + 5.4% UST 20+Y
                                                                  + 8.1% US Corp. Inv. Grade Bonds + 50% Dow Jones Aggr. World Equity Index.


             Cummulative Performance
                250                                                                                                                       Cummulative Outperformance
                                                                                                                                             100%
                                                    DRM
                200
                                                    B enchmark                                                                                 75%

                 150                                                                                                                           50%

                                                                                                                                               25%
                 100
                                                                                                                                                  0%
                  50
                                                                                                                                             -25%
                       Dez       Dez        Dez        Dez       Dez        Dez        Dez       Dez        Dez
                                                                                                                                                         Dez       Dez    Dez       Dez       Dez        Dez       Dez        Dez       Dez
                        01       02         03         04        05         06         07        08         09
                                                                                                                                                          01       02     03        04        05         06        07         08        09


        Current Month Performance Attribution                                                     Cash
                                                                                                                                           Rew ard to Risk Analysis of Returns
        vs. Benchmark                                                                             Fixed Inco me                                                  12.5%
                                                                                                  Equities
                                                                                                  To tal                                                        10.0%
                                                                                                                                             Realized Return


         5.0%                                                                                                  5.0%                                                                DRM
                                                                                                                                               (Reward)


                                                                                                                                                                  7.5%
         2.5%                                                                                                  2.5%
                                                                                                                                                                 5.0%     US Ag Bd                Benchmark
                                                                                                                                                                                                                              Dow Jones
         0.0%                                                                                                  0.0%                                                        Index                                              Agg. World
                                                                                                                                                                 2.5%                                                           Index
                                                                                                                                                                          3M -Treasury
        -2.5%                                                                                                  -2.5%
                                                                                                                                                                 0.0%
                                                                                                                                                                     0%            5%              10%             15%             20%             25%
        -5.0%                                                                                                  -5.0%
                     A sset A llo catio n           Secto r Ro tatio n          To tal Value A dded                                                                                 Incurred Volatility (Risk)


This publication is for your information only and is not intended as an offer, or a solicitation of an offer, to buy or sell any Investment or other specific product. Although all information and opinions expressed in this document were obtained from sources believed to be
reliable and in good faith, no representation or warranty, express or implied, is made as to its accuracy or completeness. All information and opinions as well as any prices indicated are subject to change without notice. At any time Nautilus Capital ("Nautilus") (or
employees thereof) may have a long or short position, in relevant securities. Some investments may not be readily realisable at times of illiquid market circumstances. Therefore valuing the investment and identifying the risk to which you are exposed may be difficult
to quantify. Futures and options trading is considered risky and past performance of an investment is not a guide to its future performance. Some investments may be subject to a decline in value and on realisation you may receive back less than you invested.
Changes in FX rates may have an adverse effect on the price, value or income of an investment. Each investment needs to be seen in the context of your particular investment objectives, financial situation and needs and we would recommend that you take financial
advice as to the tax implications of investing in any of the products mentioned herein.

                                                                                                                        Nautilus Capital AG
                                                                                                                        www.nautilusag.com
                                                                                                                       info@nautilusag.com                                                                                                                 Page 4 of 4
  Decem ber-2010

More Related Content

Featured

2024 State of Marketing Report – by Hubspot
2024 State of Marketing Report – by Hubspot2024 State of Marketing Report – by Hubspot
2024 State of Marketing Report – by HubspotMarius Sescu
 
Everything You Need To Know About ChatGPT
Everything You Need To Know About ChatGPTEverything You Need To Know About ChatGPT
Everything You Need To Know About ChatGPTExpeed Software
 
Product Design Trends in 2024 | Teenage Engineerings
Product Design Trends in 2024 | Teenage EngineeringsProduct Design Trends in 2024 | Teenage Engineerings
Product Design Trends in 2024 | Teenage EngineeringsPixeldarts
 
How Race, Age and Gender Shape Attitudes Towards Mental Health
How Race, Age and Gender Shape Attitudes Towards Mental HealthHow Race, Age and Gender Shape Attitudes Towards Mental Health
How Race, Age and Gender Shape Attitudes Towards Mental HealthThinkNow
 
AI Trends in Creative Operations 2024 by Artwork Flow.pdf
AI Trends in Creative Operations 2024 by Artwork Flow.pdfAI Trends in Creative Operations 2024 by Artwork Flow.pdf
AI Trends in Creative Operations 2024 by Artwork Flow.pdfmarketingartwork
 
PEPSICO Presentation to CAGNY Conference Feb 2024
PEPSICO Presentation to CAGNY Conference Feb 2024PEPSICO Presentation to CAGNY Conference Feb 2024
PEPSICO Presentation to CAGNY Conference Feb 2024Neil Kimberley
 
Content Methodology: A Best Practices Report (Webinar)
Content Methodology: A Best Practices Report (Webinar)Content Methodology: A Best Practices Report (Webinar)
Content Methodology: A Best Practices Report (Webinar)contently
 
How to Prepare For a Successful Job Search for 2024
How to Prepare For a Successful Job Search for 2024How to Prepare For a Successful Job Search for 2024
How to Prepare For a Successful Job Search for 2024Albert Qian
 
Social Media Marketing Trends 2024 // The Global Indie Insights
Social Media Marketing Trends 2024 // The Global Indie InsightsSocial Media Marketing Trends 2024 // The Global Indie Insights
Social Media Marketing Trends 2024 // The Global Indie InsightsKurio // The Social Media Age(ncy)
 
Trends In Paid Search: Navigating The Digital Landscape In 2024
Trends In Paid Search: Navigating The Digital Landscape In 2024Trends In Paid Search: Navigating The Digital Landscape In 2024
Trends In Paid Search: Navigating The Digital Landscape In 2024Search Engine Journal
 
5 Public speaking tips from TED - Visualized summary
5 Public speaking tips from TED - Visualized summary5 Public speaking tips from TED - Visualized summary
5 Public speaking tips from TED - Visualized summarySpeakerHub
 
ChatGPT and the Future of Work - Clark Boyd
ChatGPT and the Future of Work - Clark Boyd ChatGPT and the Future of Work - Clark Boyd
ChatGPT and the Future of Work - Clark Boyd Clark Boyd
 
Getting into the tech field. what next
Getting into the tech field. what next Getting into the tech field. what next
Getting into the tech field. what next Tessa Mero
 
Google's Just Not That Into You: Understanding Core Updates & Search Intent
Google's Just Not That Into You: Understanding Core Updates & Search IntentGoogle's Just Not That Into You: Understanding Core Updates & Search Intent
Google's Just Not That Into You: Understanding Core Updates & Search IntentLily Ray
 
Time Management & Productivity - Best Practices
Time Management & Productivity -  Best PracticesTime Management & Productivity -  Best Practices
Time Management & Productivity - Best PracticesVit Horky
 
The six step guide to practical project management
The six step guide to practical project managementThe six step guide to practical project management
The six step guide to practical project managementMindGenius
 
Beginners Guide to TikTok for Search - Rachel Pearson - We are Tilt __ Bright...
Beginners Guide to TikTok for Search - Rachel Pearson - We are Tilt __ Bright...Beginners Guide to TikTok for Search - Rachel Pearson - We are Tilt __ Bright...
Beginners Guide to TikTok for Search - Rachel Pearson - We are Tilt __ Bright...RachelPearson36
 

Featured (20)

2024 State of Marketing Report – by Hubspot
2024 State of Marketing Report – by Hubspot2024 State of Marketing Report – by Hubspot
2024 State of Marketing Report – by Hubspot
 
Everything You Need To Know About ChatGPT
Everything You Need To Know About ChatGPTEverything You Need To Know About ChatGPT
Everything You Need To Know About ChatGPT
 
Product Design Trends in 2024 | Teenage Engineerings
Product Design Trends in 2024 | Teenage EngineeringsProduct Design Trends in 2024 | Teenage Engineerings
Product Design Trends in 2024 | Teenage Engineerings
 
How Race, Age and Gender Shape Attitudes Towards Mental Health
How Race, Age and Gender Shape Attitudes Towards Mental HealthHow Race, Age and Gender Shape Attitudes Towards Mental Health
How Race, Age and Gender Shape Attitudes Towards Mental Health
 
AI Trends in Creative Operations 2024 by Artwork Flow.pdf
AI Trends in Creative Operations 2024 by Artwork Flow.pdfAI Trends in Creative Operations 2024 by Artwork Flow.pdf
AI Trends in Creative Operations 2024 by Artwork Flow.pdf
 
Skeleton Culture Code
Skeleton Culture CodeSkeleton Culture Code
Skeleton Culture Code
 
PEPSICO Presentation to CAGNY Conference Feb 2024
PEPSICO Presentation to CAGNY Conference Feb 2024PEPSICO Presentation to CAGNY Conference Feb 2024
PEPSICO Presentation to CAGNY Conference Feb 2024
 
Content Methodology: A Best Practices Report (Webinar)
Content Methodology: A Best Practices Report (Webinar)Content Methodology: A Best Practices Report (Webinar)
Content Methodology: A Best Practices Report (Webinar)
 
How to Prepare For a Successful Job Search for 2024
How to Prepare For a Successful Job Search for 2024How to Prepare For a Successful Job Search for 2024
How to Prepare For a Successful Job Search for 2024
 
Social Media Marketing Trends 2024 // The Global Indie Insights
Social Media Marketing Trends 2024 // The Global Indie InsightsSocial Media Marketing Trends 2024 // The Global Indie Insights
Social Media Marketing Trends 2024 // The Global Indie Insights
 
Trends In Paid Search: Navigating The Digital Landscape In 2024
Trends In Paid Search: Navigating The Digital Landscape In 2024Trends In Paid Search: Navigating The Digital Landscape In 2024
Trends In Paid Search: Navigating The Digital Landscape In 2024
 
5 Public speaking tips from TED - Visualized summary
5 Public speaking tips from TED - Visualized summary5 Public speaking tips from TED - Visualized summary
5 Public speaking tips from TED - Visualized summary
 
ChatGPT and the Future of Work - Clark Boyd
ChatGPT and the Future of Work - Clark Boyd ChatGPT and the Future of Work - Clark Boyd
ChatGPT and the Future of Work - Clark Boyd
 
Getting into the tech field. what next
Getting into the tech field. what next Getting into the tech field. what next
Getting into the tech field. what next
 
Google's Just Not That Into You: Understanding Core Updates & Search Intent
Google's Just Not That Into You: Understanding Core Updates & Search IntentGoogle's Just Not That Into You: Understanding Core Updates & Search Intent
Google's Just Not That Into You: Understanding Core Updates & Search Intent
 
How to have difficult conversations
How to have difficult conversations How to have difficult conversations
How to have difficult conversations
 
Introduction to Data Science
Introduction to Data ScienceIntroduction to Data Science
Introduction to Data Science
 
Time Management & Productivity - Best Practices
Time Management & Productivity -  Best PracticesTime Management & Productivity -  Best Practices
Time Management & Productivity - Best Practices
 
The six step guide to practical project management
The six step guide to practical project managementThe six step guide to practical project management
The six step guide to practical project management
 
Beginners Guide to TikTok for Search - Rachel Pearson - We are Tilt __ Bright...
Beginners Guide to TikTok for Search - Rachel Pearson - We are Tilt __ Bright...Beginners Guide to TikTok for Search - Rachel Pearson - We are Tilt __ Bright...
Beginners Guide to TikTok for Search - Rachel Pearson - We are Tilt __ Bright...
 

News Letter Nau N Ldec10

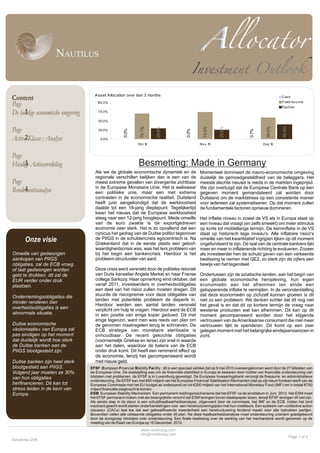
  • 1. A sset A llocation over last 3 months Content C ash F ixed Inco m e Page 100.0% Equities 1 De huidige economische omgeving 75.0% 50.0% 70.1% 29.9% 74.5% 25.5% 59.0% 40.4% Page 0.0% 0.0% 0.7% 25.0% Activa2Klasse : Analyse 0.0% Okt 10 N o v 10 D ez 10 Page 3 Huidige Activaverdeling Besmetting: Made in Germany Als we de globale economische dynamiek en de Momenteel domineert de macro-economische omgeving regionale verschillen belijken dan is een van de duidelijk de gemoedgesteldheid van de beleggers. Het Page meest extreme gevallen van divergentie zichtbaar meeste slechte nieuws is reeds in de markten ingeprijsd. in de Europese Monetaire Unie. Het is weliswaar We zijn overtuigd dat de Europese Centrale Bank op een 4 Rendementsanalyse een politieke unie, maar een met extreme gegeven moment gemandateerd zal worden door contrasten in de economische realiteit. Duitsland Duitsland om de marktstress op een consistente manier heeft juist aangekondigd dat de werkloosheid voor iedereen zal systematiseren. Op dat moment zullen daalde tot een 18-jarig dieptepunt. Tegelijkertijd de fundamentele factoren opnieuw domineren. kwan het nieuws dat de Europese werkloosheid steeg naar een 12-jarig hoogtepunt. Mede omwille Het inflatie niveau in zowel de VS als in Europa staat op van de euro zwakte is de exportgedreven een niveau dat vraagt (en zelfs smeekt) om meer stimulus economie zeer sterk. Het is zo opvallend dat een op korte tot middellange termijn. De kerninflatie in de VS cynicus het gedrag van de Duitse politici tegenover staat op historisch lage niveau's. Alle inflatoire risico's Onze visie de PIIGS in de schuldencrisis egocentrisch is. Na Griekenland dat in de eerste plaats een geloof- omwille van het kwantitatief ingrijpen lijken op dit moment ongefundeerd te zijn. De taal van de centrale bankiers lijkt waardigheidscrisis was, was het Iers probleem van meer en meer in inflaterende richting te evolueren. Zozeer Omwille van gedwongen bij het begin een bankencrisis. Hierdoor is het als investeerder hen de schuld gaven van een verkeerde aankopen van PIIGS probleem structureler van aard. beslissing te nemen met QE2, zo sterk zijn de cijfers een obligaties, zal de ECB vroeg bewijs van het tegendeel. of laat gedwongen worden Deze crisis werd versneld door de politieke retoriek geld te drukken. dit zal de van Duits kanselier Angela Merkel en haar Franse Ondertussen zijn de aziatische landen, aan het begin van EUR verder onder druk collega Sarkozy. Haar opmerking eind oktober, dat een globale economische heropleving, hun eigen plaatsen. vanaf 2011, investeerders in overheidsobligaties economieën aan het afremmen ten einde een een deel van het risico zullen moeten dragen. Dit gelopperende inflatie te vermijden. In de veronderstelling stuurde de risicopremie voor deze obligaties van dat deze economieën op zichzelf kunnen groeien is dit Ondernemingsobligaties die landen met potentiële probleem de dieperik in. niet zo een probleem. We denken echter dat dit nog niet minder renderen dan Hierdoor werden een aantal landen versneld het geval is en dat dit op kortere termijn de vraag naar overheidsobligaties is een verplicht om hulp te vragen. Hierdoor werd de ECB westerse producten wat kan afremmen. Dit kan op dit abnormale situatie. in een positie van enige koper geduwd. Dit met moment gecompenseerd worden door het stijgende enige tegenzin, want men was reeds van plan om vertrouwen van de Amerikaanse consument die met meer Duitse economische de genomen maatregelen terug te schroeven. De vertrouwen lijkt te spenderen. Dit komt op een zeer «kolonisatie» van Europa zal ECB strategie van monetaire sterilisatie is gelegen moment met het belangrijke eindejaarsseizoen in pas eindigen op het moment onhoudbaar. De recent gekochte obligaties zicht. dat duidelijk wordt hoe sterk (voornamelijk Griekse en Ierse) zijn snel in waarde de Duitse banken aan de aan het dalen, waardoor de balans van de ECB PIIGS blootgesteld zijn. onder druk komt. Dit heeft een remmend effect op de economie, tenzij het gecompenseerd wordt Duitse banken zijn heel sterk met nieuw geld. blootgesteld aan PIIGS. EFSF :European Financial Stability Facility : dit is een speciaal vehikel dat op 9 mei 2010 overeengekomen werd door de 27 lidstaten van Volgend jaar moeten ze 30% de Europese Unie. De doelstelling was om de financiële stabiliiteit in Europa te bewaren door middel van financiële ondersteuning van van hun obligaties lidstaten met problemen. de EFSF is in Luxemburg gevestigd. De Europese Inveseringsbank verzorgt de thesaurie. en administratieve ondersteuning. De EFSF kan met €60 miljard van het Europese Financial Stabilisation Mechanism (dat op zijn beurt fondsen werft van de herfinancieren. Dit kan tot Europese Commissie met het EU budget as onderpand) en tot €250 miljard van het International Monetary Fund (IMF) om in totaal €750 stress leiden in de kern van miljard financiële slagkracht te komen. Europa. ESM: European Stability Mechanism. Een permanent reddingsmechanisme dat het EFSF na de einddatum in Juni 2013. Het ESM moet het EFSF permanent maken,met als belangrijkste verschil dat ESM leningen boven staatspapier staan, terwijl EFSF leningen dit niet zijn. Als eerste stap in de steun is een schuldhaalbaarheidsanalyse, uitgevoerd door de commissie, het IMF en de ECB. Indien het land insolvent geacht wordt starten onderhandelingen voor een herstructureringsplan met hun crediteurs. Een systeem van «collective action clauses» (CACs) laat toe dat een gekwalificeerde meerderheid een herstructurering bindend maakt voor alle betrokken partijen. Bovendien vallen alle uitstaande obligaties onder dit plan. Na deze haalbaarheidsanalyse moet ondersteuning unaniem goedgekeurd door de eurogroep ministers over ondersteuning. Een finale beslissing over de werking van het mechanisme wordt genomen op de meeting van de Raad van Europa op 16 December, 2010. www.nautilusag.com info@nautilusag.com Page 1 of 4 Decem ber-2010
  • 2. Algemene Markt Rendementen (November 2010) Activa Verdeling (December 2010) Market Month-to-date Year-to-date Cash (0.6%,+0.6%): beperkte stijging. De korte termijn rendementen beginnen te stijgen als teken van de spanning in het banksysteem. Performance Performance 3M Treasury Bill 0.0% 0.1% Obligaties (59%, -15%): Nu de the impact van QE2 (kwantitafief Barclays US Treasury 1-3Y Index-0.2% 2.6% ingrijpen) aan het wegebben is na de mededeling van de FED om nog Barclays US Treasury 7-10Y Index -0.8% 13.3% eens 600 miljard USD geld te drukken werd de allocatie in obligaties Barclays US Treasury +20Y Index1.3% - 13.6% serieus teruggeschroefd. In de weging werden de 1-3 jaarsobligaties met 5% verhoogd en de 20+ jarige obligaties met 18%. Dit ten nadele Barclays Corp.Inv.Grade Index -0.8% 10.0% van de weging in de 7-10 jarige die met 11% afgebouwd werden. De Dow Jones World Index -1.9% 5.4% positie ondernemingsobligaties werden volledig afgebouwd. We denken dat de verkoopsgolf op de langetermijnobligaties overdreven Top 5 perform ing sectors was en dat kwantitatief ingrijpen van de centrale banken een proces is Sector Return (Nov 2010) Allocation (Nov 2010) dat nog steeds gaande is en zelfs in Europa kan starten. Deze Energy 1.35% 0.00% kwantitatieve programma›s zullen eveneens op de lange Basic Materials 0.56% 11.23% termijnobligaties gaan toespitsen, omdat hier de grootste Industrial 0.30% 0.00% economische stimulus gerealiseerd kan worden. Dit is een dynamische herweging en moet gezien worden in het kader van de Consumer Services -0.57% 5.88% verlaging van de obligatieweging met 15%. Consumer Goods -0.75% 1.62% De duration in het model steeg van 9 tot 10.5 deze maand. Flop 5 perform ing sectors Sector Return (Nov 2010) Allocation (Nov 2010) Aandelen (40%, +15%): Het meeste slechte macro-economische Technology -1.44% 6.06% nieuws zit reeds in de prijzen verwerkt. De groeilanden zagen een Healthcare -3.37% 0.00% duidelijk daling in november, samen met de ontwikkelde markten, met Financials -5.07% 0.00% Europa voorop. Met het resultatenseizoen achter de rug, werd het duidelijk dat de ondernemingen in goede vorm zijn en dat de Telecoms -5.52% 0.40% winstmarges op de hoogste niveaus staan sinds enkele decennia. Dit Utilities -5.63% 0.00% weerspiegelde zich in de voorbije maanden niet in de aandelenkoersen die overschaduwd werden door macro- Europese CDS spreads en EUR/USD (Okt-Nov 2010) economische berichten. We behouden onze blootstelling aan de financiële sector uiterst laag, gezien dit de sector blijft met het grootste 1.44 500 B ilaterale o vereenko mst tussen M erkel en Sarko zy die zei dat de privé secto r tevens risico mo et meedragen. risico tegenover de landencrisis. 1.42 Sector weging 400 1.4 De voornaamste overgewichten en ondergewichten van vorige maand CDS Spread (% points) worden bevestigd en in sommige gevallen verstevigd. Basic materials EUR/USD rate 1.38 (11.3%, -0.6%), Consumentengoederen (10%, +8.3%) en 300 consumenten diensten (7%, +1.5%).Grootste ondergewichten blijven 1.36 Olie&gas (0.7%, +0.7%), Financiële sector (2.6%, +2.5%) en nutsbedrijven (0.9% +0.9%). het gewicht in de technologiesector werd 200 1.34 verlaagd met -4.2% tot 1.9%. 1.32 Het grootste overgewicht hebben we in basismaterialen. Momenteel is 100 er een consolidatiegolf gaande. Bovendien lijkt de evolutie in de USD meer en meer ontkoppeld van de evolutie van de grondstofprijzen. 1.3 Eenmaal dit duidelijk wordt, kan een tweede stijging van de grondstoffen aanvatten. 0 1.28 01 0 .1 08.10 1 0 5.1 22.10 29.10 05.11 1 1 2.1 1 1 9.1 26.11 P o rtugal Spain Italy B elgium Germany EUR/USD (right scale) Geografisch weging B ro n : B lo o mberg, Nautilus Een duidelijke stijging van het gewicht in Japan dat met 16.9% duidelijk De bovenstaande grafiek illustreert de Europese miserie made in het grootste gewicht krijgt in de portefeuille. De Japanse beurs deed het Germany. het toont de marktreactie op de aankondiging van de zeer goed in de voorbije maand en heeft nog meer ruimte om te bilaterale gesprekken tussen Duitsland en Frankrijk die zeiden dat de herstellen gezien zijn slecht rendement sinds het begin van dit jaar. obligatiemarkt een deel van de schade moet dragen bij landen die Bovendien zal een recente verzwakking van de Yen tegenover de geholpen worden. Dit werd als zeer negatief gezien door de munten van de voornaamste handelspartners de exportsector helpen. investeerders die direct een hogere risicopremie eisten voor het Alle andere landen blijven ondergewogen tegenover de benchmark, aanhouden van staatsobligaties uit risicolanden. Zelfs de kernlanden met uitzondering van de VS dat neutraal gewogen blijft. De VS zal kwamen onder druk in het voordeel van Duits staatspapier. Deze blijven profiteren van het kwantitatief programma dat nog 5 maanden bewoording werd ondertussen gewijzigd. Schade is echter toegericht. loopt. Nautilus Capital AG www.nautilusag.com info@nautilusag.com Page 2 of 4 Decem ber-2010
  • 3. Current Asset Allocation Asset Allocation Historical Asset Allocations Cash Cash (Last 5 years) Fixed Inco me 80.0% Fixed Inco me Equity Equity 100.0% 60.0% 75.0% 40.0% 50.0% 20.0% 25.0% 0.7% 59.0% 40.4% 0.0% 0.0% Dez 05 Dez 06 Dez 07 Dez 08 Dez 09 Dez 10 A sset Classes Fixed Income Allocation: Sector Fixed Income Allocation: Duration 40.0% 40.0% 30.0% 30.0% 20.0% 20.0% 10.0% 10.0% 2.9% 35.6% 20.5% 0.0% 2.9% 35.6% 20.5% 0.0% 0.0% UST 1 Year UST 7-1 Year UST 20+ Year -3 0 US Co rp.Inv <3 Years 7-1 Years 0 10-20 Years Equity Allocation: Regions Equity Allocation: Industries 0% 4% 8% 12% 16% 20% 0% 2% 4% 6% 8% 10% 12% United Kingdom 2.2% B asic M aterials 10.7% Co ns. Go o ds 10.0% No rth A merica 14.5% Co ns. Services 7.4% Latin A merica 0.0% Financials 2.6% Health Care 1.3% Japan 16.9% Industrials 3.8% Europe, Ex-UK (Eme) 0.0% Oil & Gas 0.7% 5.1% Techno lo gy 1.9% Europe, Ex-UK (Dev) Telco s 1% .1 A sia/P acific, Ex-Japan 1.6% 0.9% Utilities Equity Allocation: Under/Over Regions Equity Allocation: Under/Over Industries Europe, Ex-UK (Eme) -87.1% B asic M aterials 166.0% Co nsumer Go o ds 105.3% Europe, Ex-UK (Dev) -28.3% Co nsumer Services 91.7% United States 1% .1 Financials -69.2% Health Care -49.0% United Kingdom -3.0% Industrials -30.4% Latin A merica -100.0% Oil & Gas -83.2% Techno lo gy -44.1% Japan 435.6% Telco s -44.8% A sia/P acific, Ex-Japan -64.3% Utilities -52.5% -50% -25% 0% 25% 50% -50 -25 0% 25 50 75 100 125 150 1 200 75 % % % % % % % % % % Nautilus Capital AG www.nautilusag.com info@nautilusag.com Page 3 of 4 Decem ber-2010
  • 4. Performance Analysis DRM US 3M US Aggregate Benchmark** Dow Jones Treasury Agg. World Bond Index Return Currency USD USD USD USD USD Month Return (Nov-10) -0.8% -1.2% -1.9%0.0% -0.6% Year-to-date Return 3.1% 6.6% 5.4%0.1% 7.7% Last 12 Months Return 3.9% 6.7% 7.6%0.1% 6.0% Last 24 Months Return 3.7% 12.8% 20.1%0.1% 8.8% Total Annual Return * 8.9% 5.3% 4.9%2.1% 5.7% Standard Deviation (Volatility) * 7.5% 8.4% 16.9%0.5% 3.8% Semi-Standard Deviation (<0) * 7.1% 9.9% 19.2% NM 3.8% Sharpe Ratio * ( rf = 2.07% ) 0.91 0.38 0.17 NM 0.97 Sortino Ratio * ( rf = 2.07% ) 0.96 0.33 0.15 NM 0.97 Positive Months * 67.3% 64.5% 99.1% 58.9% 69.2% Average Monthly Return * 0.7% 0.4% 0.4%0.2% 0.5% All figures are annualized measures of returns. * Period: Jan-02 to Nov-10. ** Benchmark = 5% UST 3M + 22.5% UST 1-3Y + 9% UST 7-10Y + 5.4% UST 20+Y + 8.1% US Corp. Inv. Grade Bonds + 50% Dow Jones Aggr. World Equity Index. Cummulative Performance 250 Cummulative Outperformance 100% DRM 200 B enchmark 75% 150 50% 25% 100 0% 50 -25% Dez Dez Dez Dez Dez Dez Dez Dez Dez Dez Dez Dez Dez Dez Dez Dez Dez Dez 01 02 03 04 05 06 07 08 09 01 02 03 04 05 06 07 08 09 Current Month Performance Attribution Cash Rew ard to Risk Analysis of Returns vs. Benchmark Fixed Inco me 12.5% Equities To tal 10.0% Realized Return 5.0% 5.0% DRM (Reward) 7.5% 2.5% 2.5% 5.0% US Ag Bd Benchmark Dow Jones 0.0% 0.0% Index Agg. World 2.5% Index 3M -Treasury -2.5% -2.5% 0.0% 0% 5% 10% 15% 20% 25% -5.0% -5.0% A sset A llo catio n Secto r Ro tatio n To tal Value A dded Incurred Volatility (Risk) This publication is for your information only and is not intended as an offer, or a solicitation of an offer, to buy or sell any Investment or other specific product. Although all information and opinions expressed in this document were obtained from sources believed to be reliable and in good faith, no representation or warranty, express or implied, is made as to its accuracy or completeness. All information and opinions as well as any prices indicated are subject to change without notice. At any time Nautilus Capital ("Nautilus") (or employees thereof) may have a long or short position, in relevant securities. Some investments may not be readily realisable at times of illiquid market circumstances. Therefore valuing the investment and identifying the risk to which you are exposed may be difficult to quantify. Futures and options trading is considered risky and past performance of an investment is not a guide to its future performance. Some investments may be subject to a decline in value and on realisation you may receive back less than you invested. Changes in FX rates may have an adverse effect on the price, value or income of an investment. Each investment needs to be seen in the context of your particular investment objectives, financial situation and needs and we would recommend that you take financial advice as to the tax implications of investing in any of the products mentioned herein. Nautilus Capital AG www.nautilusag.com info@nautilusag.com Page 4 of 4 Decem ber-2010