Download to read offline


![TheBird’sEye
View [CELLRANGE]
[CELLRANGE]
[CELLRANGE]
[CELLRANGE]
[CELLRANGE][CELLRANGE][CELLRANGE][CELLRANGE][CELLRANGE][CELLRANGE]
[CELLRANGE]
[CELLRANGE]
[CELLRANGE]
[CELLRANGE]
[CELLRANGE]
[CELLRANGE]
[CELLRANGE][CELLRANGE][CELLRANGE]
[CELLRANGE]
[CELLRANGE]
0
2,000,000,000
4,000,000,000
6,000,000,000
8,000,000,000
10,000,000,000
12,000,000,000
2007 2008 2009 2010 2011 2012 2013 2014 2015 2016
National Budget EU Funds Unspecified](https://image.slidesharecdn.com/antonnetworkpublicprocurementdss20171128-171206073240/75/Network-Analysis-Public-Procurement-7-2048.jpg)


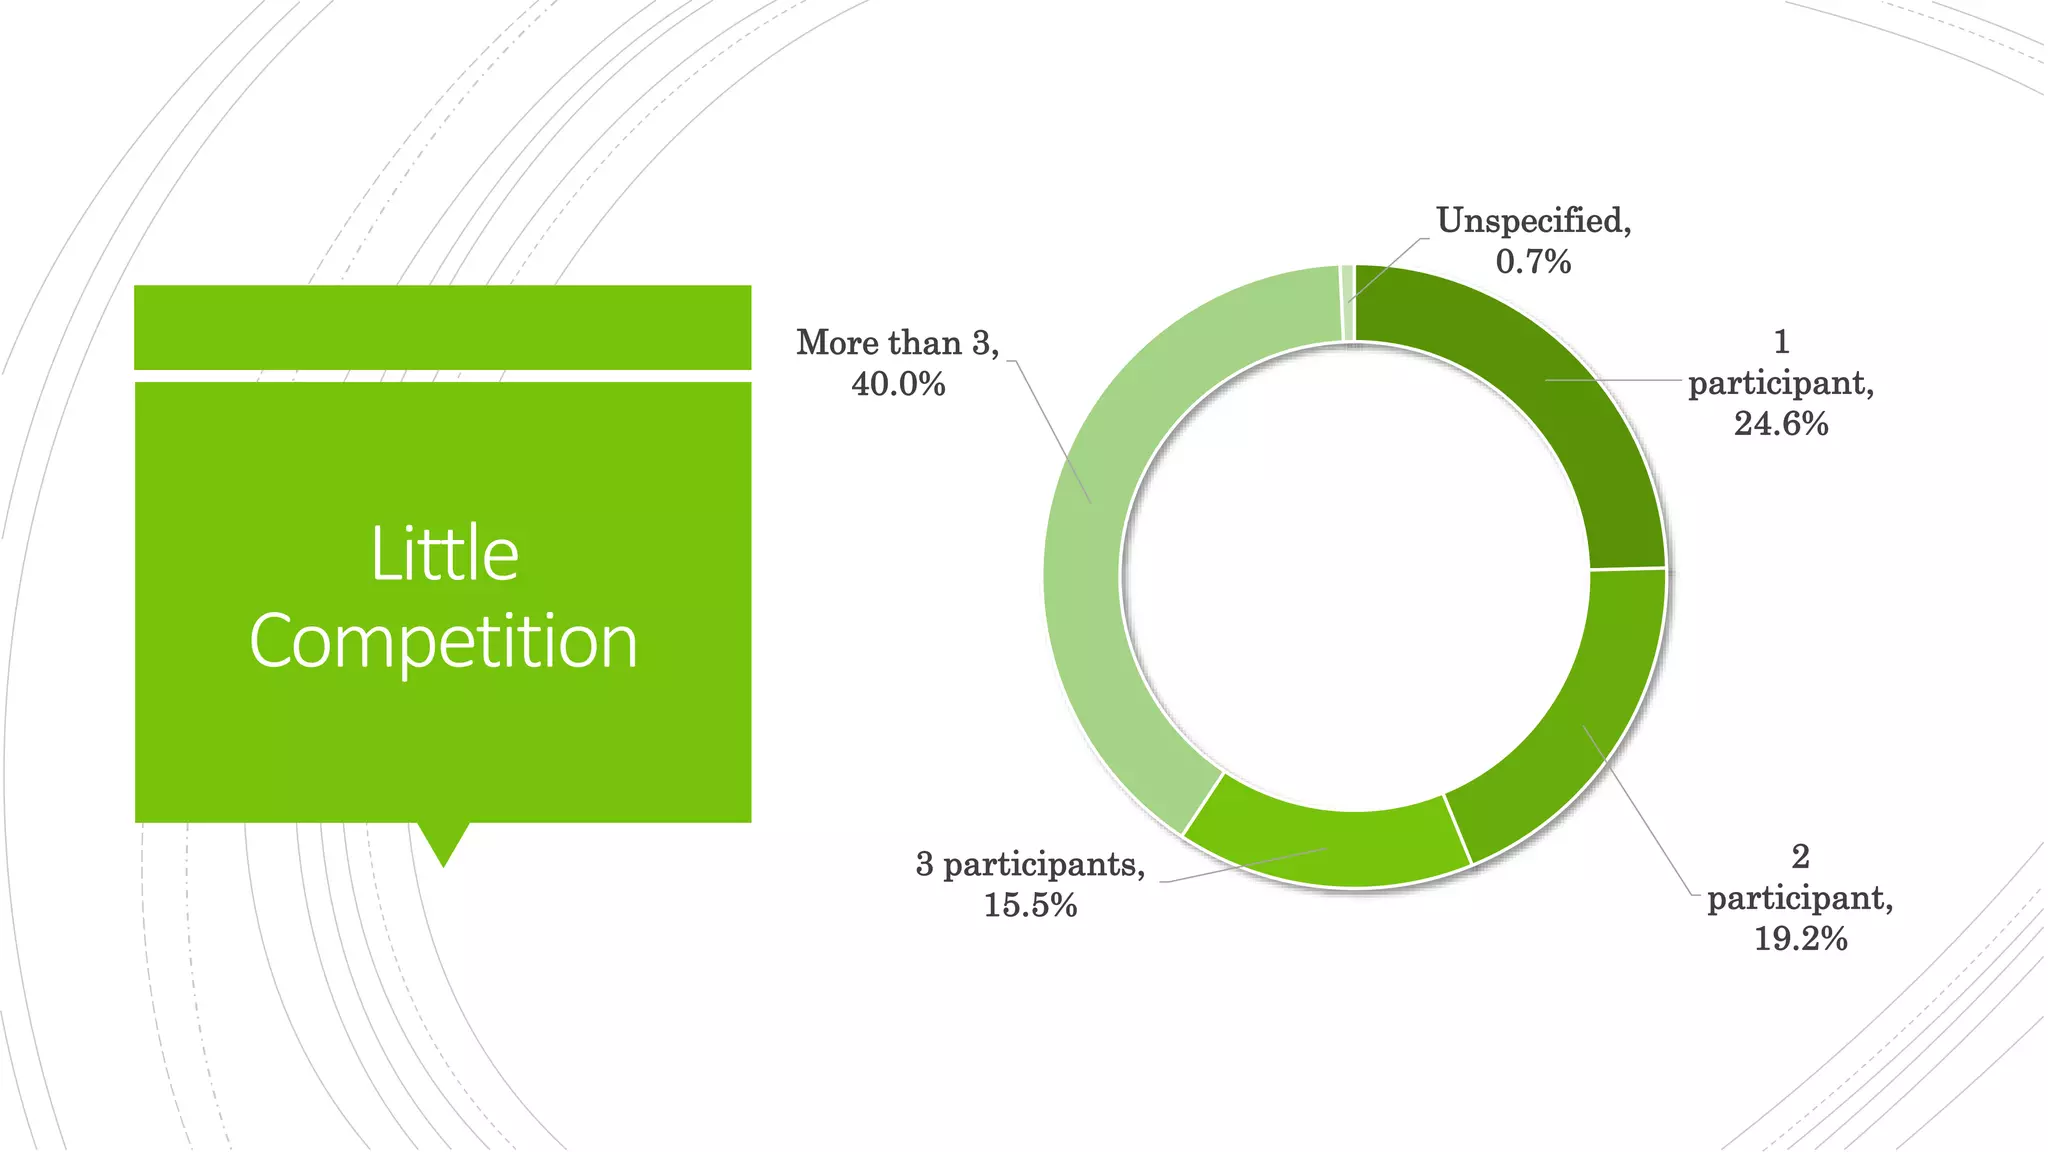


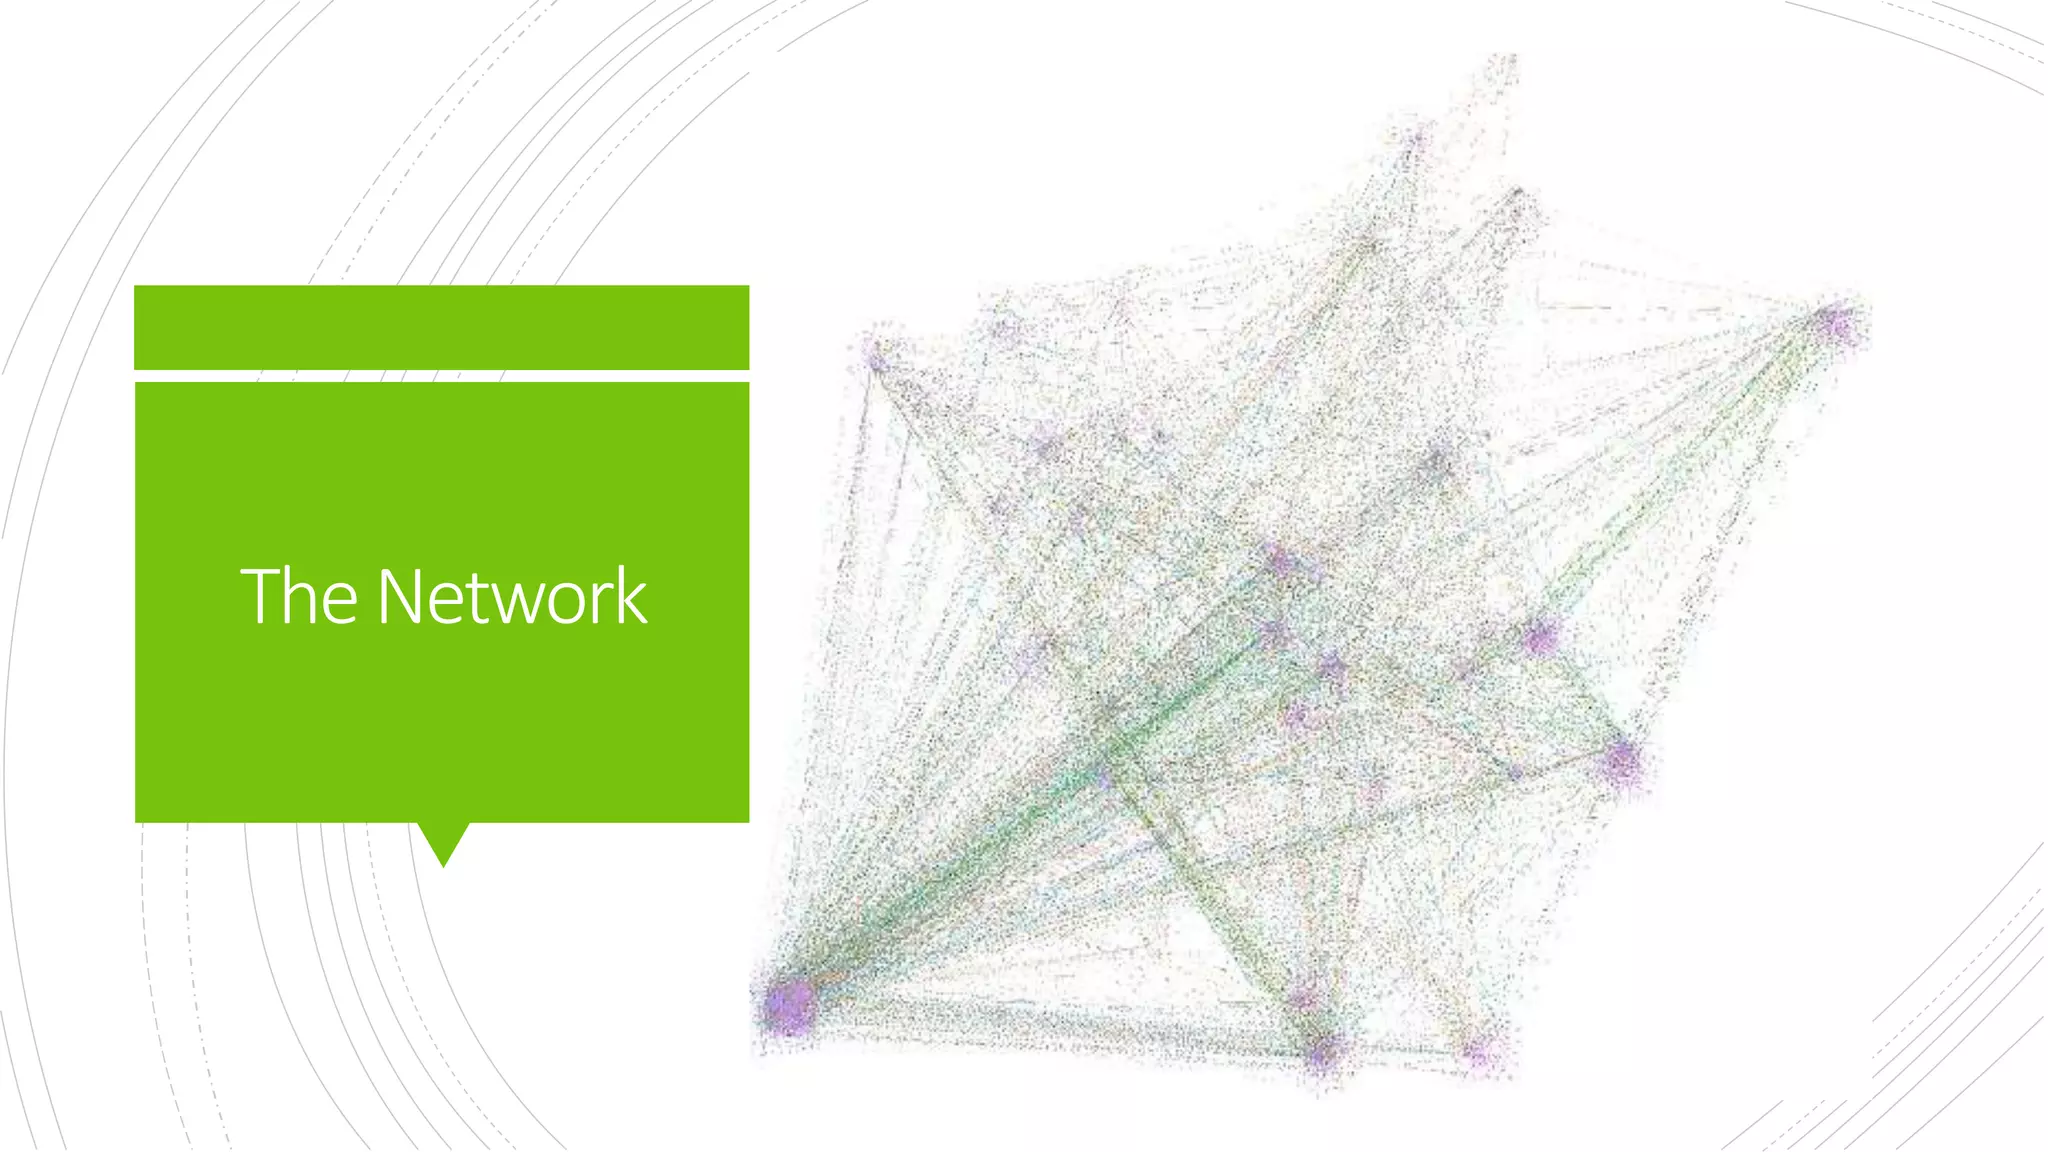


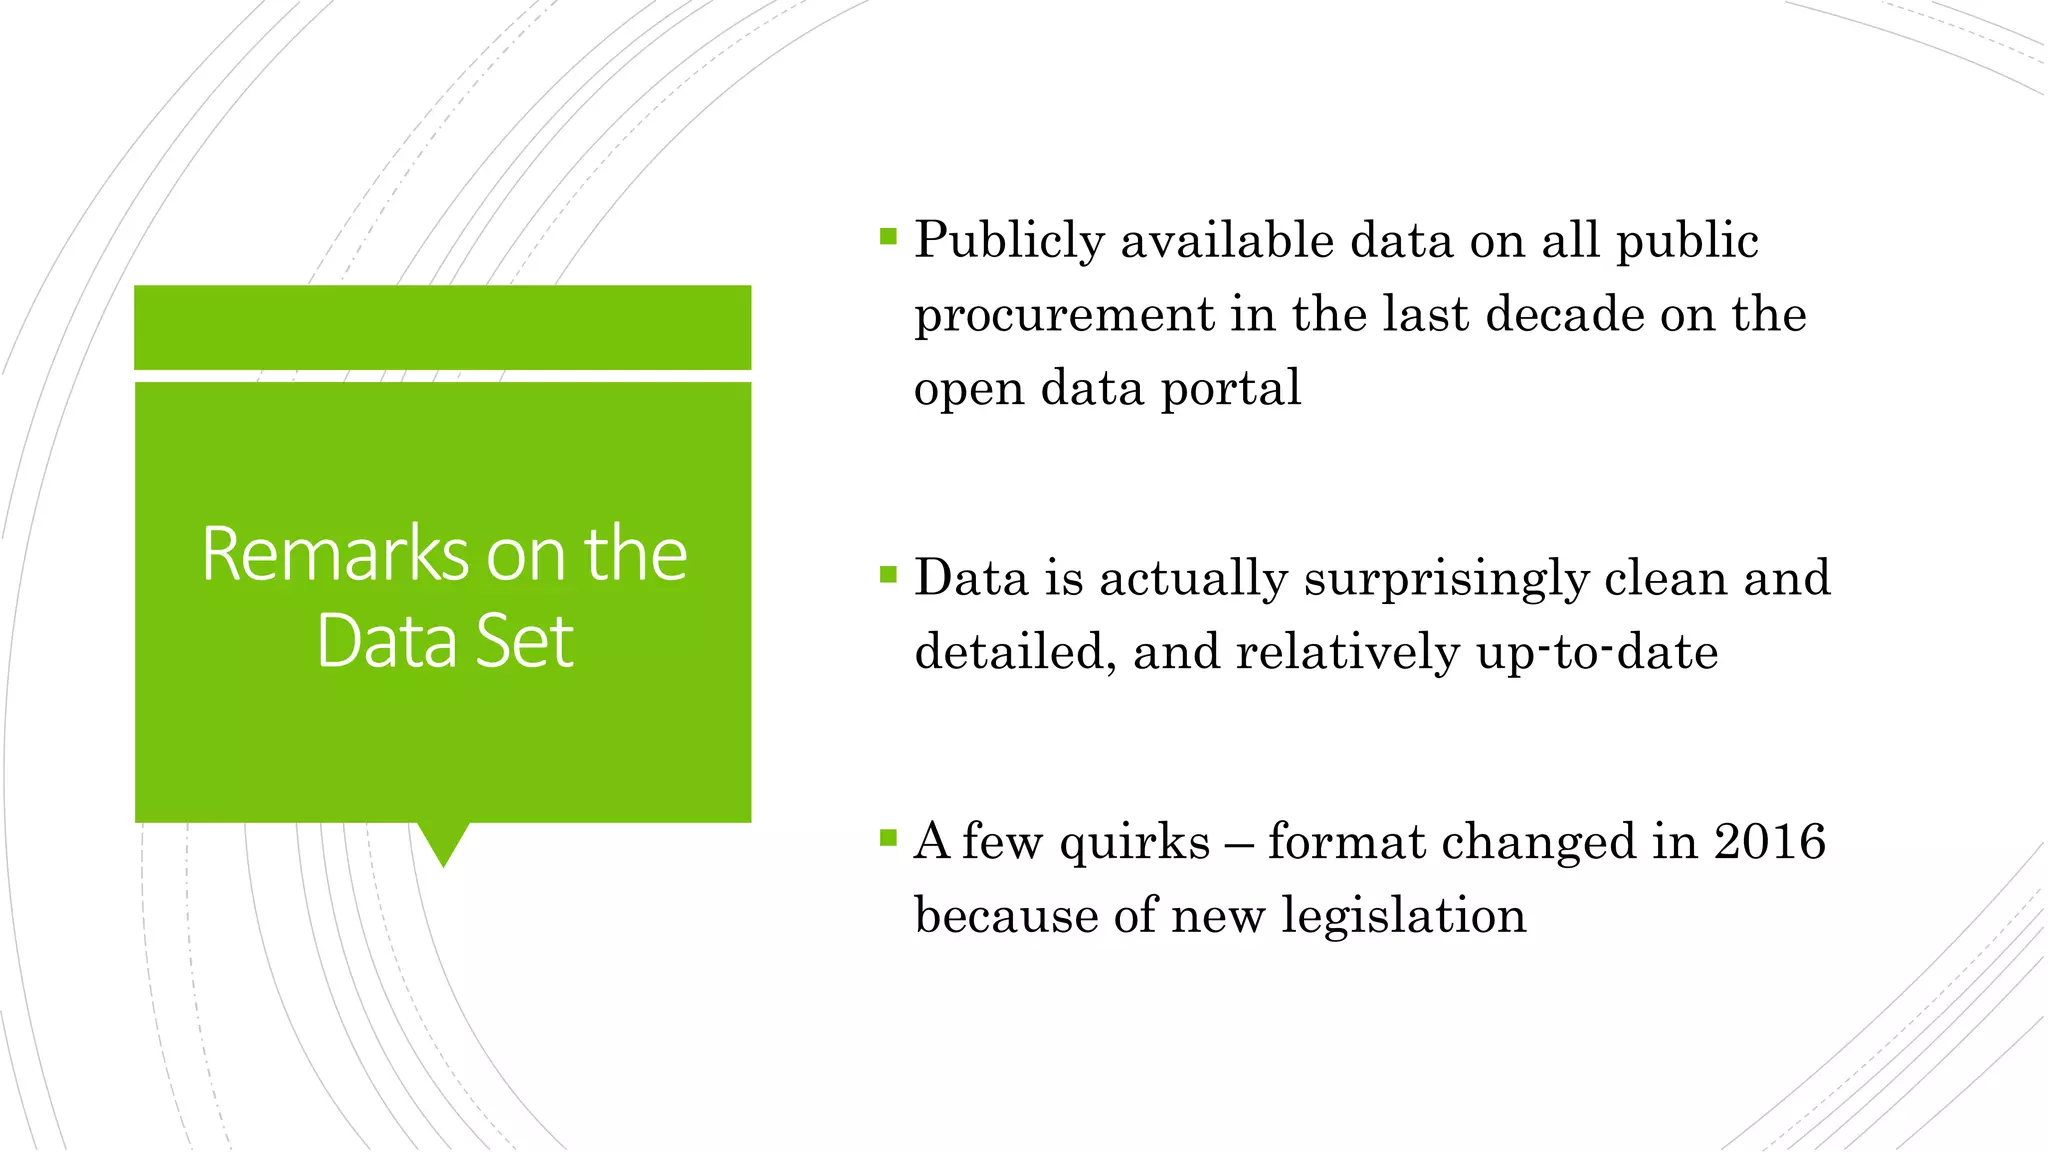
The document discusses public procurement data from 2007-2016, highlighting the availability and cleanliness of the dataset, which includes over 193,000 contracts across 21,558 unique firms. It emphasizes the low competition in procurement, the potential benefits of network analysis for firms, and proposes applications for enhancing procurement strategies and accountability. The presentation is led by Anton Gerunov, who aims to explore the network relationships in public procurement.


![[Data Meetup] Data Science in Finance - Factor Models in Finance](https://cdn.slidesharecdn.com/ss_thumbnails/factormodelsinfinance-metodinikolov-191009091837-thumbnail.jpg?width=640&height=640&fit=bounds)
![[Data Meetup] Data Science in Finance - Building a Quant ML pipeline](https://cdn.slidesharecdn.com/ss_thumbnails/buildingaquantmlpipeline-191009091209-thumbnail.jpg?width=640&height=640&fit=bounds)
![[Data Meetup] Data Science in Journalism - Tanbih, QCRI and MIT](https://cdn.slidesharecdn.com/ss_thumbnails/dsspreslavnakov2019-08-222-190901181352-thumbnail.jpg?width=640&height=640&fit=bounds)


