1. SUPPLEMENTARY INFORMATION
doi: 10.1038/ngeo756
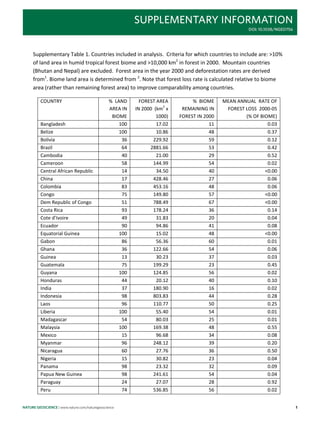
Supplementary Table 1. Countries included in analysis. Criteria for which countries to include are: >10%
of land area in humid tropical forest biome and >10,000 km2 in forest in 2000. Mountain countries
(Bhutan and Nepal) are excluded. Forest area in the year 2000 and deforestation rates are derived
from1. Biome land area is determined from 2. Note that forest loss rate is calculated relative to biome
area (rather than remaining forest area) to improve comparability among countries.
COUNTRY % LAND FOREST AREA % BIOME MEAN ANNUAL RATE OF
2
AREA IN IN 2000 (km x REMAINING IN FOREST LOSS 2000-05
BIOME 1000) FOREST IN 2000 (% OF BIOME)
Bangladesh 100 17.02 11 0.03
Belize 100 10.86 48 0.37
Bolivia 36 229.92 59 0.12
Brazil 64 2881.66 53 0.42
Cambodia 40 21.00 29 0.52
Cameroon 58 144.99 54 0.02
Central African Republic 14 34.50 40 <0.00
China 17 428.46 27 0.06
Colombia 83 453.16 48 0.06
Congo 75 149.80 57 <0.00
Dem Republic of Congo 51 788.49 67 <0.00
Costa Rica 93 178.24 36 0.14
Cote d’Ivoire 49 31.83 20 0.04
Ecuador 90 94.86 41 0.08
Equatorial Guinea 100 15.02 48 <0.00
Gabon 86 56.36 60 0.01
Ghana 36 122.66 54 0.06
Guinea 13 30.23 37 0.03
Guatemala 75 199.29 23 0.45
Guyana 100 124.85 56 0.02
Honduras 44 20.12 40 0.10
India 37 180.90 16 0.02
Indonesia 98 803.83 44 0.28
Laos 96 110.77 50 0.25
Liberia 100 55.40 54 0.01
Madagascar 54 80.03 25 0.01
Malaysia 100 169.38 48 0.55
Mexico 15 96.68 34 0.08
Myanmar 96 248.12 39 0.20
Nicaragua 60 27.76 36 0.50
Nigeria 15 30.82 23 0.04
Panama 98 23.32 32 0.09
Papua New Guinea 98 241.61 54 0.04
Paraguay 24 27.07 28 0.92
Peru 74 536.85 56 0.02
nature geoscience | www.nature.com/naturegeoscience 1
3. doi: 10.1038/ngeo756
SUPPLEMENTARY INFORMATION
Supplementary Table 2. Variables used as correlates with rates of forest loss. Only variables without
colinearity (VIF<5) were used. Values in table are standardized coefficient with standard error in
parentheses from ordinary least squares regression. Arcsine transformation was performed on the
dependent variable. n= 41. See below for explanation of how variables were derived.
VARIABLE SOURCE SATELLITE- SATELLITE-DERIVED FOREST
DERIVED FOREST LOSS (significant variables
LOSS (all variables) only)
Intercept .031*** .031***
(.003) (.003)
DEMOGRAPHIC
VARIABLES:
A. Annual urban growth rate 3 .019*** .016***
2000-05 (.005) (.004)
B. Annual rural growth rate .001
(2000-05) 3 (.005)
C. Total annual growth rate -.011* -.010**
(2000-05) 4 (.005) (.004)
% of population urban .003
(2000) 3 (.005)
AGRICULTURE
PRODUCTION VARIABLES:
Net agricultural trade per
capita
(US$thousand/person) Calculated from 4 .009* .008**
(2003-04) and 5 (.004) (.003)
% of agricultural
production exported .008# .007#
(2001-03) Calculated from 5 (.004) (.004)
Agricultural exports/total
production (2004) -.004
(US$thousand/tonne) Calculated from 5 (.004)
% forest remaining in -.002
biome in 2000 Calculated from (.003)
1,5
ECONOMIC VARIABLES:
GDP per capita (average .005
2000-05) 6 (.004)
Annual GDP growth (2000- -.001
05) 6 (.004)
2
R .59 .52
2
Adjusted R .46*** .47***
***p<0.001, **p<0.01, *p<0.05, #p<0.10
nature geoscience | www.nature.com/naturegeoscience 3
4. SUPPLEMENTARY INFORMATION doi: 10.1038/ngeo756
Derivations of variables for those not directly taken from the respective source were:
Net agricultural trade per capita: calculated from value of agricultural trade (exports minus
imports) divided by total population for each country (constant 1995 $US).
Percent of agricultural production exported: calculated from balance sheets for cereals,
vegetable oils, meat and sugar. The proportion of quantity exported to total quantity produced was
calculated for each group. These values were weighted by the proportion of the food group to total
production across all the groups and summed across groups.
Value of agricultural exports per total production: calculated from export value divided by the
sum of production in FAO group I (cereals), group II (root and tuber crops, pulses, and oilseeds), and
group III (sugar cane and beets, coffee, cocoa beans, tea, and livestock products).
Percent forest remaining in biome: The forest area derived from 1 was normalized to the area of
the humid tropical forest biome delineated by 2 for each country.
Dates used for the variables were the best available from the data.
4 nature geoscience | www.nature.com/naturegeoscience
5. doi: 10.1038/ngeo756
SUPPLEMENTARY INFORMATION
Supplementary Table 3. Tolerance values (1-r2) for all pairs of variables used in the regressions.
Tolerance values should be greater than .2 to avoid collinearity.
A B C D E F G H I
A
B 0.91
C 0.53 0.81
D 0.91 0.56 0.98
E 0.99 0.99 1.00 1.00
F 0.92 1.00 0.96 0.98 0.62
G 1.00 0.98 1.00 0.99 0.80 0.71
H 0.87 0.72 0.95 0.53 0.99 0.91 0.91
I 0.75 0.96 0.97 0.91 0.97 0.98 1.00 0.99
J 0.95 0.94 1.00 0.86 0.98 0.99 0.99 0.96 0.94
LABEL VARIABLE
A annual urban growth rate
B annual rural growth rate
C total annual growth rate
D percent of population urban
E net agricultural trade per capita
F % of agricultural production
exported
G agricultural exports/total production
H GDP per capita
I Annual GDP growth
J percent forest remaining in biome
nature geoscience | www.nature.com/naturegeoscience 5
6. SUPPLEMENTARY INFORMATION doi: 10.1038/ngeo756
Supplementary Table 4. Variance Inflation Factor (VIF) for variables used in linear regression. VIF
should be <5 to avoid multicollinearity. See Supplementary Table 3 for legend to variables.
Variable VIF
A 3.57
B 2.75
C 3.01
D 3.32
E 1.99
F 2.30
G 1.81
H 2.65
I 1.79
J 1.35
6 nature geoscience | www.nature.com/naturegeoscience
7. doi: 10.1038/ngeo756
SUPPLEMENTARY INFORMATION
Supplementary Table 5. Multicollinearity diagnostics for variables used in linear regression. Condition
index should be <30 to avoid multicollinearity. See Supplementary Table 3 for legend to variables.
Number Condition Decomposition proportions
Index
A B C D E F G H I J
1 1.00 .01 .01 .01 .02 .00 .01 .01 .02 .01 .01
2 1.29 .00 .01 .11 .01 .09 .06 .06 .00 .00 .01
3 1.51 .05 .01 .06 .03 .01 .00 .04 .03 .03 .02
4 1.74 .00 .03 .05 .00 .00 .00 .00 .02 .18 .25
5 1.80 .00 .00 .00 .00 .00 .00 .00 .00 .00 .00
6 2.12 .00 .00 .04 .03 .04 .04 .01 .01 .22 .41
7 2.39 .03 .18 .03 .02 .01 .04 .25 .14 .05 .00
8 2.80 .07 .11 .00 .03 .31 .03 .39 .10 .03 .06
9 3.37 .01 .00 .01 .05 .51 .71 .02 .11 .03 .19
10 4.34 .07 .23 .03 .78 .02 .11 .23 .46 .18 .02
11 4.88 .76 .42 .78 .05 .01 .00 .00 .12 .26 .02
nature geoscience | www.nature.com/naturegeoscience 7
8. SUPPLEMENTARY INFORMATION doi: 10.1038/ngeo756
Supplementary Table 6. Countries and tropical humid forest area in year 2000 in each terminal node of
regression tree. Nodes are numbered from left to right in figure 2.
Node Number Countries Humid tropical Percent of total
Number of forest area (km2 x remaining humid
countries 1000) tropical forest
area
1 8 China, Colombia, Ecuador, India, 2105 23
Mexico, Mynamar, Peru, Vietnam
2 2 Indonesia, Laos 915 10
3 18 Bangladesh, Bolivia, Cameroon, 2298 26
Central African Republic, Democratic
Republic of Congo, Cote d'Ivoire,
Equatorial Guineau, Gabon, Guinea,
Honduras, Liberia, Madagascar,
Nigeria, Panama, Papau New
Guineau, Philippines, Venezuela
4 2 Cambodia, Sierra Leone 38 <1
5 2 Congo, Suriname 246 3
6 3 Brazil, Guatemala, Nicaragua 2929 33
7 2 Guyana, Thailand 215 2
8 2 Belize, Costa Rica 29 <1
9 2 Malaysia, Paraguay 196 2
8 nature geoscience | www.nature.com/naturegeoscience
9. doi: 10.1038/ngeo756
SUPPLEMENTARY INFORMATION
Supplementary Figure 1. Satellite-derived annual forest loss 1 and annual change in forest area reported
by FAO 7 for 2000-05. The data sets are not strictly comparable because they cover different spatial
extents and vary in definition of forest. Satellite- derived rate refers to gross percent loss of total humid
tropical forest biome in the country while country reports are percent change in net forest area.
Positive values refer to forest loss and negative values to forest gain. R2 is 0.03 (adjusted R2 is 0.01) with
insignificant p-value.
4
FAO annual change in forest area
3
2
1
0
0.00 0.20 0.40 0.60 0.80 1.00
-1
-2
-3
Satellite-derived 2000-05 annual forest lost
nature geoscience | www.nature.com/naturegeoscience 9
10. SUPPLEMENTARY INFORMATION doi: 10.1038/ngeo756
References for Supplementary Material
1
Hansen, M.C. et al., Humid tropical forest clearing from 2000 to 2005 quantified using
multi-temporal and multi-resolution remotely sensed data. Proceedings of the National
Academy of Sciences 105 (27), 9439-9444 (2008).
2
Olson, D. et al., Terrestrial ecoregions of the world: A new map of life on earth.
BioScience 51 (11), 933-938 (2001).
3
United Nations, World Urbanization Prospects: The 2005 Revision. (2006).
4
United Nations, World Population Prospects: The 2006 Revision. (2007).
5
FAO, FAO Statistical Yearbook 2005-2006. (2007).
6
World Bank, 2007 World Development Indicators. (2007).
7
FAO, Global Forest Assessment 2005. FAO Forestry Paper 147 (2006).
10 nature geoscience | www.nature.com/naturegeoscience