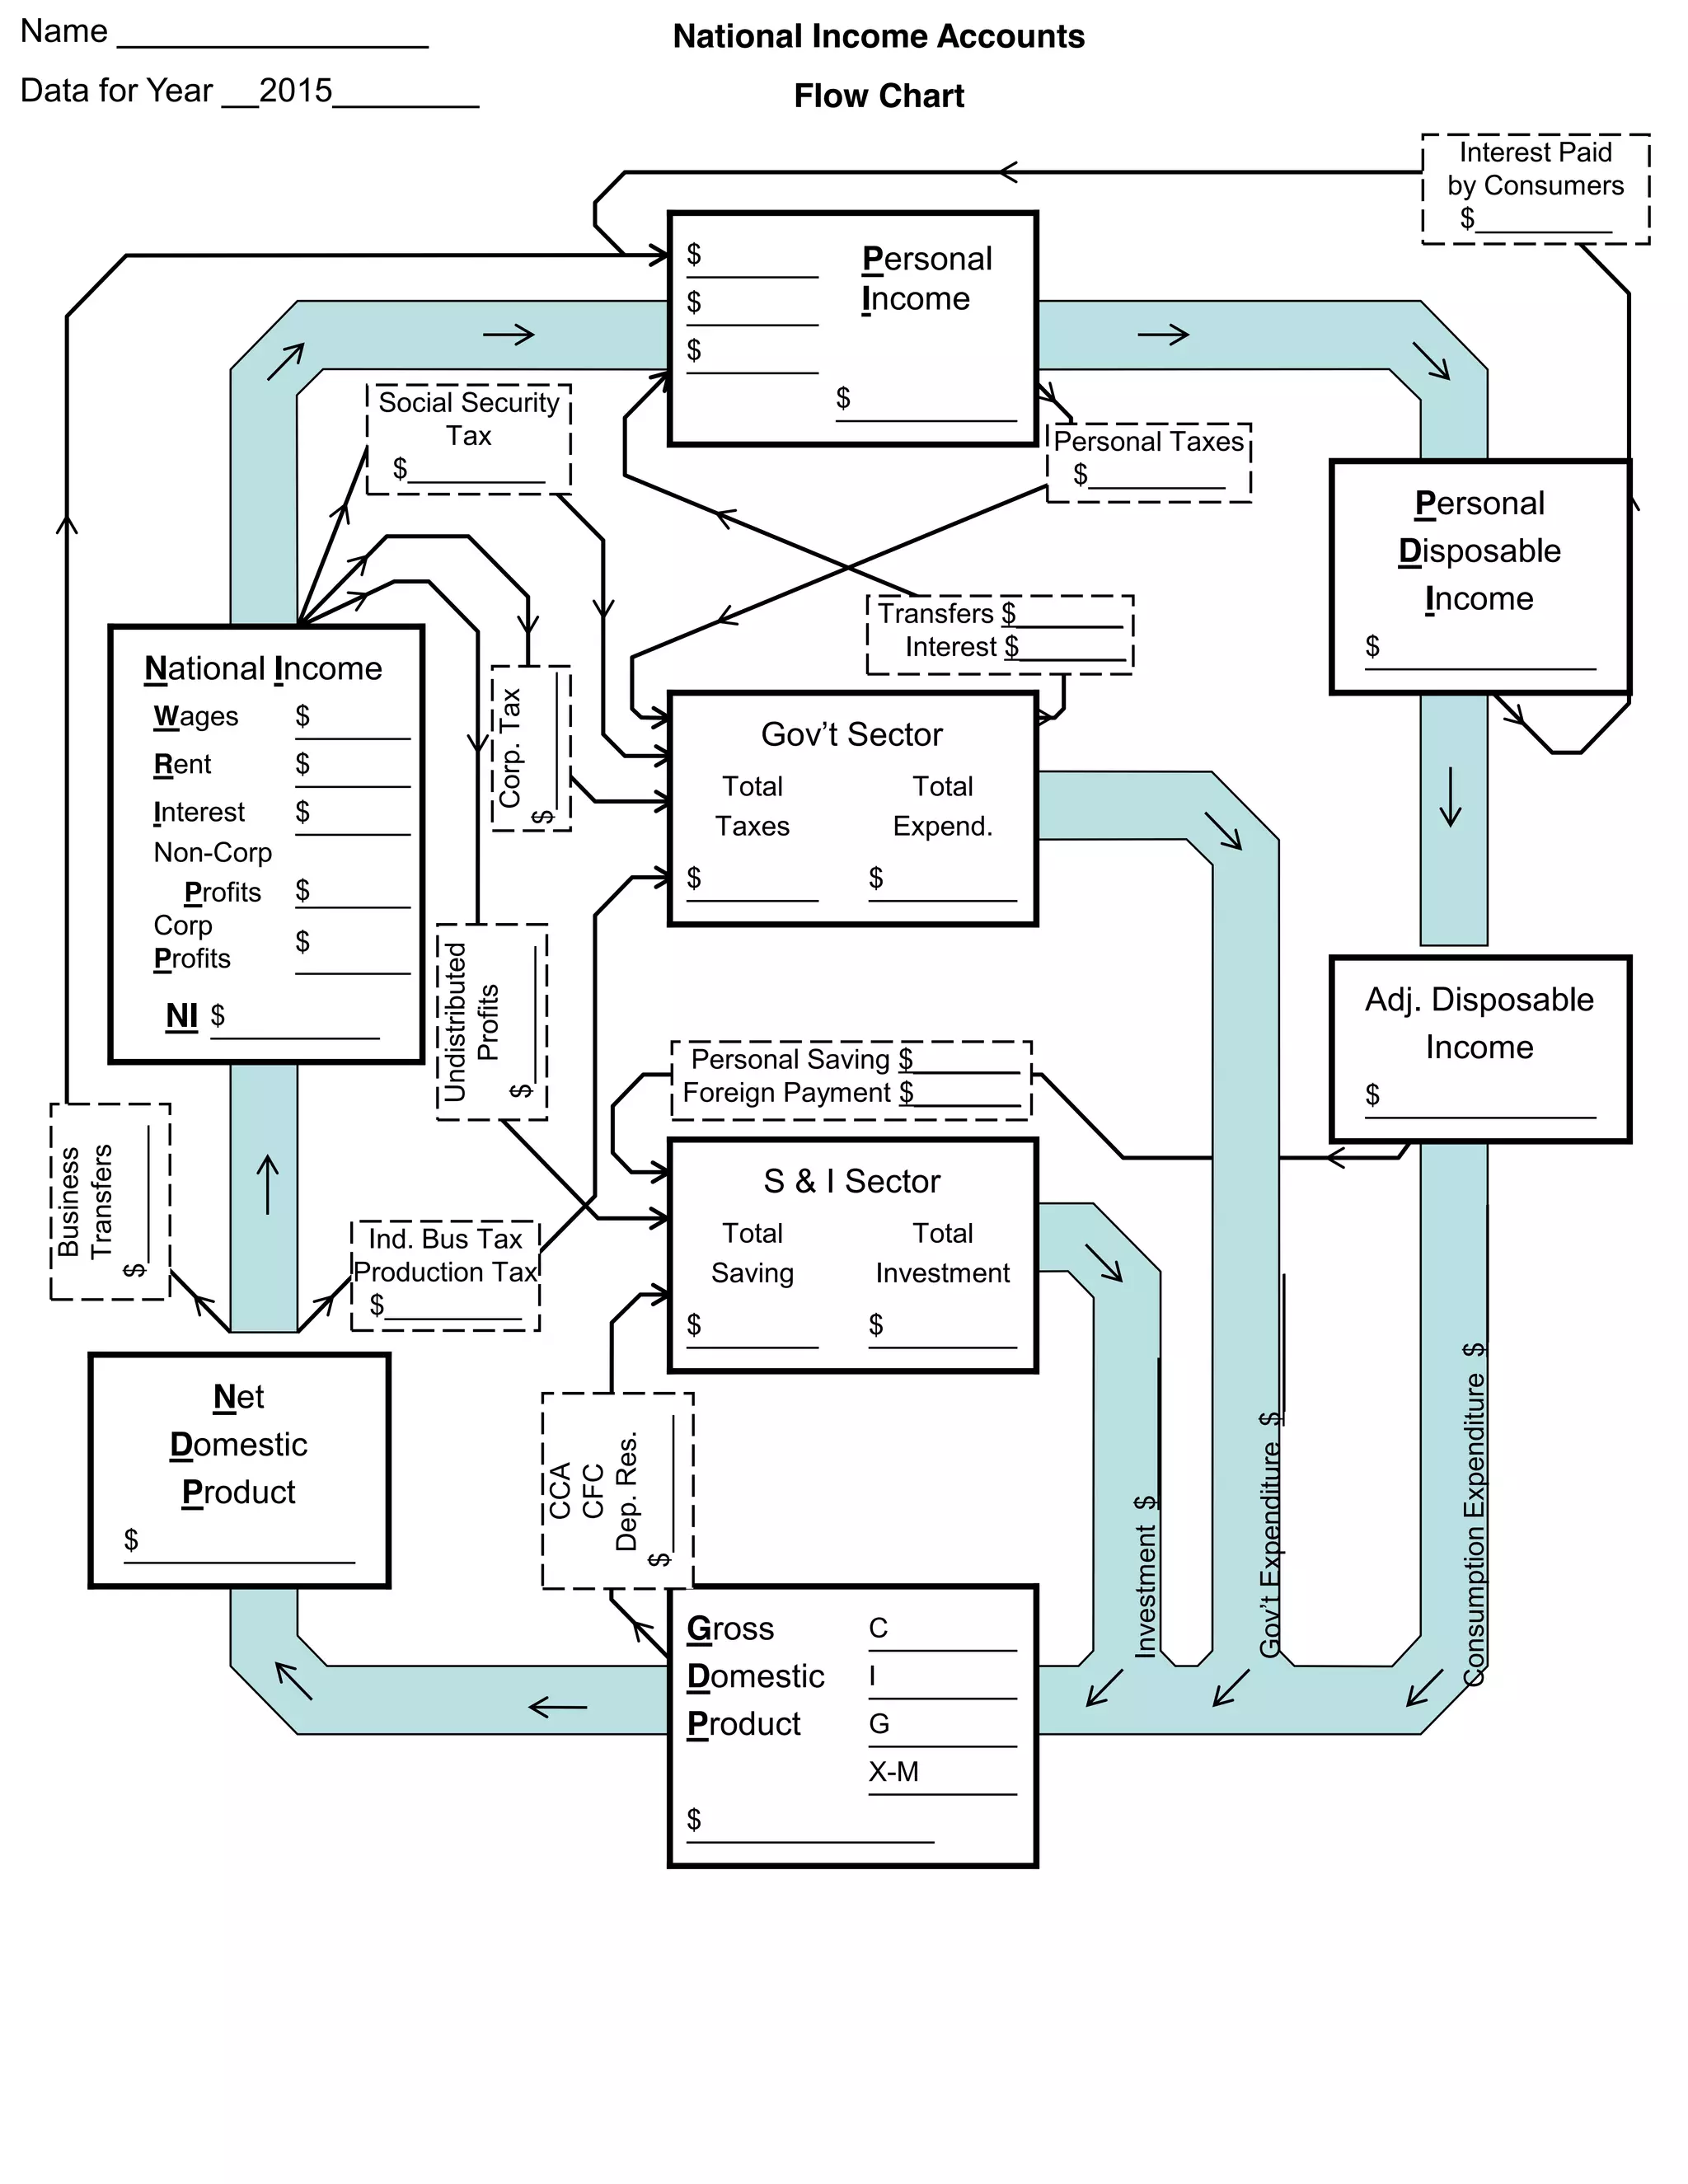
This document is a flow chart showing the national income accounts for a year. It outlines the relationships between different sectors of the economy including personal income, government taxes and expenditures, savings and investment, gross domestic product, and its components of consumption, investment, government spending, and net exports. Arrows show the flows of funds between these different economic aggregates.