监控 Windows 服务器
1.监控内容
windows 服务器的内部参数包括以下
a. 内存使用状况
b. CPU 负载
c. 磁盘使用状况
d. 服务状态
e. 运行的进程
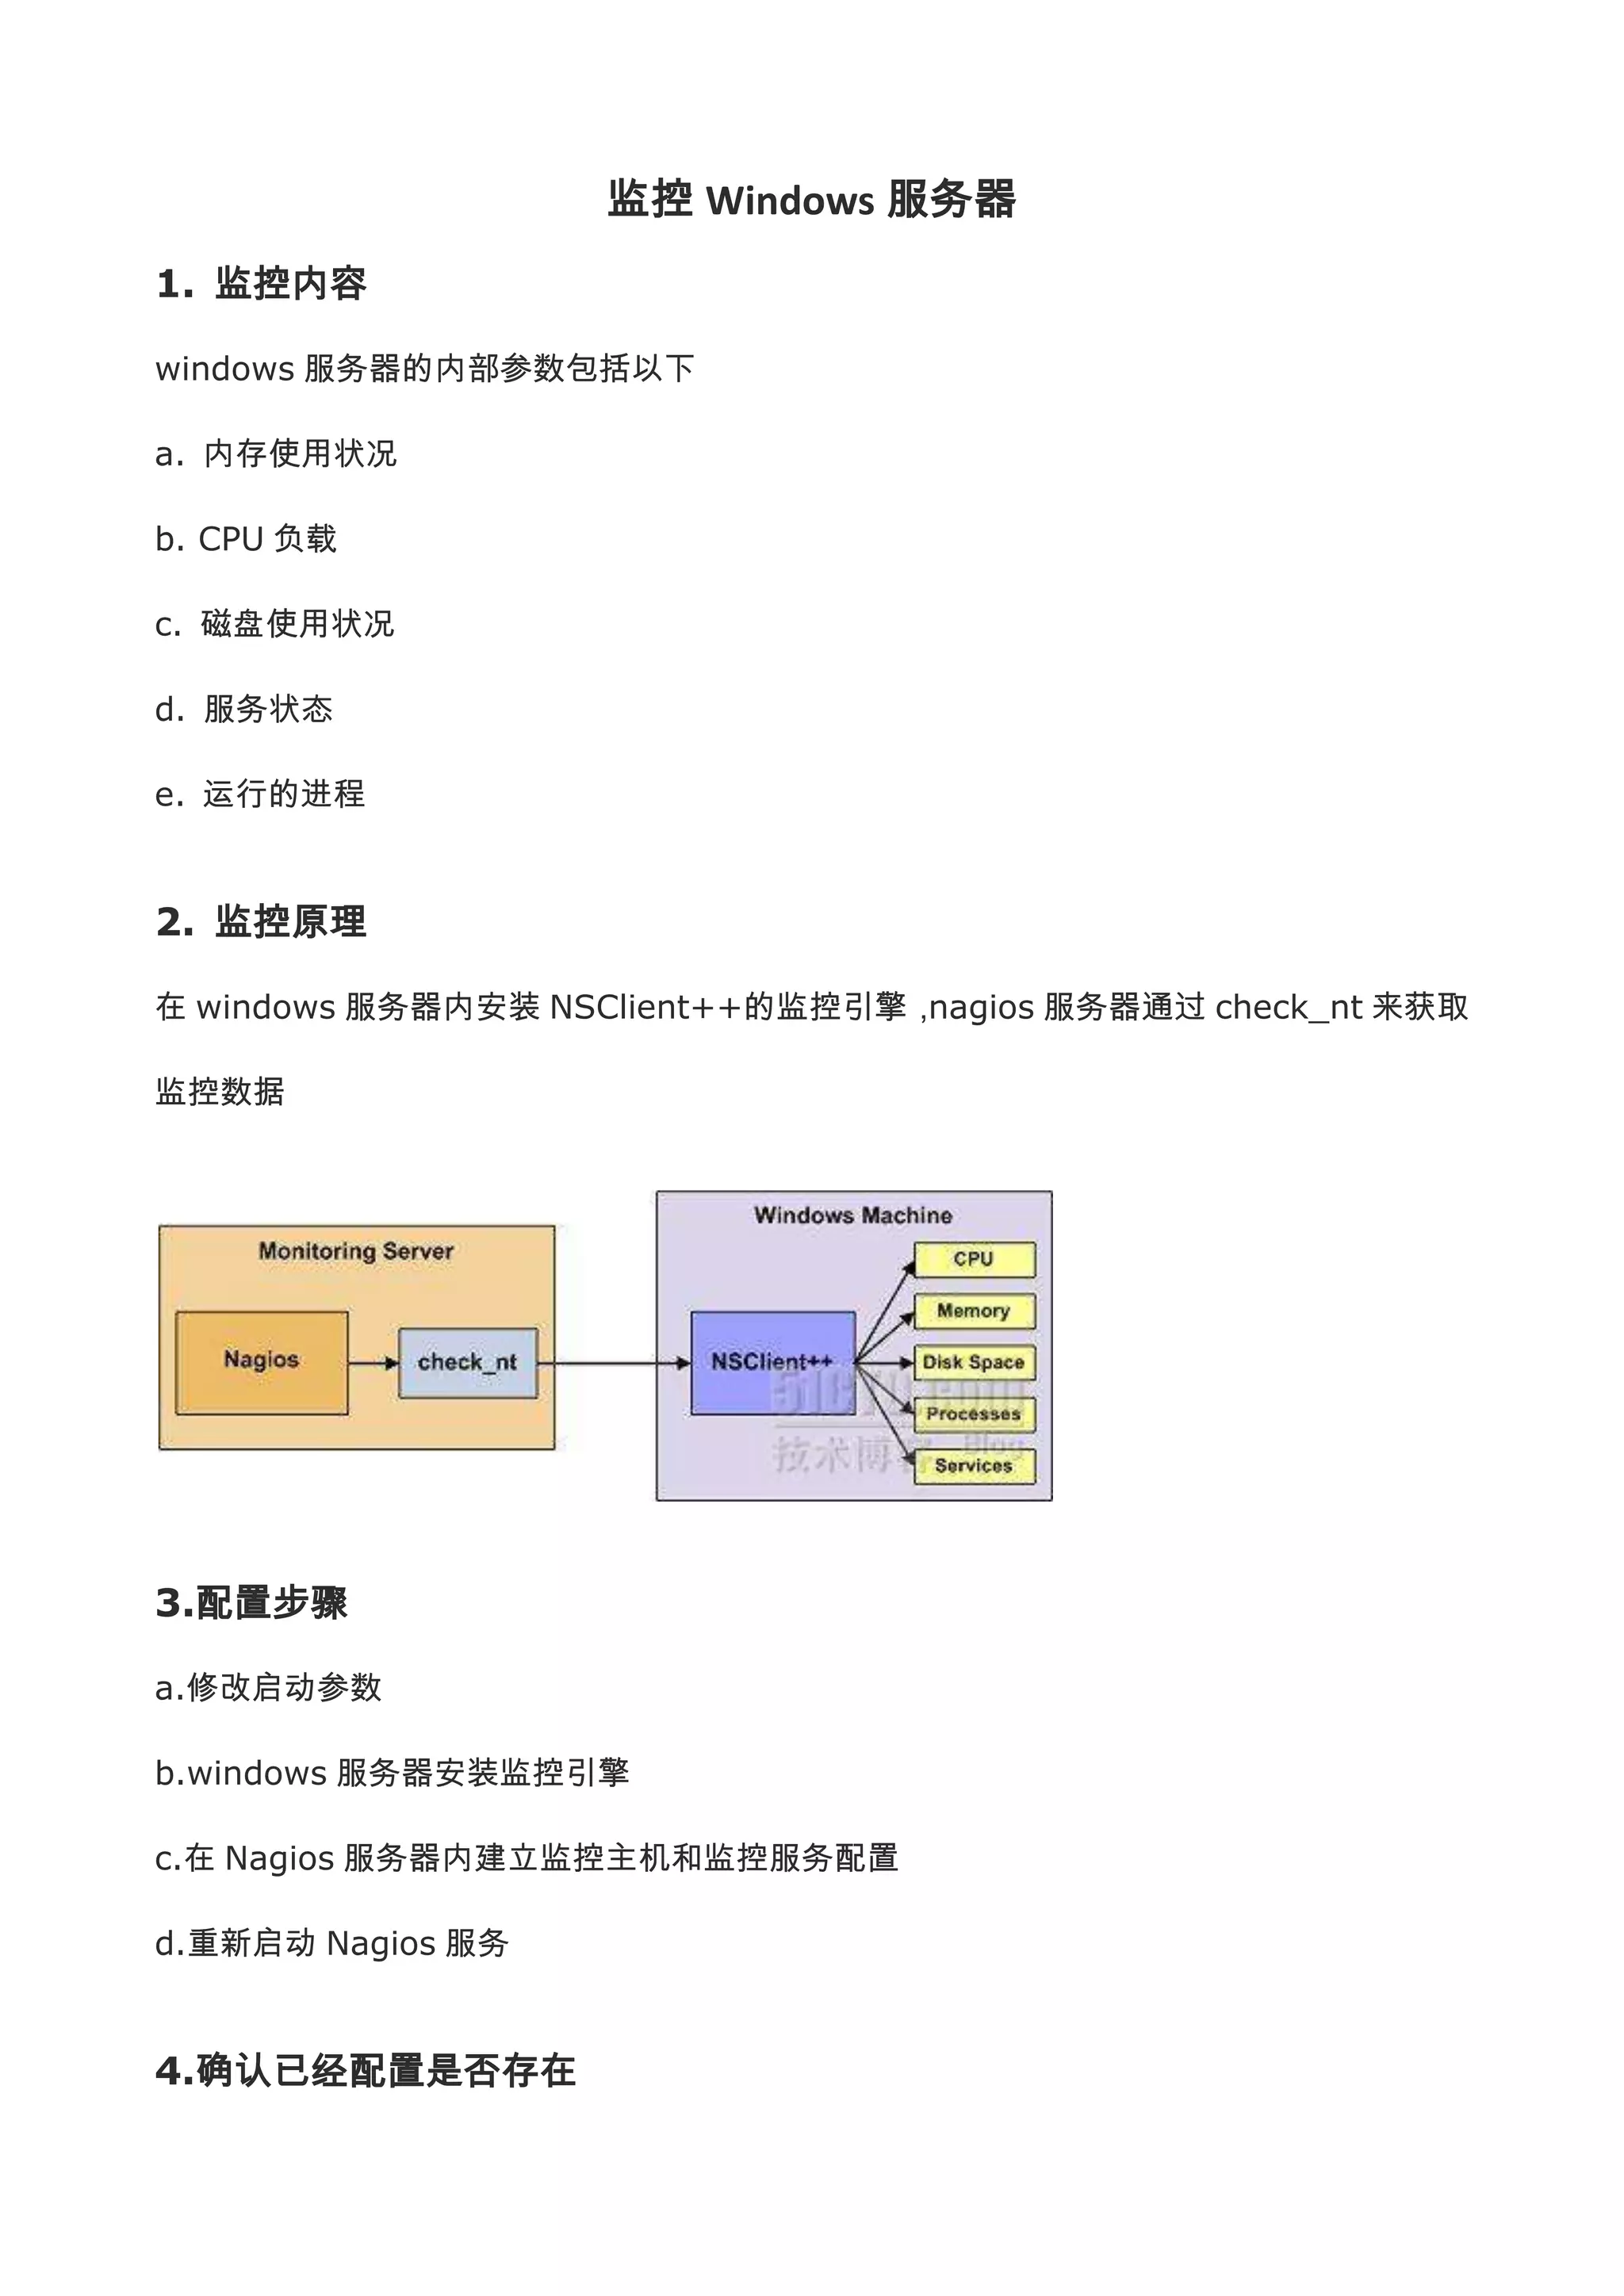
2. 监控原理
在 windows 服务器内安装 NSClient++的监控引擎,nagios 服务器通过 check_nt 来获取
监控数据
3.配置步骤
a.修改启动参数
b.windows 服务器安装监控引擎
c.在 Nagios 服务器内建立监控主机和监控服务配置
d.重新启动 Nagios 服务
4.确认已经配置是否存在
2.
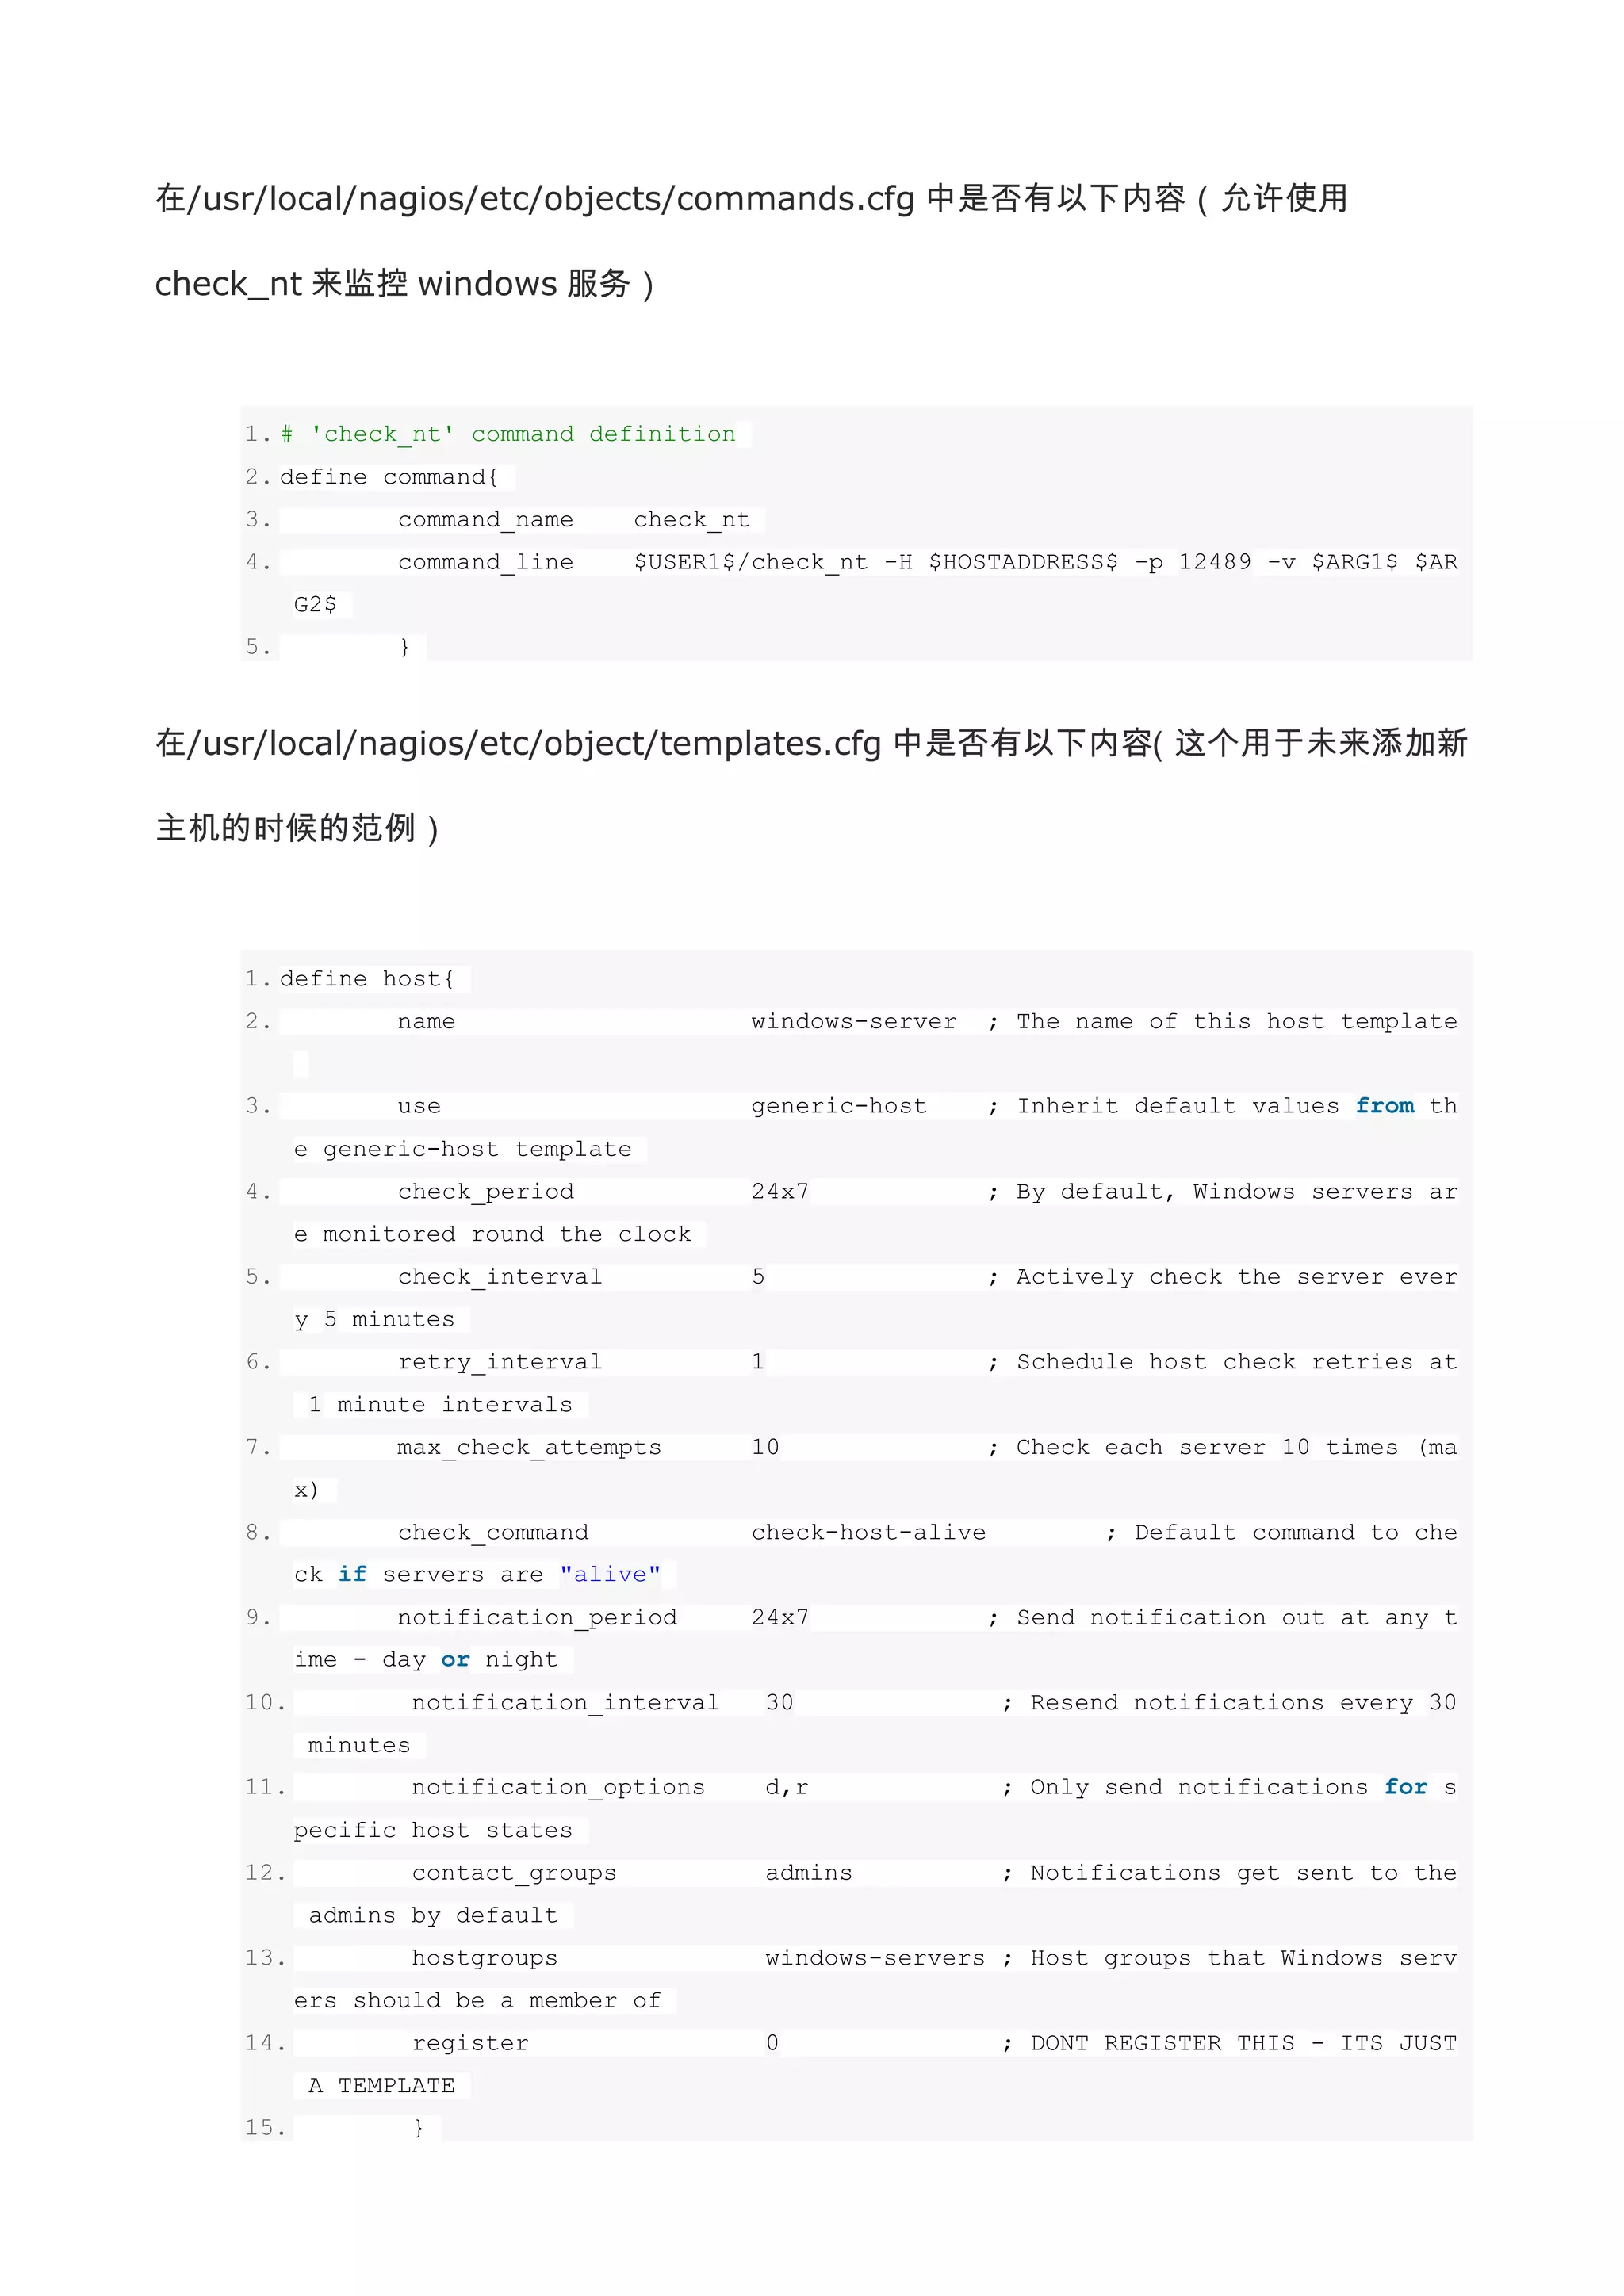
在/usr/local/nagios/etc/objects/commands.cfg 中是否有以下内容(允许使用
check_nt 来监控windows 服务)
1. # 'check_nt' command definition
2. define command{
3. command_name check_nt
4. command_line $USER1$/check_nt -H $HOSTADDRESS$ -p 12489 -v $ARG1$ $AR
G2$
5. }
在/usr/local/nagios/etc/object/templates.cfg 中是否有以下内容(这个用于未来添加新
主机的时候的范例)
1. define host{
2. name windows-server ; The name of this host template
3. use generic-host ; Inherit default values from th
e generic-host template
4. check_period 24x7 ; By default, Windows servers ar
e monitored round the clock
5. check_interval 5 ; Actively check the server ever
y 5 minutes
6. retry_interval 1 ; Schedule host check retries at
1 minute intervals
7. max_check_attempts 10 ; Check each server 10 times (ma
x)
8. check_command check-host-alive ; Default command to che
ck if servers are "alive"
9. notification_period 24x7 ; Send notification out at any t
ime - day or night
10. notification_interval 30 ; Resend notifications every 30
minutes
11. notification_options d,r ; Only send notifications for s
pecific host states
12. contact_groups admins ; Notifications get sent to the
admins by default
13. hostgroups windows-servers ; Host groups that Windows serv
ers should be a member of
14. register 0 ; DONT REGISTER THIS - ITS JUST
A TEMPLATE
15. }
![5.nagios 在第一次监控 windows 所必须修改的内容
修改/usr/local/nagios/etc/nagios.cfg
查找
#cfg_file=/usr/local/nagios/etc/objects/windows.cfg
改为
cfg_file=/usr/local/nagios/etc/objects/windows.cfg
保存文件。
/usr/local/nagios/etc/objects/windows.cfg 内包含了一些样例的主机、主机群和服务的
定义模式。可以通过修改这些案例来测试监控对象。
6.安装 windows 监控引擎
下载 NSClient++的安装包,注意根据实际的 32/64CPU 来下载
下载地址 http://sourceforge.net/projects/nscplus
安装方式,解压缩到 C:NSClient++
在指令模式下,在该目录下面运行以下命令,注册 NSCient++的服务
nsclient++ /install
将 NSCient++作为启动进程
nsclient++ SysTray
在服务列表中找到 NSClientpp 的服务。双击打开该服务的配置窗口则在登录分页中将“允许
服务与桌面交互”勾选上。
编辑 NSC.INI,做以下更改
在[Module]部分,除了 CheckWMI.dll 和 RemoteConfiguration.dll 这两行的注释不要去掉,
其他 DLL 的注释都去掉。
在[Setting]部分的 password 设定一个密码,并把前面的注释去掉。
password=secret-password 改为 password=123456](https://image.slidesharecdn.com/nagioswindow-120618010335-phpapp01/75/Nagios-window-3-2048.jpg)
![在[Setting]部分的 allowed_hosts 部分设定 Nagios 的服务器 IP 或者设定一个 IP 段,并把
前面的注释去掉。
allowed_hosts=192.168.1.205/32
在[NSClient]部分将 port 前的注释去掉,确认 port 的端口号是 12489
启动 nsclient++服务
在电脑属性——>管理——>服务——>NSClientpp 的服务中点击启动即可启动
nsclient++服务
当右下角出现了一个蓝色十字的 ICON 这表示
7.配置 Nagios
建立需要监控的 windows 主机和服务对象
编辑文件 windows.cfg
/usr/local/nagios/etc/objects/windows.cfg
在 host 的定义部分,可以修改实例中的 host_name,alias,address 三个部分来的参数。第
一个参数 use 则是继承了 template.cfg 中对 Windows 的监控参数
1. # 'check_nt' command definition
2. define command{
3. command_name check_nt
4. command_line $USER1$/check_nt -H $HOSTADDRESS$ -p 12489 -v $ARG1$ $AR
G2$
5. }
在 Service 定义部分
首先需要设定以下内容,用于确认监控对象的 NSClient++的版本是否正确
1. define service{
2. use generic-service
3. host_name winserver
4. service_description NSClient++ Version](https://image.slidesharecdn.com/nagioswindow-120618010335-phpapp01/75/Nagios-window-4-2048.jpg)