TASK 2 : MY HOMETOWN SUSTAINABILITY
GOMBAK

KKKH4284 : SUSTAINABLE URBAN PLANNING

BY: WAN TALHAH BIN WAN IBADULLAH
(A133106)
HISTORY


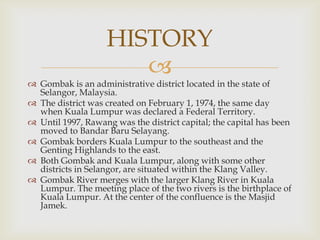
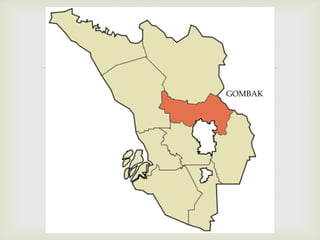
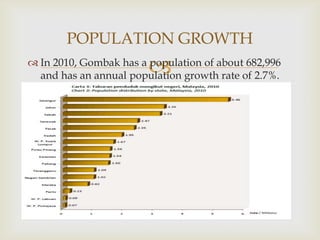
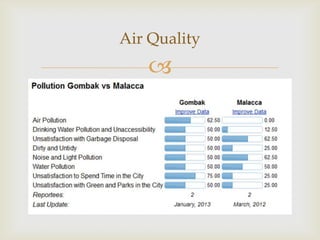
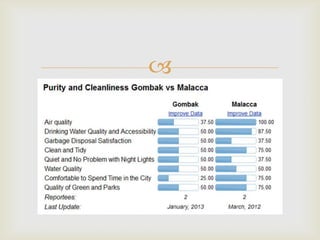
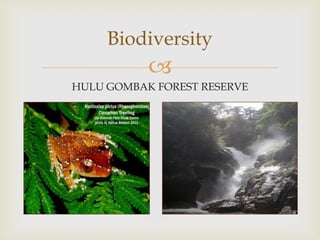
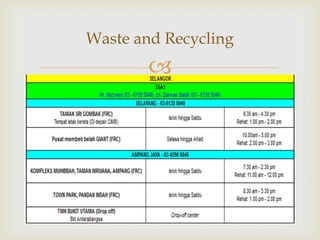
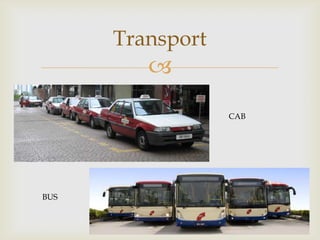
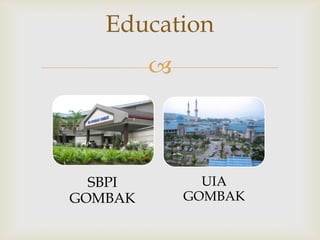
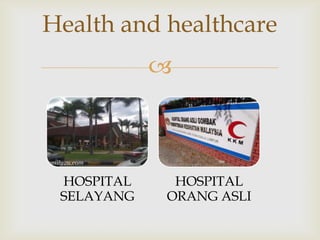
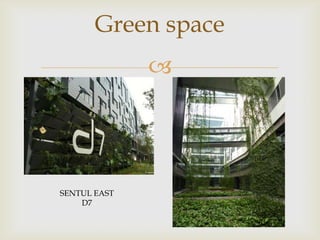
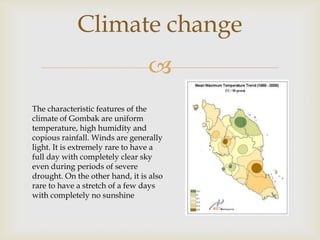
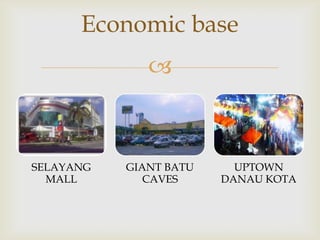
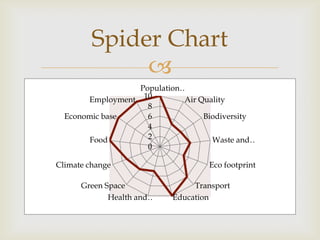
 Gombak is an administrative district located in the state of
Selangor, Malaysia.
 The district was created on February 1, 1974, the same day
when Kuala Lumpur was declared a Federal Territory.
 Until 1997, Rawang was the district capital; the capital has been
moved to Bandar Baru Selayang.
 Gombak borders Kuala Lumpur to the southeast and the
Genting Highlands to the east.
 Both Gombak and Kuala Lumpur, along with some other
districts in Selangor, are situated within the Klang Valley.
 Gombak River merges with the larger Klang River in Kuala
Lumpur. The meeting place of the two rivers is the birthplace of
Kuala Lumpur. At the center of the confluence is the Masjid
Jamek.

GOMBAK
POPULATION GROWTH



 In 2010, Gombak has a population of about 682,996
and has an annual population growth rate of 2.7%.
Air Quality



Biodiversity


HULU GOMBAK FOREST RESERVE

Waste and Recycling


Eco Footprint


 From my opinion, Gombak would have high eco
footprint due to the lifestyle of its population and
high industrial activity
 A measure of human demand on the Earth’s
ecosystem.
Transport


CAB

BUS


PUTRA LRT

STAR LRT

KTM
Education


SBPI
GOMBAK

UIA
GOMBAK
Health and healthcare


HOSPITAL
SELAYANG

HOSPITAL
ORANG ASLI


HOSPITAL
SUNGAI BULOH

HOSPITAL
AMPANG PUTERI
Green space


SENTUL EAST
D7
Climate change

The characteristic features of the
climate of Gombak are uniform
temperature, high humidity and
copious rainfall. Winds are generally
light. It is extremely rare to have a
full day with completely clear sky
even during periods of severe
drought. On the other hand, it is also
rare to have a stretch of a few days
with completely no sunshine
Food

PASAR BESAR GOMBAK

PASAR SELAYANG

PASAR SENTUL
Economic base


SELAYANG
MALL

GIANT BATU
CAVES

UPTOWN
DANAU KOTA
Employment

Employment

2010

2011

2012

2,594.4

2,704.0

2,828.7

2,511.9

2,638.5

2,762.4

Unemployed
('000)

82.5

65.5

66.3

Labour Force
Participation
Rates, LFPR (%)

65.9

67.7

69.9

Unemployment
Rate (%)

3.2

2.4

2.3

Labour Force
('000)
Employed ('000)
Spider Chart

Population…
Employment 10
Air Quality
8
Economic base
Biodiversity
6
4
2
Food
Waste and…
0
Climate change
Green Space
Health and…

Eco footprint
Transport
Education

My hometown