1. KESTREL CAPITAL
Member of the Nairobi Stock Exchange
December 2010
MUMIAS SUGAR COMPANY LTD
Move Ye Coast and Diversify
We recommend an ACCUMULATE on Mumias Sugar Company (‘Mumias’) based on the
expected future potential upside from the diversification initiatives which include the Tana
& Athi River Development Authority (‘Tarda’) integrated Greenfield project at the coast,
diversification into power co-generation, ethanol production and impending sector reforms.
The miller, and the sector in general, are facing a challenging operating environment ahead
of the expiry of the Common Market for East and Southern Africa (‘Comesa’) safeguard
window in 2012. Under Comesa rules, this period cannot be extended further.
• Mumias is the leading sugar producer in the country with a 45.2% market share (and
plans to increase via acquisition) as at end of 2009 and has a countrywide distribution
network. Brand equity has adequately been exploited as reflected in the premium pric-
ing of its pre-packaged and branded sugar which accounts for 40% of production.
• The sector is faced with serious challenges including over dependence on rain-fed cane,
small and fragmented farm holdings which account for about 94% of area under cane,
declining cane yields (at 6.7 ton per hectare, T/Ha, against the recommended 10.0T/Ha),
higher input and production costs (estimated at USD 500 per ton) which are almost dou-
ble those from other producers in the Comesa region, cane poaching, poor road infra-
structure in some areas and ageing plant machinery. In FY09 operating margins de-
clined by 470bps to 9.2% as a result of a 750bps increase in cost per ton to 36.5%, the
highest in the past 8 years.
• In our view, the Comesa expiry period may not pose a serious threat to Mumias in the
medium term. This is because the Comesa region with 23 countries is in itself as deficit
region as most countries are net importers of sugar from non-Comesa countries. For
Kenya, despite the duty free quota having been set to increase by 40,000 tons annually
from 2008, only 184,531 tons (out of the required quota of 220,000 tons) were imported
in 2009. Most of the imported sugar came from non-Comesa countries like South Af-
rica, Thailand and Saudi Arabia. Also, most of the producers in the Comesa region opt
to export to the more lucrative European markets where they are able to fetch higher
prices. The situation is exacerbated by recent low production amongst world’s top pro-
ducers like India due to drought and Brazil’s export bottlenecks together with the coun-
try’s policy of balancing of ethanol and sugar.
Key Statistics FY2007 FY2008 FY2009 FY2010A FY2011F FY2012F
EPS (KES) 2.73 0.79 1.05 1.03 1.22 1.51
% ch -8.7 -71.0 32.6 -2.3 18.8 23.3
DPS (KES) 1.50 0.40 0.40 0.40 0.40 0.40
% ch -14.3 -73.3 0.0 0.0 0.0 0.0
P/E x 5.4 8.5 6.5 9.3 7.8 6.3
P/B x 0.9 1.1 1.0 1.3 1.1 1.0
Div yield % 10.1 5.9 5.8 4.2 4.2 4.2
Source: Company, Kestrel estimates
Bloomberg Ticker : MSUG KN
Reuters Ticker: MSCL NR
Share Statistics
Price (KES) 9.55
Issued shares (m) 1,530
Market cap (KES bn) 14.6
Market cap (USD m) 181.8
Year end 30 June
Free Float % 80
Av daily trading vol (USD) 222,351
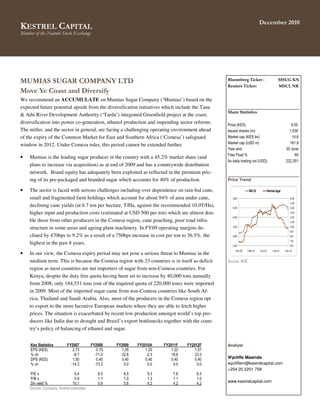
Price Trend
Source: NSE
Analyst
Wycliffe Masinde
wycliffem@kestrelcapital.com
+254 20 2251 758
www.kestrelcapital.com
6.00
7.00
8.00
9.00
10.00
11.00
12.00
13.00
14.00
15.00
16.00
2,500
3,000
3,500
4,000
4,500
5,000
2-Dec-09 3-Mar-10 2-Jun-10 1-Sep-10 1-Dec-10
NSE20 MumiasSugar
2. Mumias Sugar Research Update KESTREL CAPITAL
FY10 Results summary
Mumias Sugar Company Ltd.
Income Statement FY09 FY10 % ch
Gross sales 14,197 18,798 32.4
VAT (1,932) (2,575) 33.2
Sugar Development Levy (462) (605) 31.1
Net sales 11,803 15,618 32.3
Operating profit 1,084 2,145 97.8
Net finance cost 109 35 -67.5
Profit before tax 1,193 2,180 82.7
Taxation (charge)/credit 417 (607) -
Profit after tax 1,610 1,572 -2.3
EPS (KES) 1.05 1.03 -1.9
DPS (KES) 0.40 0.40 -
Source: Company
Mumias released FY10 results showing a 2.3% y-o-y reduction in profit after tax to KES 1.6bn.
The dip in earnings was attributed to a KES 607m taxation charge in FY10. In FY09, the com-
pany benefited from a 150% tax remission on its 38MW cogeneration plant. The plant, commis-
sioned in May 2009 and which commenced full operations in January 2010, contributed KES
359m to gross revenues though it hasn’t started operating at full capacity due to less fuel from
the raw material, bagasse, and reduced uptake by their main customer, Kenya Power.
• Gross sales went up 32.4% y-o-y to KES 18.8bn and net revenue was up 32.3% y-o-y to
KES 15.6bn as a result of an increase in sugar prices and a 2.0% increase in sugar produced
to 235,792 tons. Sugar cane processed went up 7.3% to 2,318,080 tones due to higher fac-
tory availability and efficiency as a result of major repairs and maintenance at the beginning
of FY10 (July 2009). Mumias’ Factory Time Efficiency (FTE) was the highest in the sector
at 90.7% (though still lower than a target FTE of 92%).
• Sugar prices in the Comesa region have been going up occasioned by the deficit in the
world market making it attractive for most countries with surplus in the region (Comesa) to
export their sugar to the European market where they are able to fetch higher prices.
• Plans by the miller to enter into a Greenfield operation at the coast of Kenya at a cost of
KES 32bn are still on course. The main advantage for this project will be the fast maturity of
cane (about 14 months as compared to 20 months in the western region) and economies of
scale that will come with large nucleus farms as opposed to the current small holdings. In a
bid to increase its competitiveness ahead of the expiry of the Comesa safeguard period by
March 2012, Mumias sugar plans to invest in an ethanol plant at its current site capable of
producing up to 24ml of ethanol. The government has already gazetted laws requiring all
petroleum companies in the western region to start blending their petrol with industrial etha-
nol.
3. Mumias Sugar Research Update KESTREL CAPITAL
Industry Overview
Tough Operating Environment
There are currently 9 licensed sugar millers in the country. These include Mumias Sugar, Mi-
wani, Nzoia Sugar, Muhoroni, West Kenya Sugar, Kibos, Soin, South Nyanza (Sony) and Che-
melil. The government owns a 20% stake in Mumias and fully owns another 5 millers (two of
which are under receivership). Mumias Sugar is the leading sugar producer in the country with a
45.2% market share as shown in the chart below.
Source: Kenya Sugar Board
The government plans to privatize the 5 state-owned sugar millers before March 2012 when the
Comesa safeguard period ends. It is estimated that the 5 sugar factories to be privatized have
accumulated debts estimated at KES 42bn owed to the government and out-grower farmers
which have to be cleared from the balance sheet before they are sold off. According to prelimi-
nary plans by the government, some of the debts might be written off and the rest paid off by the
strategic investor. The cabinet has already approved a draft plan by the Privatization Commission
for sale of a 51% stake to a strategic investor who will help turn around the factories into profit-
ability including replacement of the old plant equipments. Another 30% stake will be set aside
for farmers through out-grower companies and the rest (19%) to be sold to the public through
IPOs at a later time when the factories are operating profitably. This proposal is however await-
ing parliamentary approval. Mumias sugar has indicated its willingness to bid for one of the 5
sugar factories as a strategic investor, possibly Nzoia sugar which has a 13% market and is capa-
ble of increasing Mumias’ market share to 58%.
The expiry of the safety window will usher in duty free quota sugar imports into the country
without paying duty. This is expected to offer competition to local millers as some of the Comesa
countries like Zambia, Sudan, Egypt and Swaziland produce their sugar at almost half the cost of
our local millers. As at end of 2009, the cost of locally produced sugar was USD 500 per ton as
compared to Comesa countries at USD 230-300 per ton making imported sugar cheaper than the
one produced locally.
Chemelil
5%
Muhoroni
5%
Mumias
45%Nzoia
13%
South Nyanza
12%
West Kenya
13%
Soin
0%
Kibos
7%
Market Shares for Sugar Production by Factory
2009
4. Mumias Sugar Research Update KESTREL CAPITAL
Constraints facing the sugar sector in Kenya
The sugar sector in the country is faced with several challenges that need to be addressed before
local millers can compete favorably with their peers from Comesa region. These challenges can
be grouped into two main categories; at farm level and factory level. According to a survey done
by Kenya Sugar Research Foundation (‘KESREF’), the main constraints can be summarized as:
• High input and production costs. Kenya has the highest sugar production cost in the Co-
mesa region. It is estimated that it costs USD 500 to produce a ton of Kenyan sugar, while a
ton of sugar from Comesa countries like Zambia, Malawi, Swaziland/Egypt and South Af-
rica (non-Comesa) costs USD 260, USD 230, USD 300, and USD 270, respectively. Inputs
costs for fertilizers and transportation are equally too high. It is estimated that transportation
alone takes about 30%- 40% of the cane price, while production costs like land preparation,
purchase of seed cane and fertilizers plus harvesting costs combine to eat into farmers’ as
well as millers’ margins.
• Small farm holdings: The average land size for cane production has been declining in the
inverse proportion to population growth. Most farmers own land measuring less than an hec-
tare making it un-economical for cane production. On average, the millers’ nucleus estates
account for about 6% of the total area under cane with the bulk of it, 94%, being small farm
holdings controlled by individual farmers. This is the biggest setback to attaining a competi-
tive edge since the companies are unable to exercise proper farming methods on individual
farms due to lack of economies of scale and the difficulty of enforcing proper farming meth-
ods in farms they don't own. In comparison, countries like Zambia, Swaziland and Malawi
are able to use mechanized farming, irrigation and controlled farming because of the large
nucleus estates they own.
Source: Kenya Sugar Board
3,200
3,400
3,600
3,800
4,000
4,200
4,400
40,000
45,000
50,000
55,000
60,000
65,000
2002 2003 2004 2005 2006 2007 2008 2009
Outgrowers Nucleus Estate
5. Mumias Sugar Research Update KESTREL CAPITAL
• Low cane yield, calculated as the total sugar produced per hectare. The sector average cane
yield currently stands at 6.43 T/Ha, which is far below the potential yield of 10.00 T/Ha un-
der rain fed conditions. Mumias’ yield in 2009 was 6.73T/Ha, slightly above the sector aver-
age.
Source: Kenya Sugar
• Over–dependence on rain-fed cane. Over 90% of sugar produced in Kenya is milled in the
western region sugar belt which is a high altitude area and mostly depends on rain-fed cane.
Maturity of such cane is delayed to 18-24 months due to low temperatures and drought. On
its part, Mumias has received all the necessary approvals to set up a Greenfield project at the
coast which is a low altitude area. The company has identified 16,000 ha of land for its nu-
cleus estate (the current nucleus estate in the western region is 3,524 ha).
• Poaching. Most sugar millers have cited poaching as big risk to their businesses. This is
done either by competitors or several sugar jaggeries located in the sugar belts but have no
contracted farmers and neither own nucleus estates.
• Poor planning and coordination of activities by outgrower and sugar companies has led to
poorly timed land preparation and planting, delayed supply of inputs especially fertilizer and
seed cane as well as delayed harvesting for most state owned millers save for Mumias.
• Delayed payment for delivered cane is a big disincentive to farmers who opt to uproot cane
in favor of other more viable crops. Mumias’ farmers are paid within 30 days for cane sup-
plied but some factories can take months.
• Lack of supervision and extension services by agriculture officers and sugar companies
leads to low standards of land preparation, weeding and harvesting.
• Poor road and telecommunication infrastructure serve to exacerbate the problem of cane
spillage and delayed transportation of cut cane to the factory.
• Low crushing capacity and inefficiency: This is occasioned largely by poor maintenance
of the factories and recurrent breakdowns. This in turn has reduced the crushing capacity of
some factories to as low as 50% of their installed capacities and recoveries to below 85%.
5.0
6.0
7.0
8.0
9.0
190,000
200,000
210,000
220,000
230,000
240,000
250,000
2005 2006 2007 2008 2009
Sugar Produced - Mumias (tons)
Area Harvested (ha)
Mumias Yield
Sector Yield
6. Mumias Sugar Research Update KESTREL CAPITAL
Expiry of Comesa Safeguards
In 2007, the government lobbied Comesa to extend the protectionist measure period by a further
4 years. This was based on grounds that the local sugar industry was not competitive enough to
allow duty-free sugar imports from Comesa, according to a study carried out. The Comesa exten-
sion safeguard measures came with the following conditions:
• Government to speed up privatization of all state controlled millers within two years.
• Government to effect a steady rise in sugar import quota in tandem with a graduated fall in
the duty charged with full liberalization by 2012 as shown in the table below.
Source: Comesa
• The pricing formula to be changed from the one based on cane weight to sucrose content
• Government to adopt an energy policy aimed at promoting co-generation and other forms of
bio-energy production to make the sugar industry more competitive
Most of the conditions outlined above have fallen behind schedule despite the remaining period
being less than 15 months. The four year period is the last that Kenya is allowed to have in the
governing rules of the Comesa treaty
Year
Duty Free quota
(Tons) Tariff quota (%)
2008/09 220,000 100
2009/10 260,000 70
2010/11 300,000 40
2011/12 340,000 10
1-Mar-12 Nil 0
7. Mumias Sugar Research Update KESTREL CAPITAL
Increasing annual consumption fuelling deficit
Below is a summary of sugar statistics in Kenya:
Source: Kenya Sugar Board
From the table, it is noteworthy that since the Comesa conditions kicked in from 2008, imports
have been declining which has in turn resulted into a deficit. This has been caused partly because
of the government’s suspension of import licenses in 2008 for some traders (leading to litigation
in court) and competitive prices in European markets for Comesa sugar producing countries.
There is also the effect of deficit in global supply of sugar due to drought in India and Brazil’s
policy governing the balancing of ethanol and sugar.
In the past 5 years, Kenya’s consumption has been growing at an average rate of 2.6% to peak at
762,027 tons in 2009 against a 5 year average production growth rate of 1.3% to 548,207 tons in
2009. This means there is still a lot of headroom for local millers if they are able to increase
their efficiency in sugar production to compete favorably. Some of the factories including
Mumias Sugar and Chemelil have started addressing the major factor that increases cost of pro-
duction; power. Mumias currently produces 38MW of power out of which 12MW is for internal
consumption and the rest, 26MW is sold to the national grid. Chemelil is partnering with Ken-
Gen, a power generation company, to produce 25MW of power.
Mrasurement (Tons) 2005 2006 2007 2008 2009
Production 488,997 475,670 520,404 517,667 548,207
Consumption 695,622 718,396 741,190 751,523 762,027
Imports 167,235 166,280 230,011 218,607 184,531
Exports 21,760 13,533 20,842 44,332 1,952
Defict 61,150 89,979 11,617 59,581 31,241
8. Mumias Sugar Research Update KESTREL CAPITAL
FY11 Forecast
We expect sugar production for Mumias to increase 11.0% to 261,729 tons in 2011 and 11.4%
increase in revenue to KES 17.3bn in 2012 buoyed by:
• Increased amount of rainfall in the sugar growing areas in western sugar belt that started in
4Q09 and has continued to date. In FY10 that ended 30 June 2010, the total rainfall recorded
in this region stood at 2,798mm, a 40% increase against a long term mean of 2,003mm. This
has the effect of improving cane yield and reducing maturity period from the normal 18-24
months to less. Excessive wet conditions may however result in damage to the road network
thereby increasing transportation costs and insufficient feedstock for milling.
• The company plans to increase area under cane by 10.5% from the current 57,393 ha to
63,393 ha over the next two years in the neighboring Busia Sugar zone. This is expected to
boost cane production by about 3% during the two years. Mumias has indicated that they
might bid for a stake in one of the government owned sugar companies when they are avail-
able for sale. This might significantly increase area under cane and boost its sugar produc-
tion. There has been suggestions that the neighboring Nzoia sugar which is less than 50km
from Mumias would be the more viable choice. If this happens, it has the potential of in-
creasing Mumias' area under cane by 28.8% to 80,650 ha.
• Increased efficiency. In 2009 Mumias recorded the highest Factory Time Efficiency (‘FTE’)
of 90.7%. Though this was below the recommended standard FTE of 92%, the factory is
addressing factors that result into low FTE. These include industrial action by workers over
pay, lack of cane due to strikes, bad roads, low feedstock and breakdown of equipment due
to ageing plant machinery. At the beginning of 1H10, the company carried out major repairs
and maintenance at a cost of KES 3bn which is expected to lead to increased availability of
the plant for longer grinding hours and increased efficiency. Also, improved sugar prices
which have been going up in tandem with a surge in global sugar prices will offer an upside.
Improved industry relations between the factory and workers, an increase in sugar prices
paid to farmers (19% increase to KES 2,768) is an incentive to farmers. Below is the trend in
for world sugar prices versus local prices in 2009.
Kenya Sugar Board , Bloomberg
9. Mumias Sugar Research Update KESTREL CAPITAL
Declining Profitability Margins
The high input costs are attributed to rising fuel prices, transport and fertilizer costs as well as an
increase in price of cane per ton paid to farmers have resulted in declining margins since 2005. Y
-o-y, operating margins declined 470bps to 9.2% Mumias paid an average of KES 2,768 per ton
to farmers in 2009 an increase of 19% as compared to 2009. It is estimated that transportation
alone takes about 30%- 40% of the cane price. The miller however cut back on cost of distribu-
tion by 3% to KES 2,788 per ton in FY10, compared to the previous year’s figure of KES 2,872
per metric ton as a result of direct sales deliveries to the customers.
Source: Company, Kestrel Capital Estimates
Sugar
Mumias plans to increase its production of its pre-packaged sugar to 40% of sugar produced after
commissioning of a new packaging plant in September 2009 and fortification of some of its
sugar with nutrients to make it attractive to consumers. Sugar is still the biggest contributor to
revenues for Mumias. In FY10, Sugar sales accounted for 97% of net revenues as compared to
electricity with 2% and molasses (to be used for ethanol production) 1%. Mumias’ plans to di-
versify into the smaller two revenue streams is informed by the above concentration risk in sugar
products. The target is to have the other two categories of power and ethanol contributing 10%
each so that sugar sales proportion can come down to 80%.
Power Generation
The KES 4.2 billion power plant, commissioned in May 2009 and which commenced full opera-
tions in January 2010, generates 38MW of power The company sells 26 MW of power at a price
of US cents 6/KWh to Kenya Power. In FY10, power sales contributed 2.3% to net revenues
(KES 359m). The low sales were attributed to low cane supply (hence less bagasse) and a low
uptake by Kenya Power. We project power to contribute at least KES 700m (approximately 4.5%
of net revenues) to revenues if the plant is operating at full capacity.
-5%
0%
5%
10%
15%
20%
0%
5%
10%
15%
20%
25%
30%
35%
40%
2002 2003 2004 2005 2006 2007 2008 2009
Gross margin (%) - RHS Operating margin - LHS
10. Mumias Sugar Research Update KESTREL CAPITAL
Ethanol Production
Mumias plans to start large scale industrial production of ethanol in a project to be financed
through debt and equity. The miller has signed a KES 1.6bn loan agreement with a consortium of
three banks; Ecobank, Nedbank and Commercial Bank of Africa for construction of an ethanol
plant that is estimated to cost KES 4bn. Some of the cash might be raised from the company’s
reserves (in FY09/10, Mumias Sugar reported KES 6.4bn in retained earnings). The company’s
80,000Mt of molasses is able to produce 24m hectolitres annually of Anhydrous Alcohol (AA)
for blending with petrol once complete from end of next year. The government has already put a
policy framework in place requiring all oil companies operating in western major towns of El-
doret, Kisumu and Nakuru to blend gasoline with 10% ethanol to produce ethanol. The imple-
mentation of this directive is however behind schedule due to capacity constraints.
Bottled Water
Mumias will start bottling water from its excess water from the co-generation treatment plant
with a capacity to produce 16m litres per year. This is expected to be completed by mid next
year.
Tarda Project
Mumias signed a deal with the Tana and Athi Rivers Development Authority (‘Tarda’) to set up
a sugar factory project in the Tana region. This project is expected to boost sugar production by
220,000 metric tons annually on completion. The project, expected to cost KES 32 billion, was
supported by an Environmental Impact Assessment (EIA) study report prepared by M.A. Con-
sulting Group (Kenyan) and HVA International (Danish). The project has already received ap-
proval from the National Environmental Authority (‘Nema’).
Results from the study indicate that cane from the delta region matures faster at 14 months as a
result of the low altitude, high temperatures and irrigation. This will be a sharp contrast to the
current 18-24 months in the western region which are 100% rain-fed and are grown in the high
altitude and low temperatures.
The company will be able to bring down the cost of production in this region by almost 40%
from the current USD 500 per ton to about USD 300 per ton. Also, the sucrose content will be
higher, making it comparable to more efficient sugar producers in the region such as Swaziland,
Malawi, Sudan and Zambia. If successful, the project’s capacity is estimated at 6,000 tons per
day will include power co-generation of 45 MW and ethanol production of up to 24 million li-
ters. The project will be supported by a nucleus estate of about 16,000 ha with the remaining
4,000 ha being used for development of other cane varieties or held by out-grower farmers.
The structure of the project will be such that Mumias will hold a 51% stake, Tarda 29%, the
local community 10% and a strategic investor 10%.The company is still in the process of sourc-
ing for funds and a strategic investor to finance this project; expected to be a mix of debt and
equity.
11. Mumias Sugar Research Update KESTREL CAPITAL
Income statement year to June FY2007 FY2008 FY2009 FY2010 FY2011 FY2012
Sales 10,318 11,954 11,738 15,568 17,336 19,538
Gross profit 3,588 4,266 3,311 4,885 5,547 6,545
Operating profit 1,880 1,666 1,084 1,965 2,138 2,764
Finance cost/income 29 (77) 109 215 307 307
Profit before tax 1,910 1,589 1,193 2,180 2,445 3,071
Taxation (516) (375) 417 (607) (577) (768)
Profit after tax 1,394 1,214 1,610 1,572 1,867 2,303
Dividends 765 612 612 612 612 612
Retained earnings 629 602 998 960 1,255 1,691
Balance sheet year to June
Fixed assets 8,003 9,280 12,098 11,586 15,886 15,886
Other non-current assets 210 292 265 241 241 241
Current assets 3,704 4,581 5,112 6,507 6,465 7,184
Total Assets 11,917 14,153 17,476 18,334 22,592 23,312
Shareholders equity 8,338 9,041 10,039 11,000 13,459 15,151
Non current liabilities 1,966 1,713 3,676 4,084 3,029 2,802
Current liabilities 1,613 3,398 4,158 3,250 7,790 7,046
Total equity and liabilities 11,917 14,153 17,873 18,334 24,279 24,999
Cash flow statement year to June
Cash generated by operations 2,472 2,258 1,847 2,897 3,295 4,035
Working capital (1,215) (551) 246 (248) (13) (193)
Operating Cash Flow 1,257 1,707 2,093 2,828 3,282 3,841
Net interest received/(paid) 34 (35) 67 181 307 307
Cash taxes (415) (217) (596) (5) (577) (768)
Net cashflow before investing 876 1,455 1,563 3,004 3,012 3,381
Net cash invested (1,343) (1,974) (3,173) (323) (5,458) (1,271)
Free cash flow (468) (519) (1,610) 2,682 (2,446) 2,110
Net financing cash flow (805) 86 1,020 (938) (1,973) (840)
Net cash flow for the year (1,273) (433) (590) 1,743 (4,419) 1,270
Opening cash balance 1,899 626 193 (397) 1,346 (3,072)
Closing cash balance 626 193 (397) 1,346 (3,072) (1,802)
12. Mumias Sugar Research Update KESTREL CAPITAL
Recommendation guide
STRONG BUY: Highly undervalued/ strong fundamentals
BUY: Good value/ strong fundamentals
ACCUMULATE: Buy on price dips
HOLD: Correctly valued with little pricing upside or downside
LIGHTEN: Overvalued by the market/ Reduce exposure/Declining fundamentals/
industry concerns
SELL: Weak fundamentals and challenging operating environment/Highly
overpriced
Disclaimer
Note: Readers should be aware that Kestrel Capital (EA) Ltd does and seeks to do business with companies covered in its research
reports. Consequently, a conflict of interest may arise that could affect the objectivity of this report. This document should only be
considered a single factor used by investors in making their investment decisions. The reader should independently evaluate the
investment risks and is solely responsible for their investment decisions.
The opinions and information portrayed in this report may change without prior notice to investors. This publication may not be distrib-
uted to the public media or quoted or used by the public media without prior and express written consent of Kestrel Capital (EA) Ltd.
Directors, staff of Kestrel Capital (EA) Ltd and their family members, may from time to time hold shares in the company it recommends
to either buy or sell and as such the investor should determine for themselves the applicability of this recommendation.
This document does not constitute an offer, or the solicitation of an offer, for the sale or purchase of any security. Whilst every care
has been taken in preparing this document, no representation, warranty or undertaking (express or implied) is given and no responsi-
bility or liability is accepted by Kestrel Capital or any employee of Kestrel Capital as to the accuracy of the information contained and
opinions expressed herein.