Download to read offline

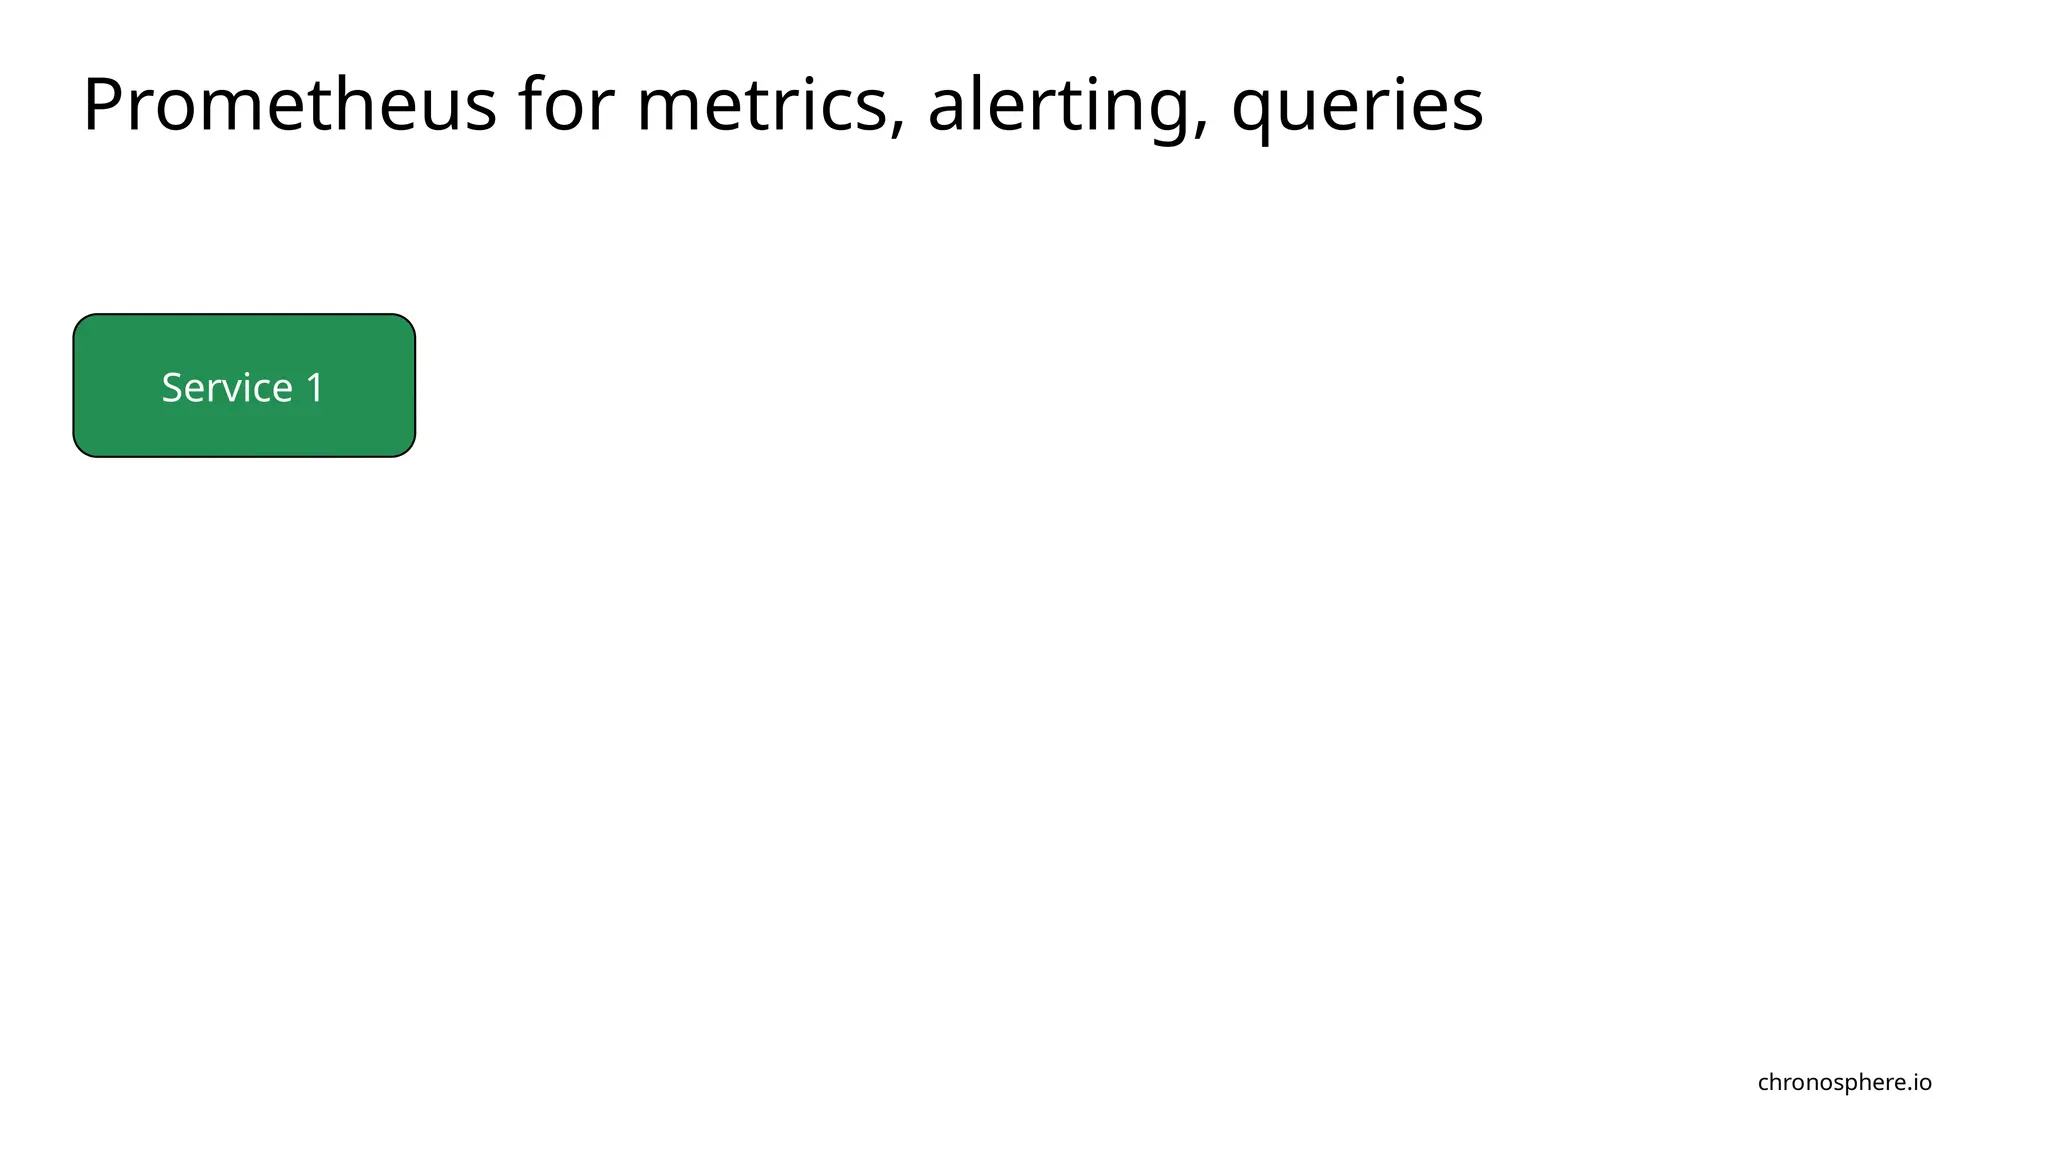
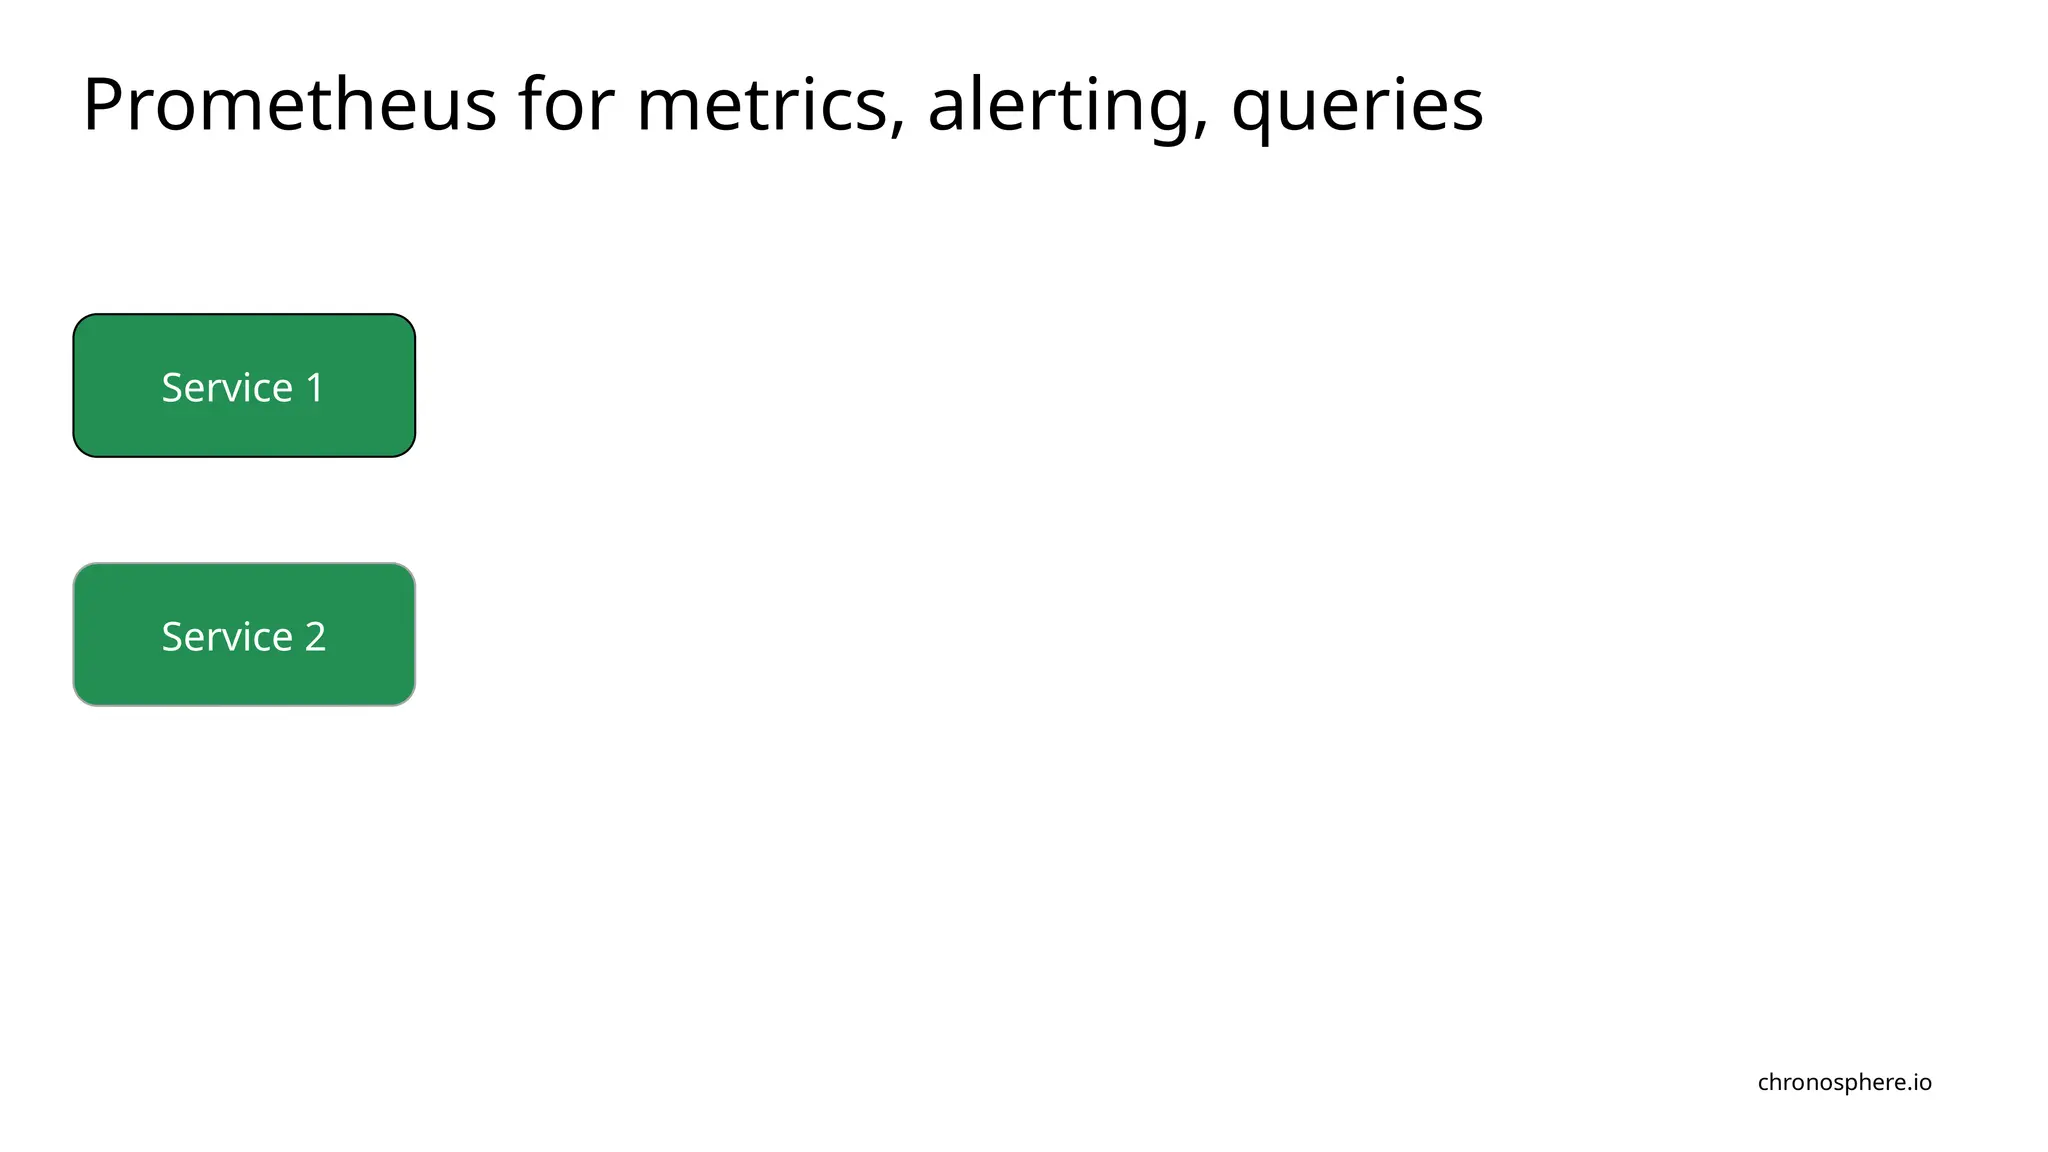
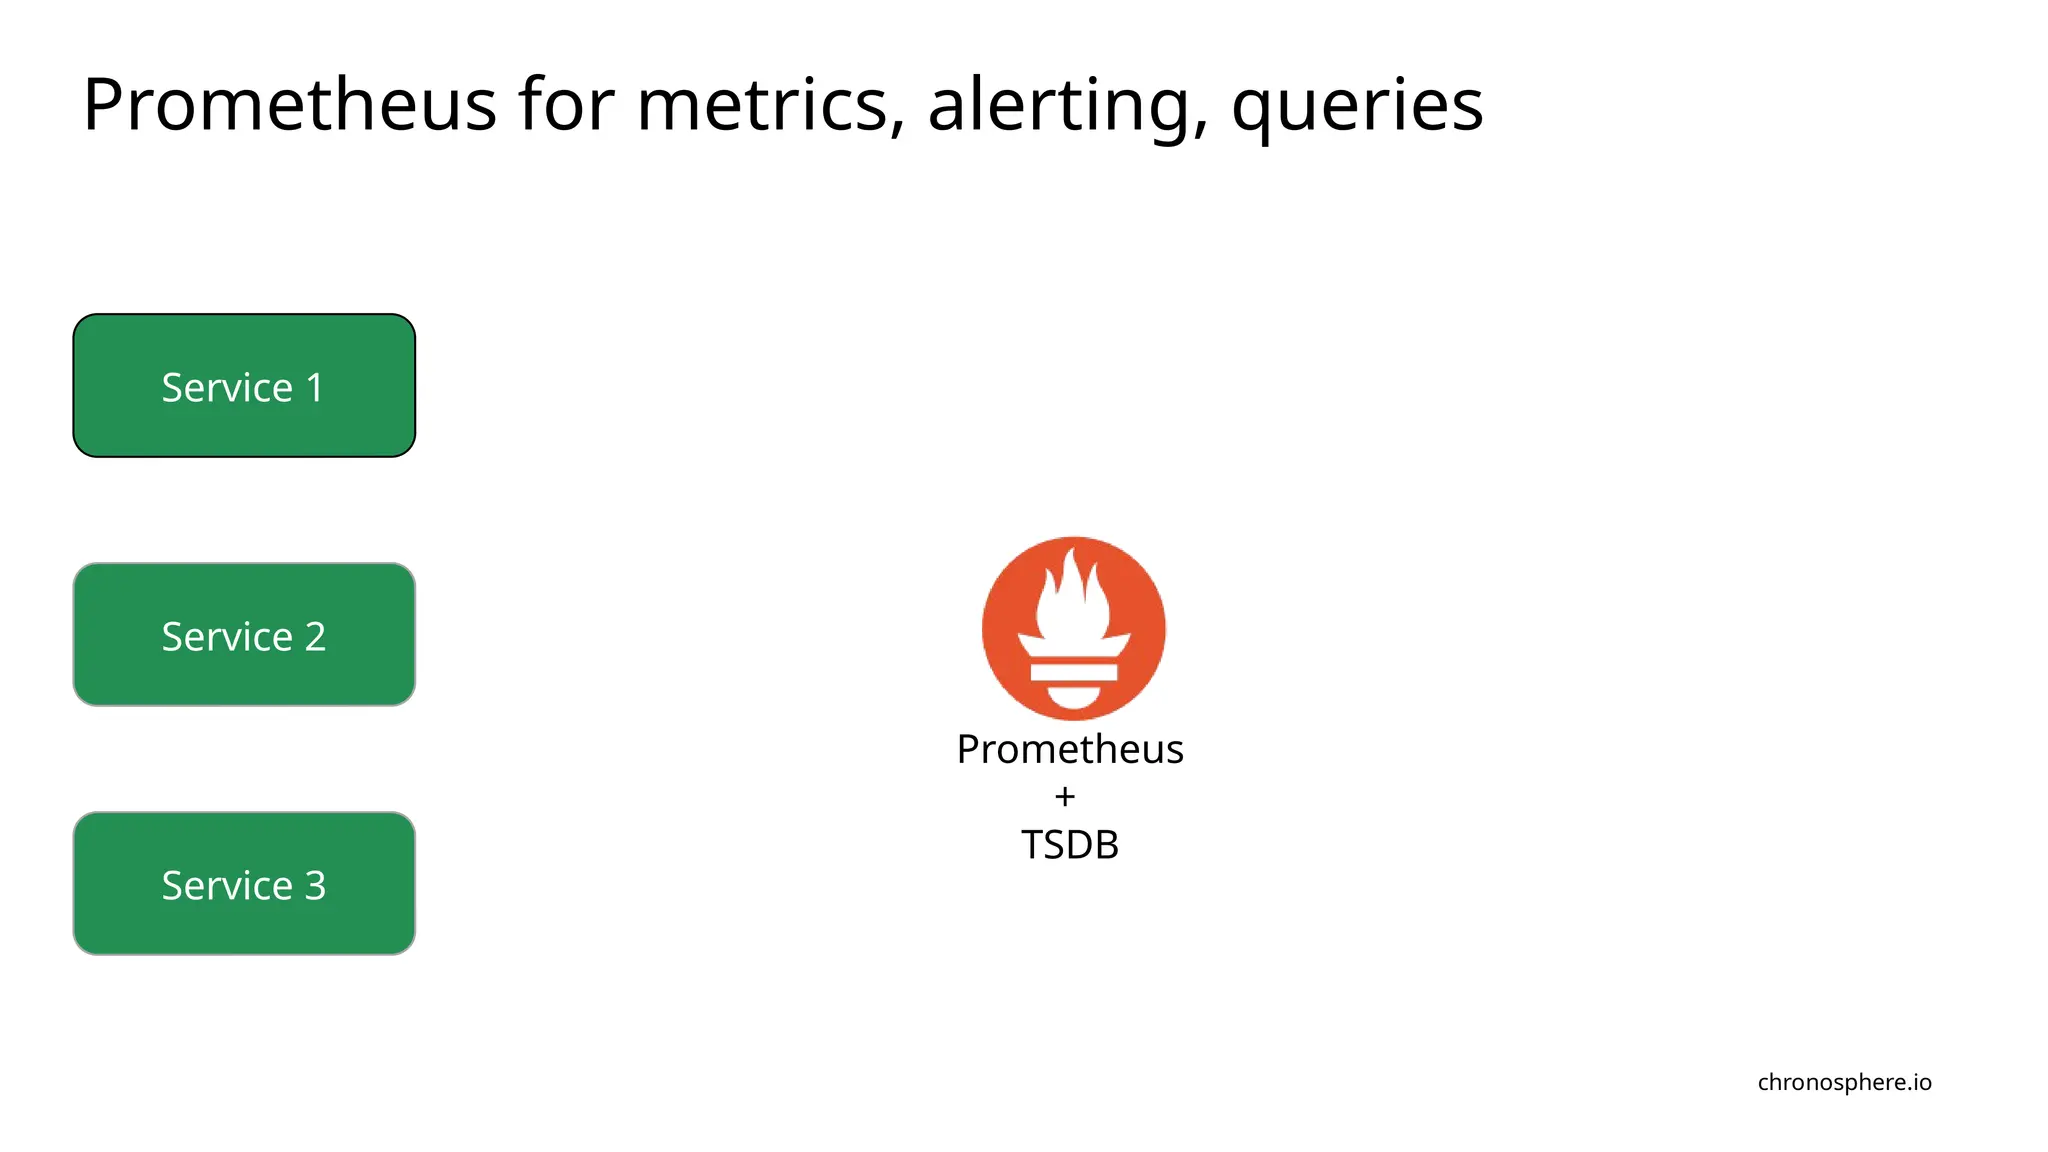
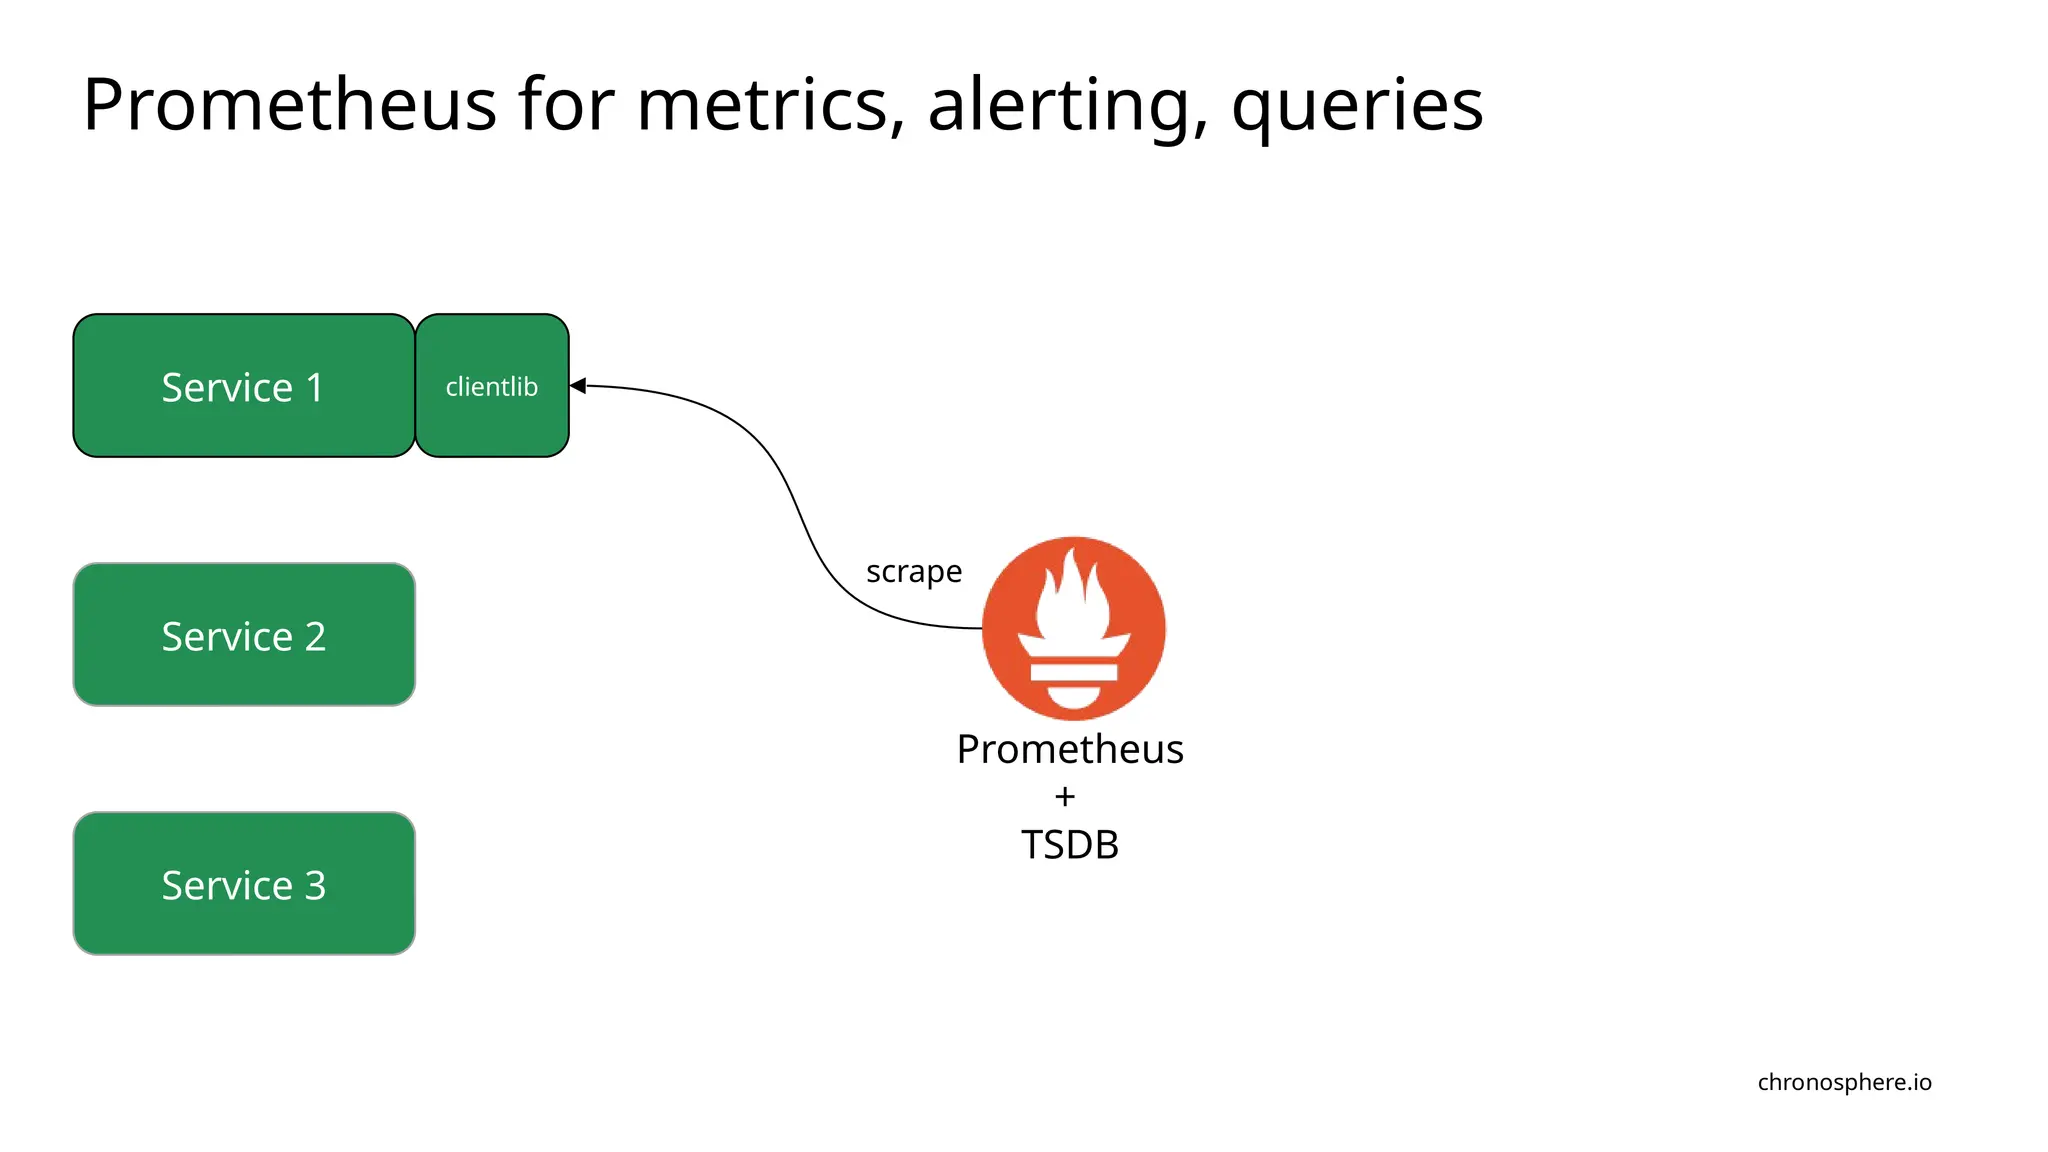
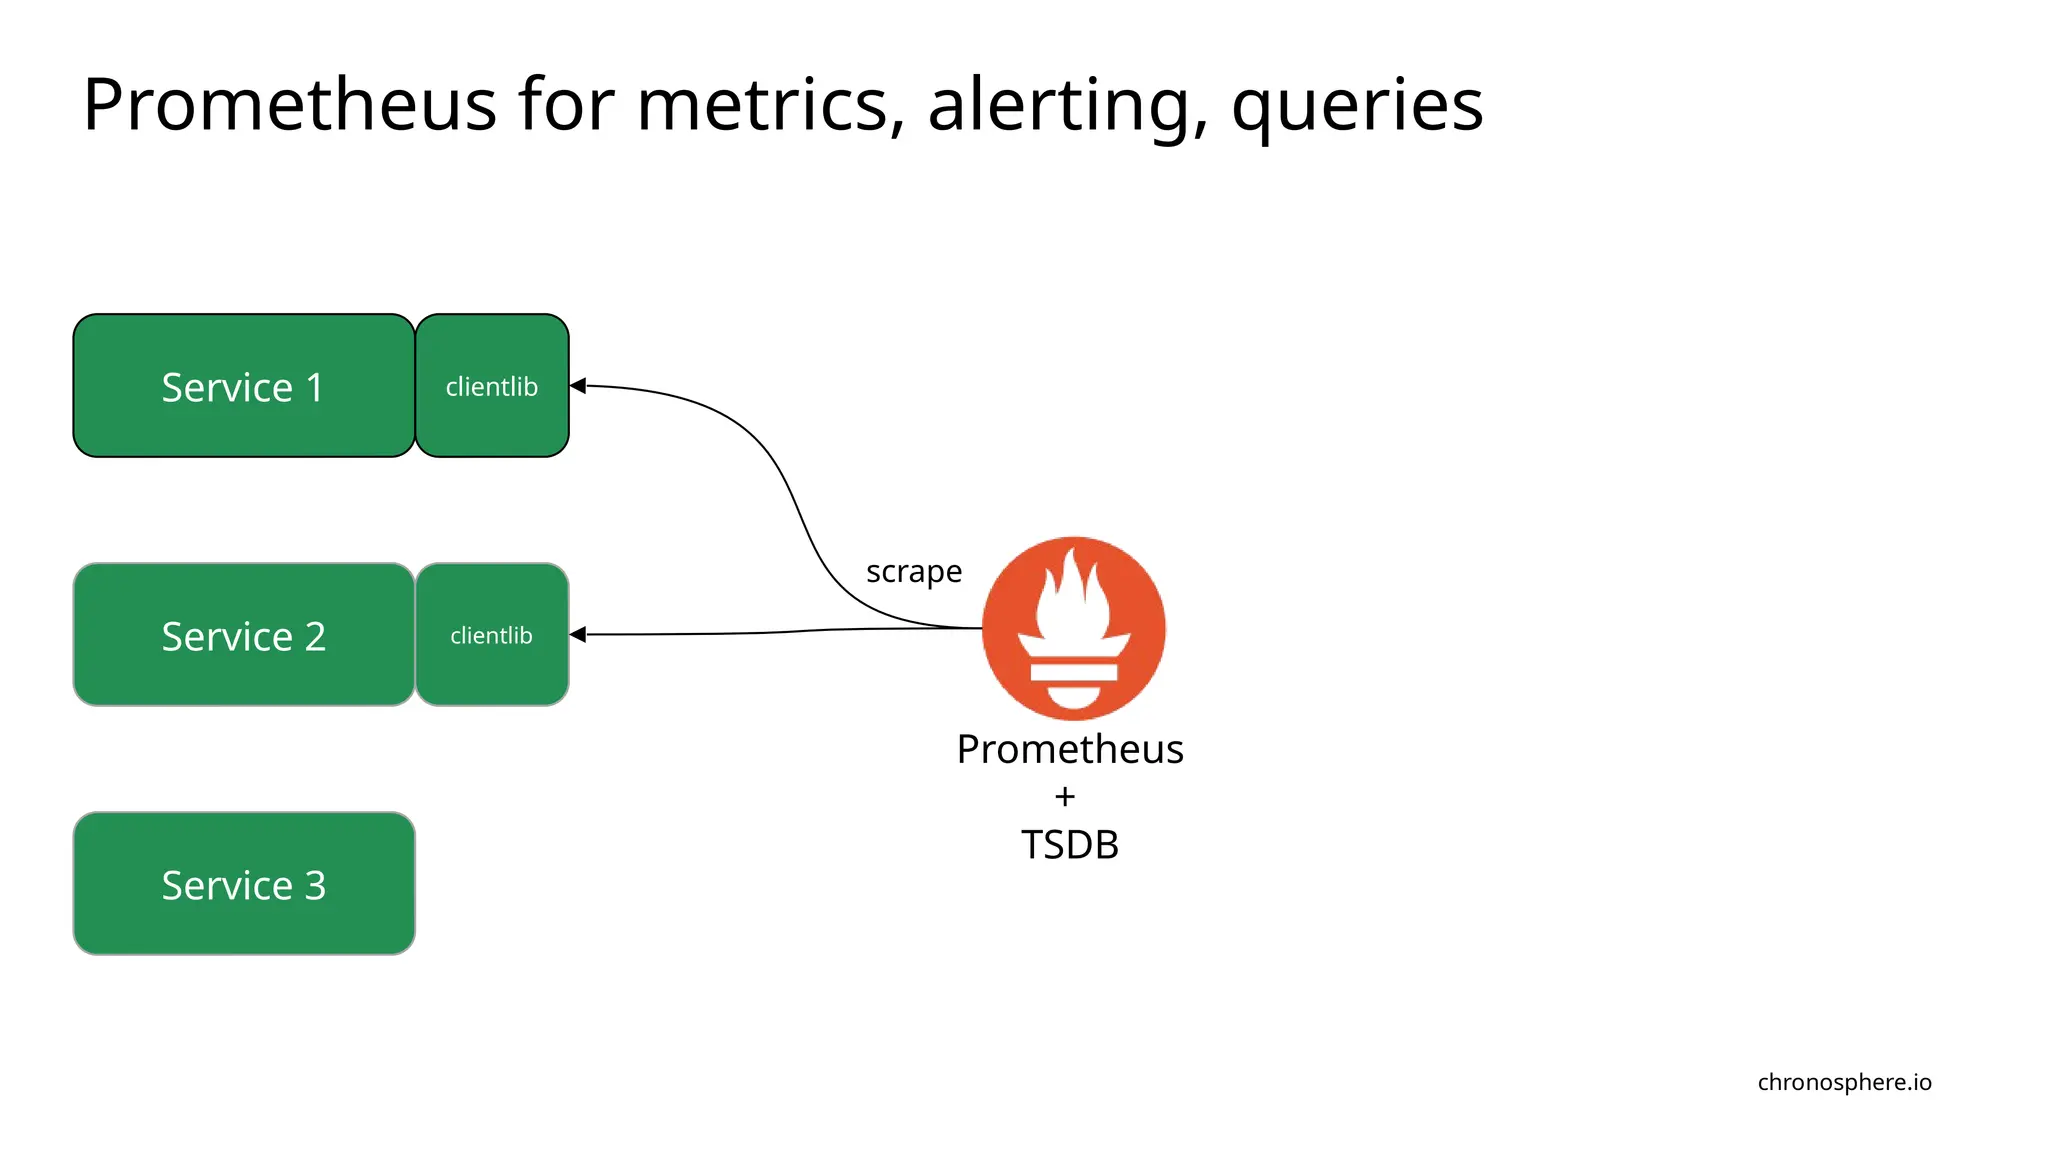
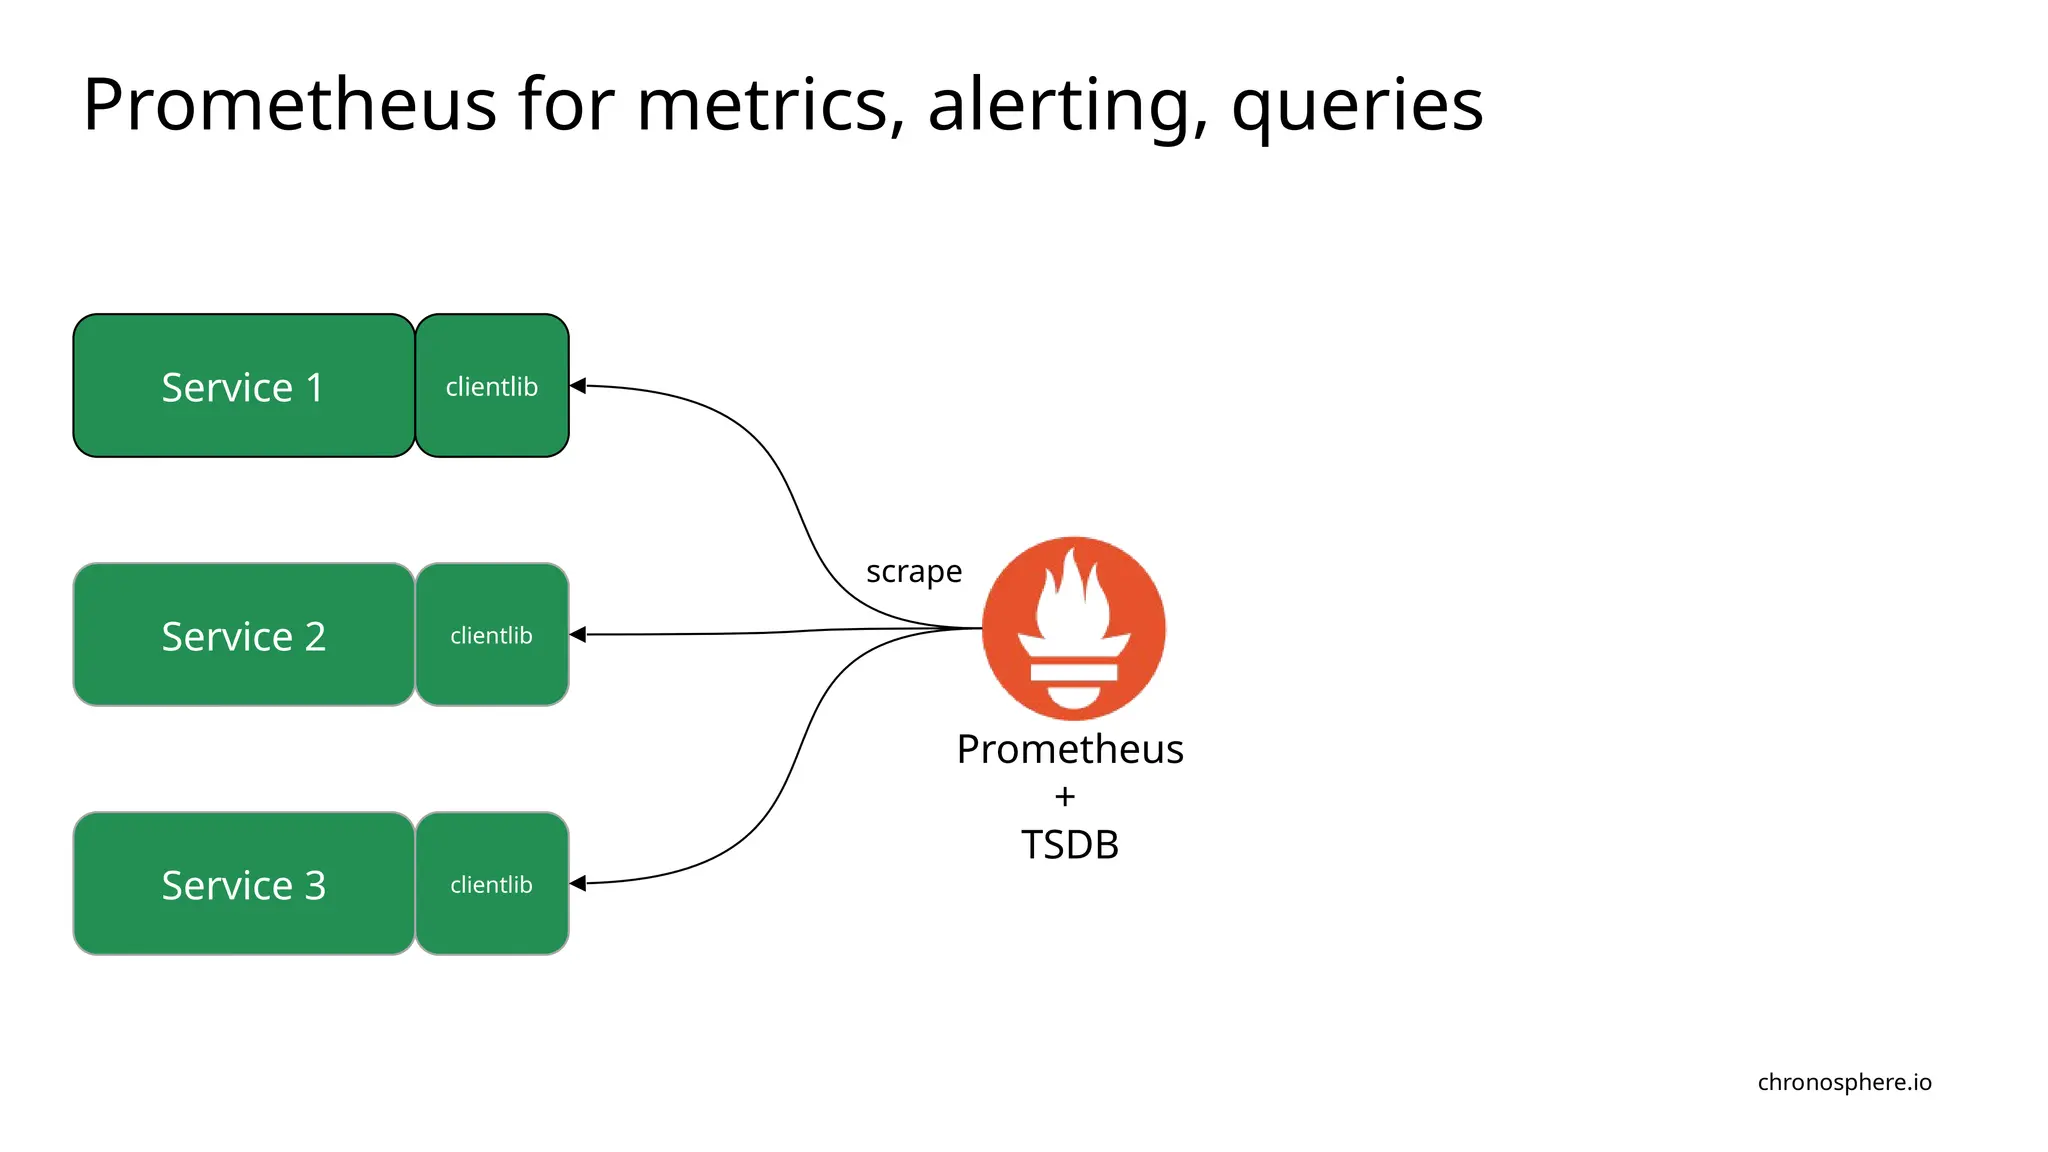

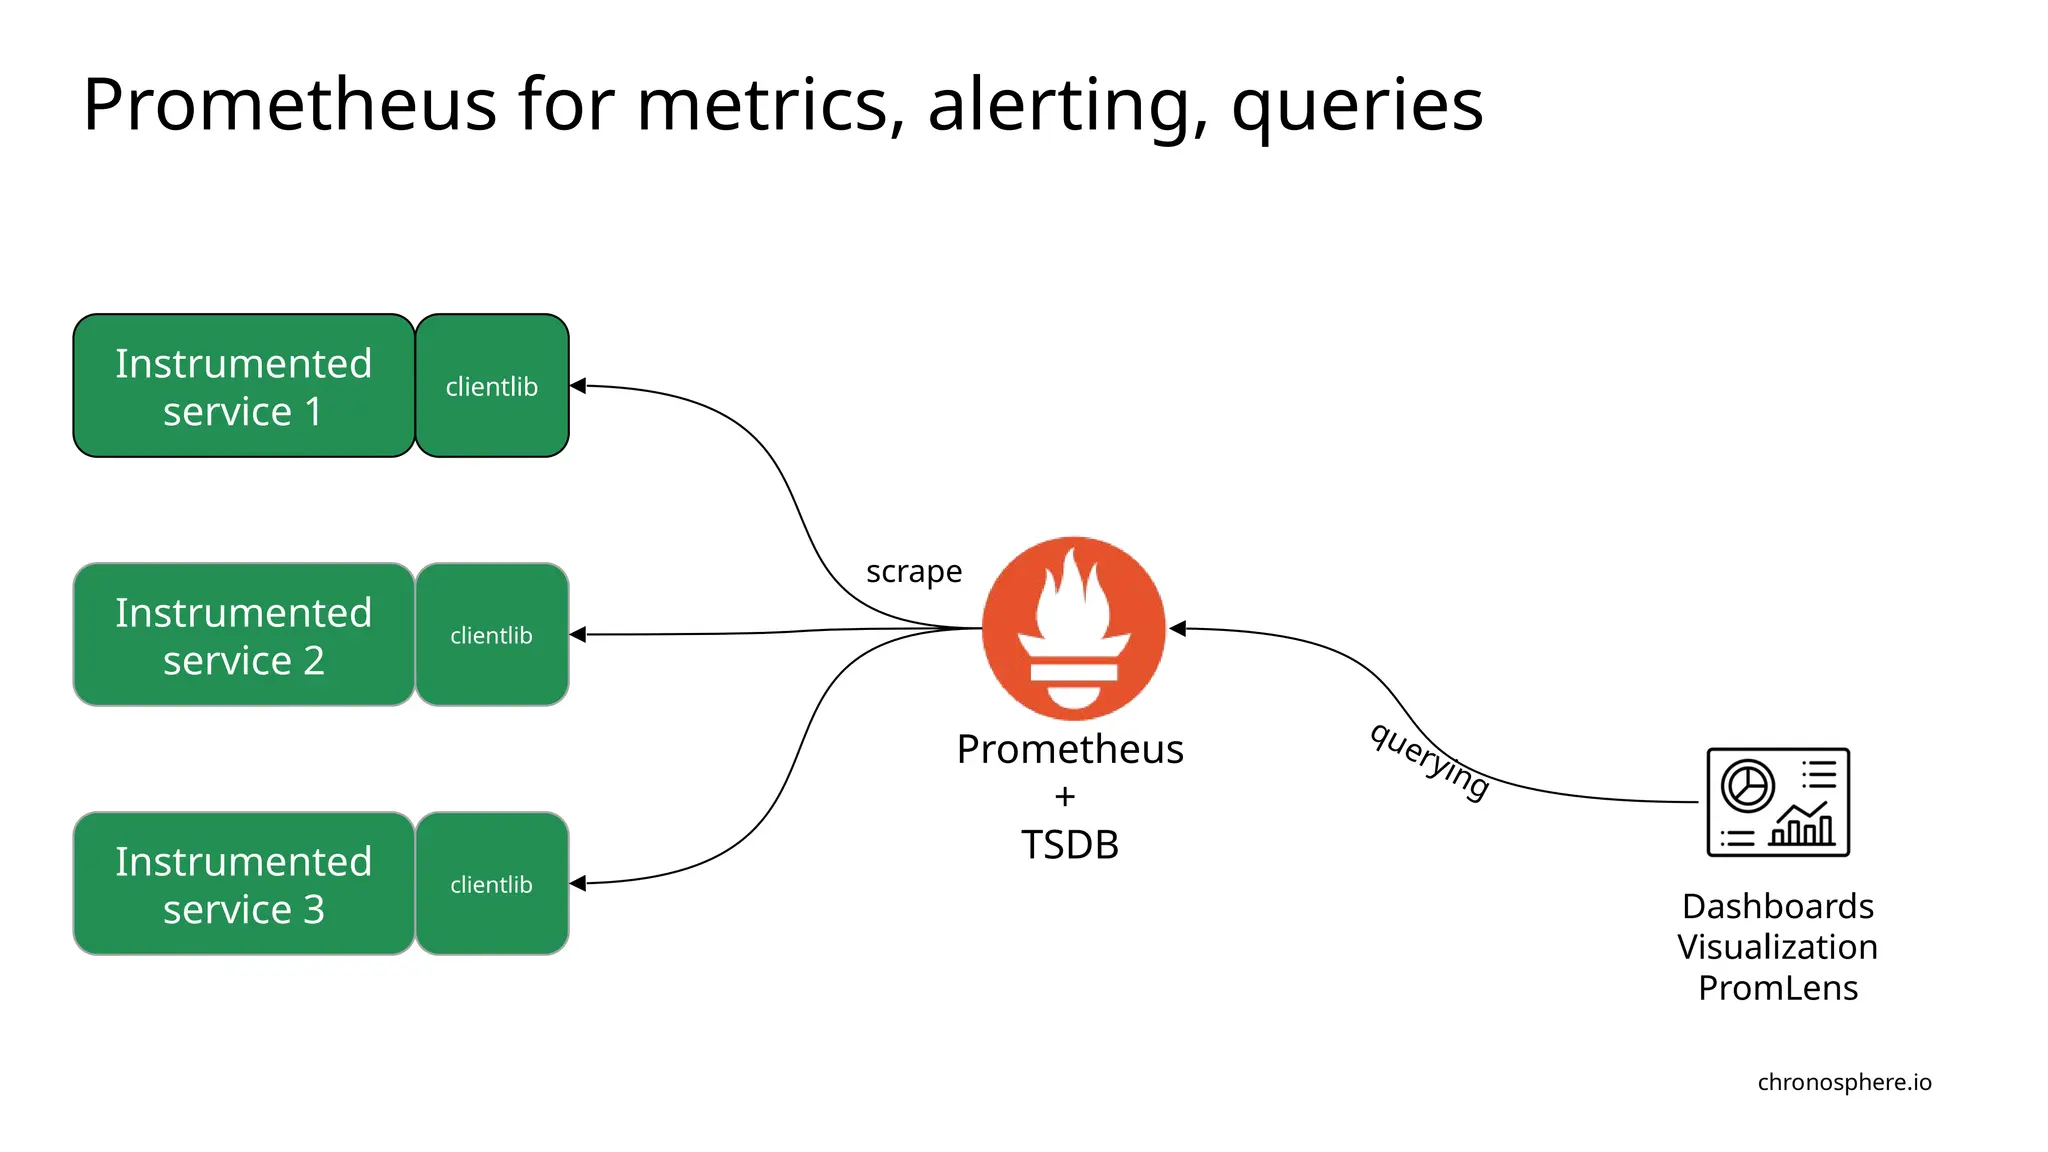
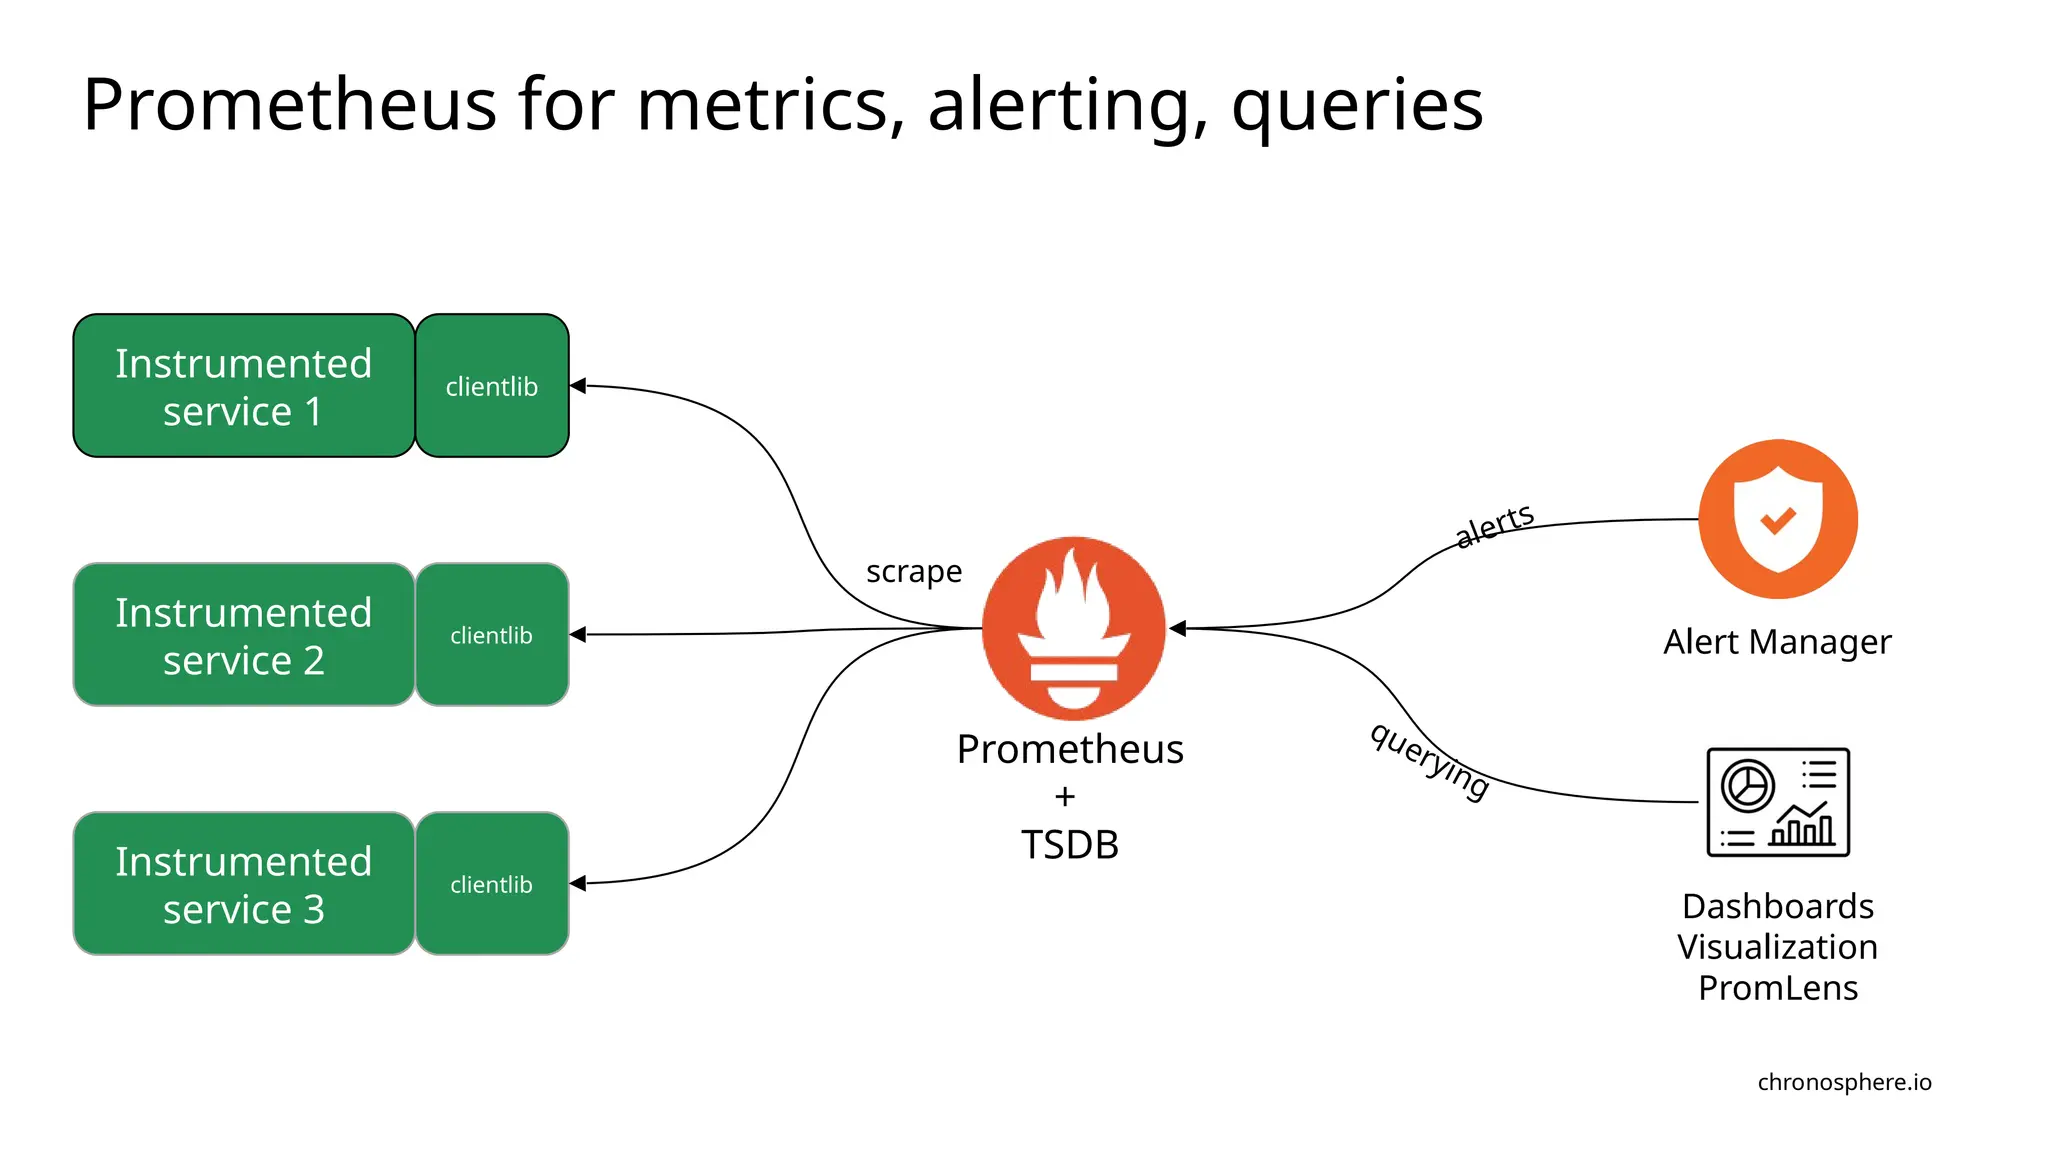
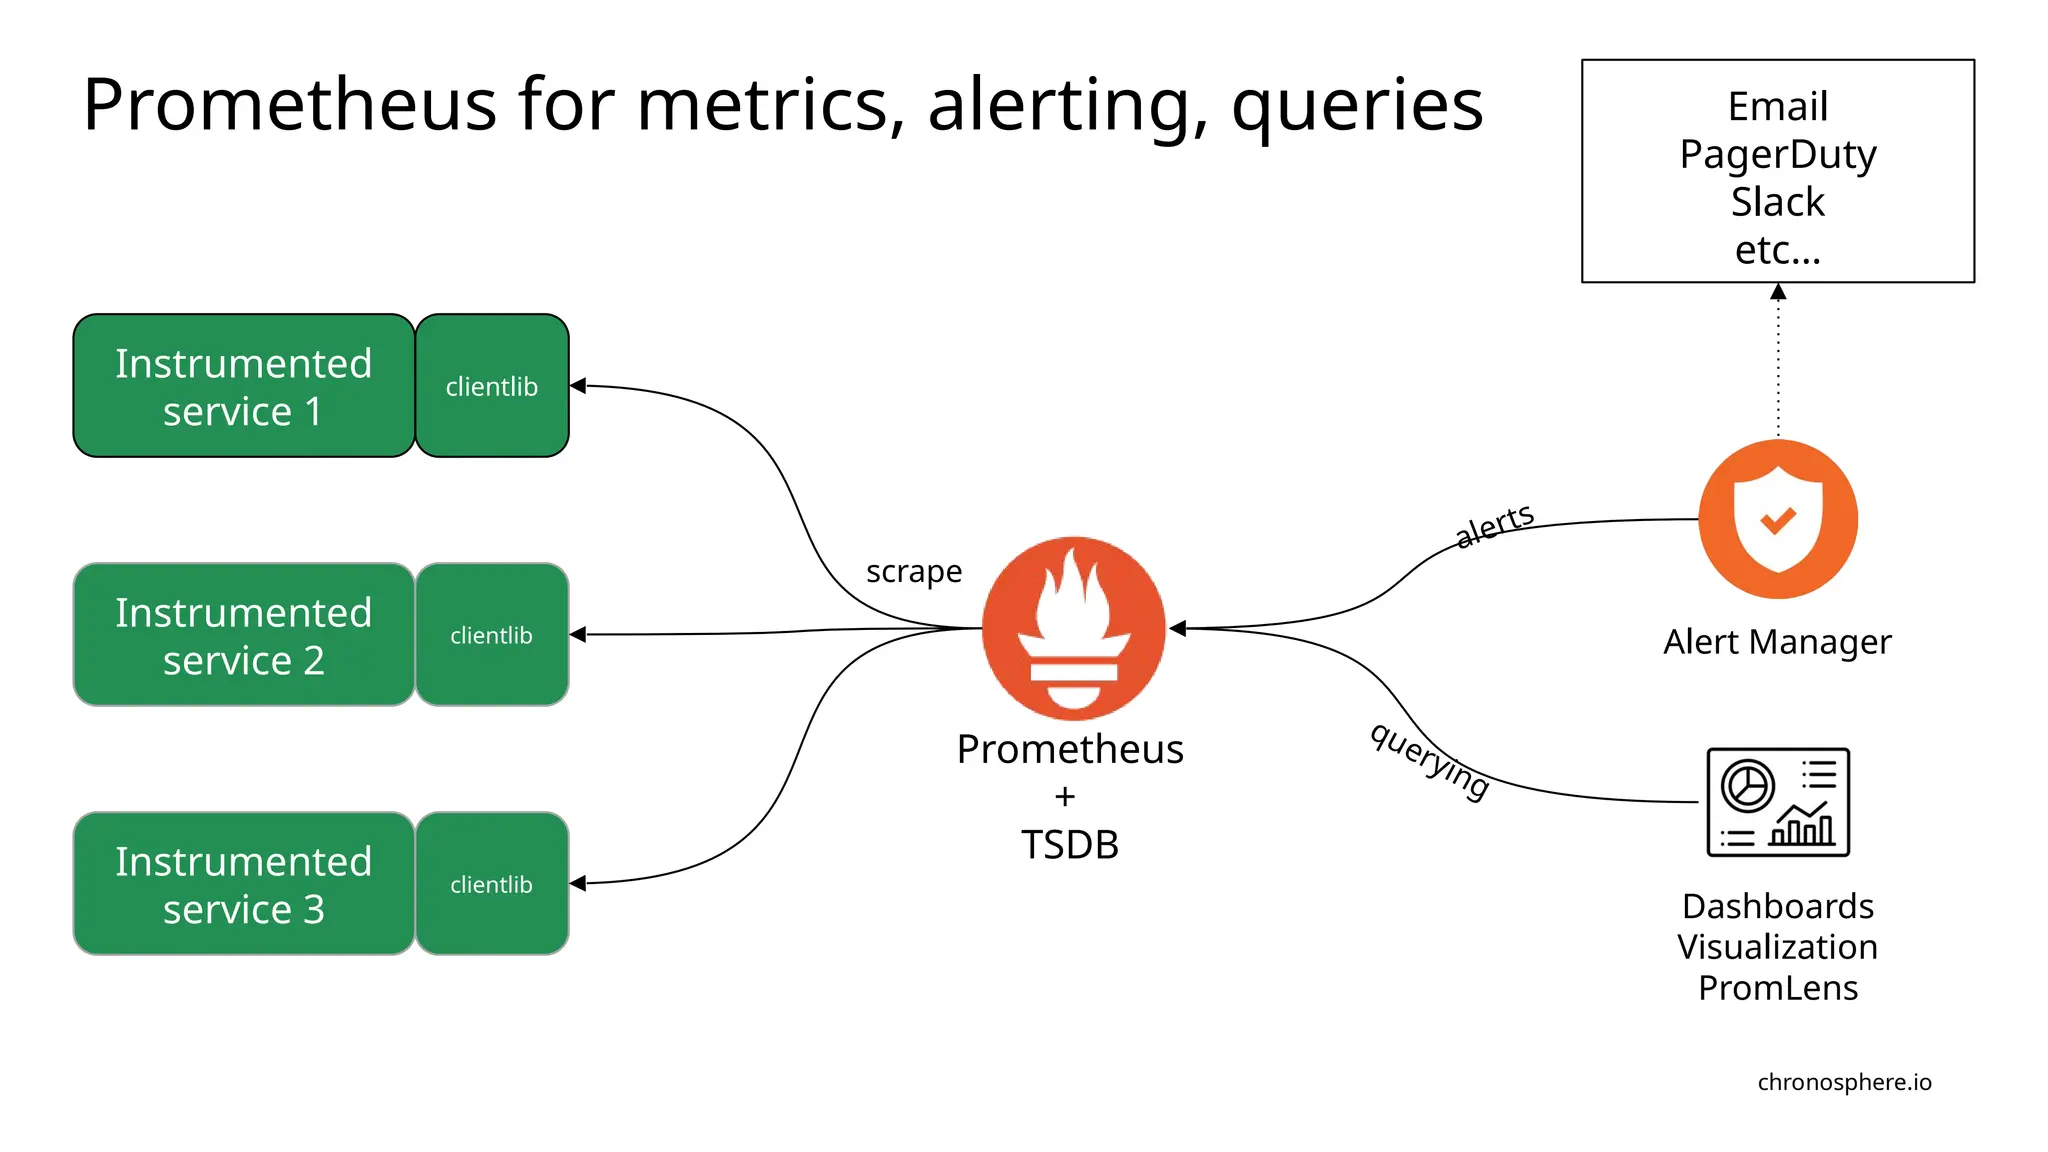
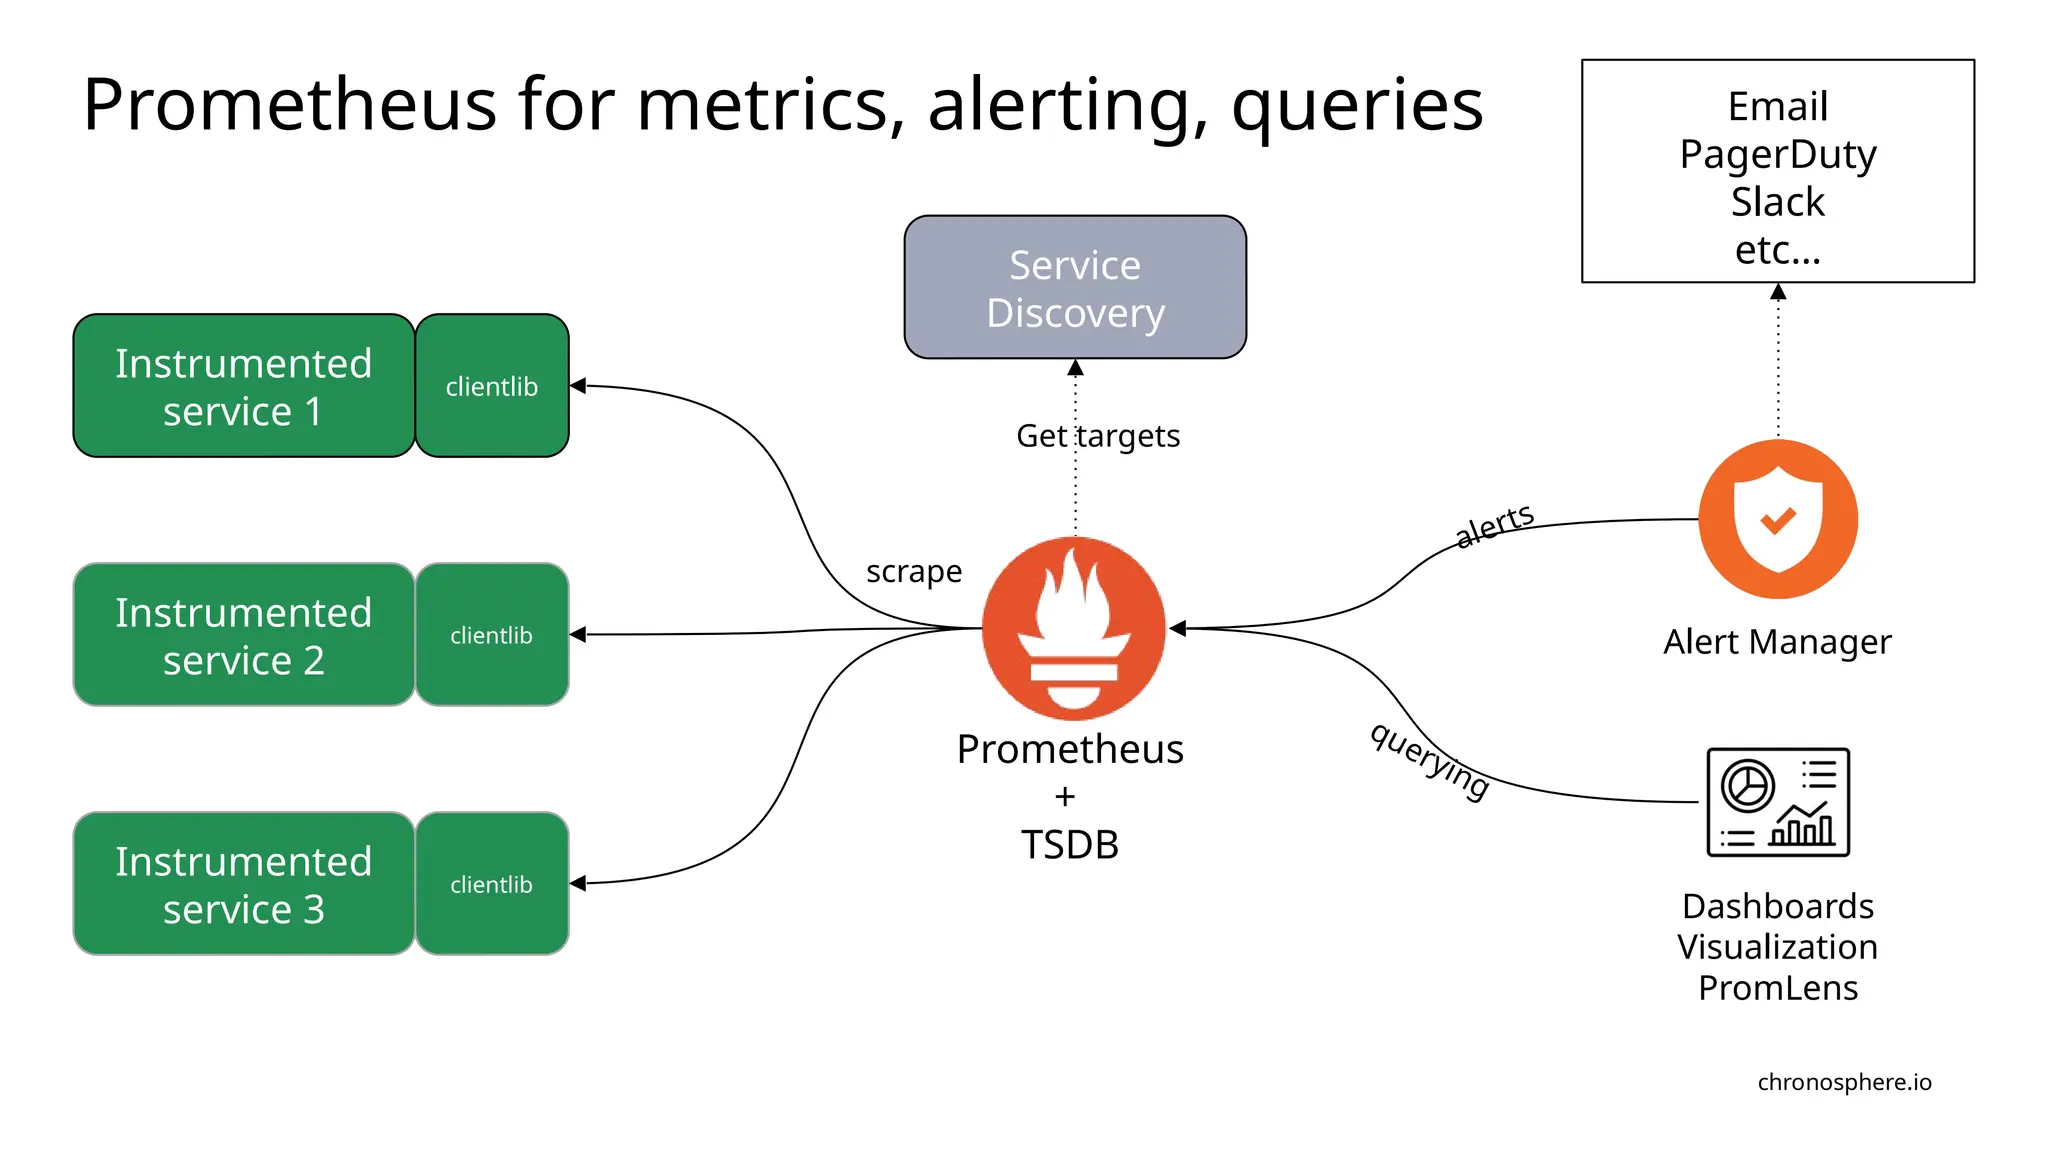
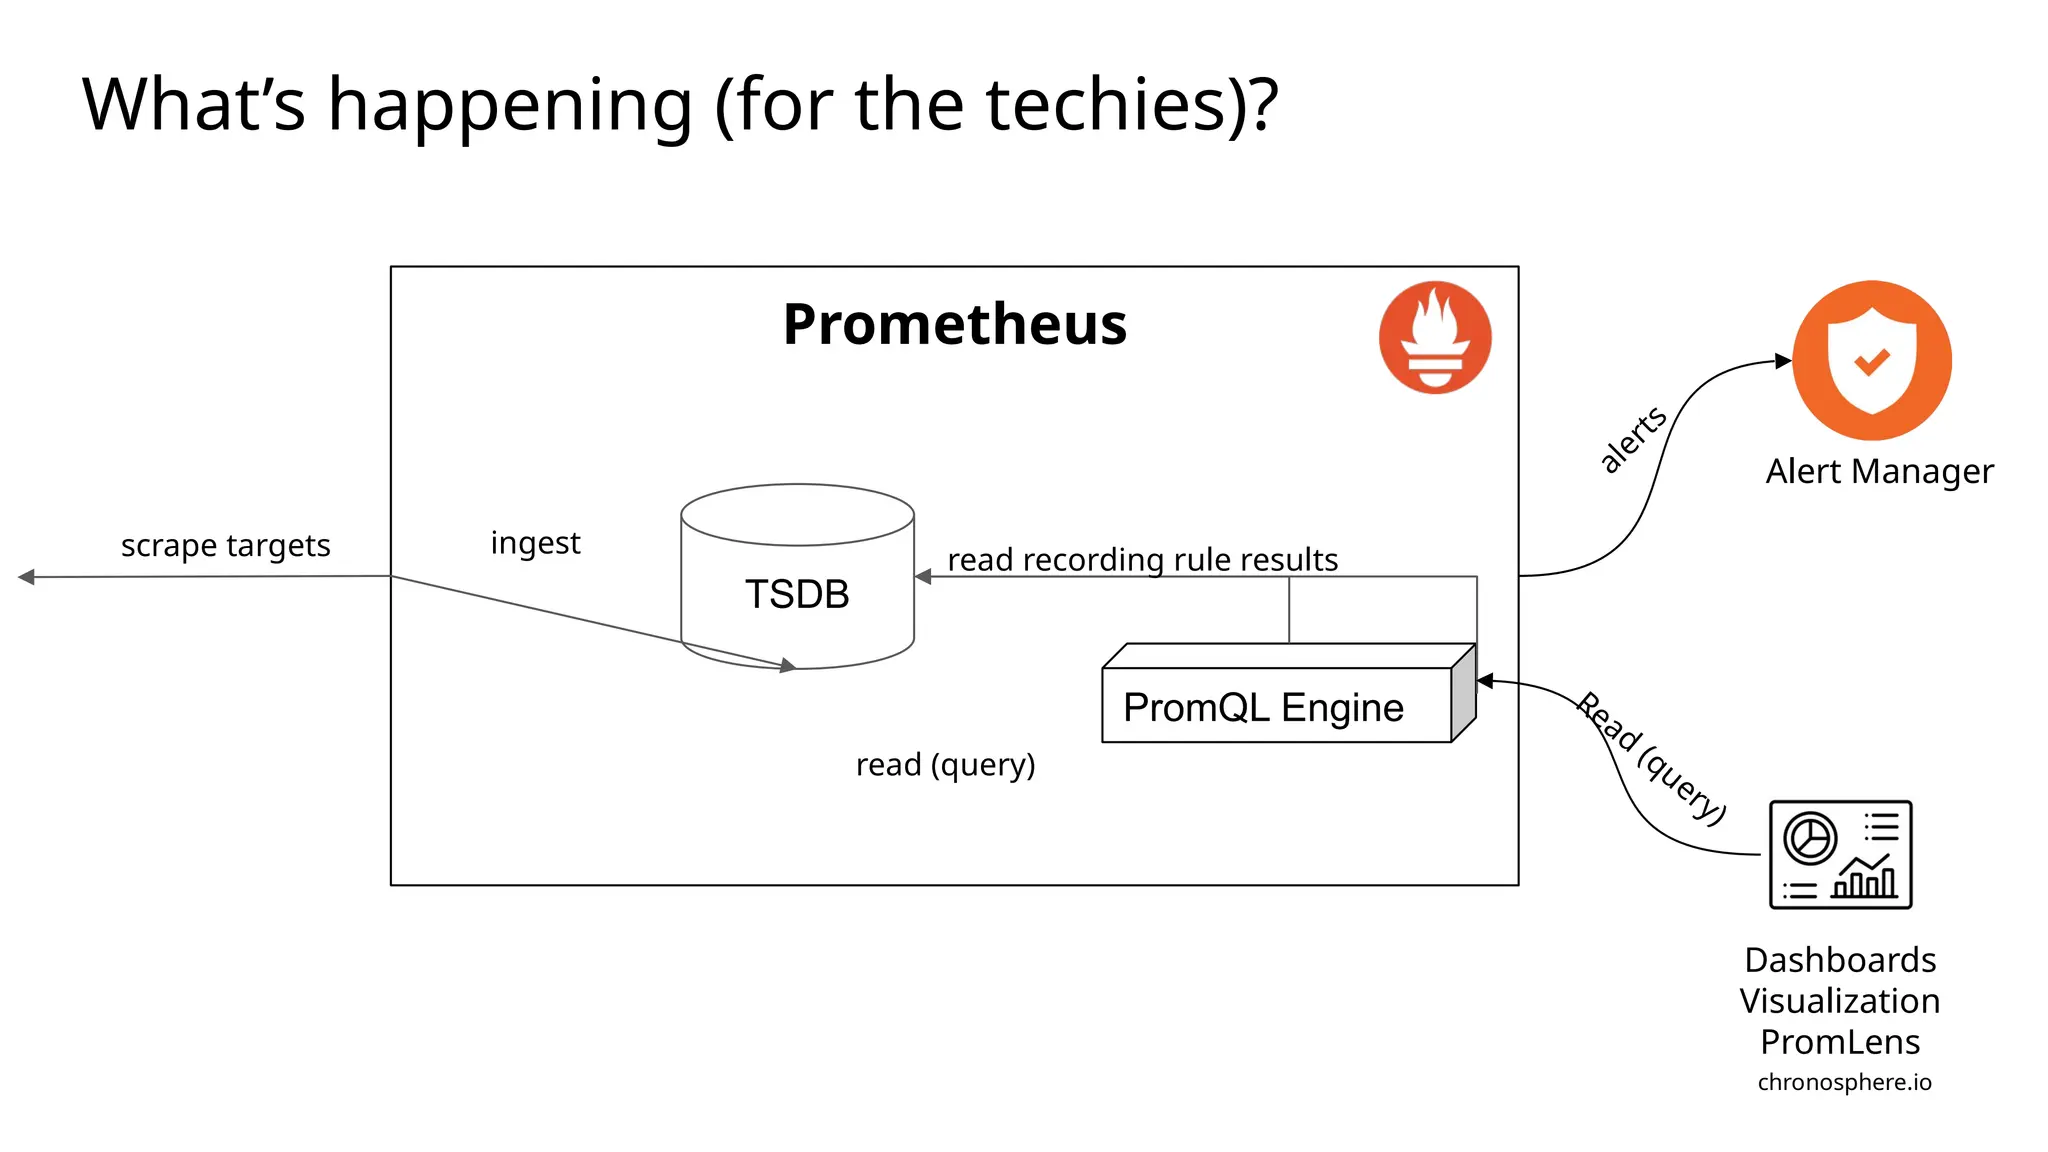
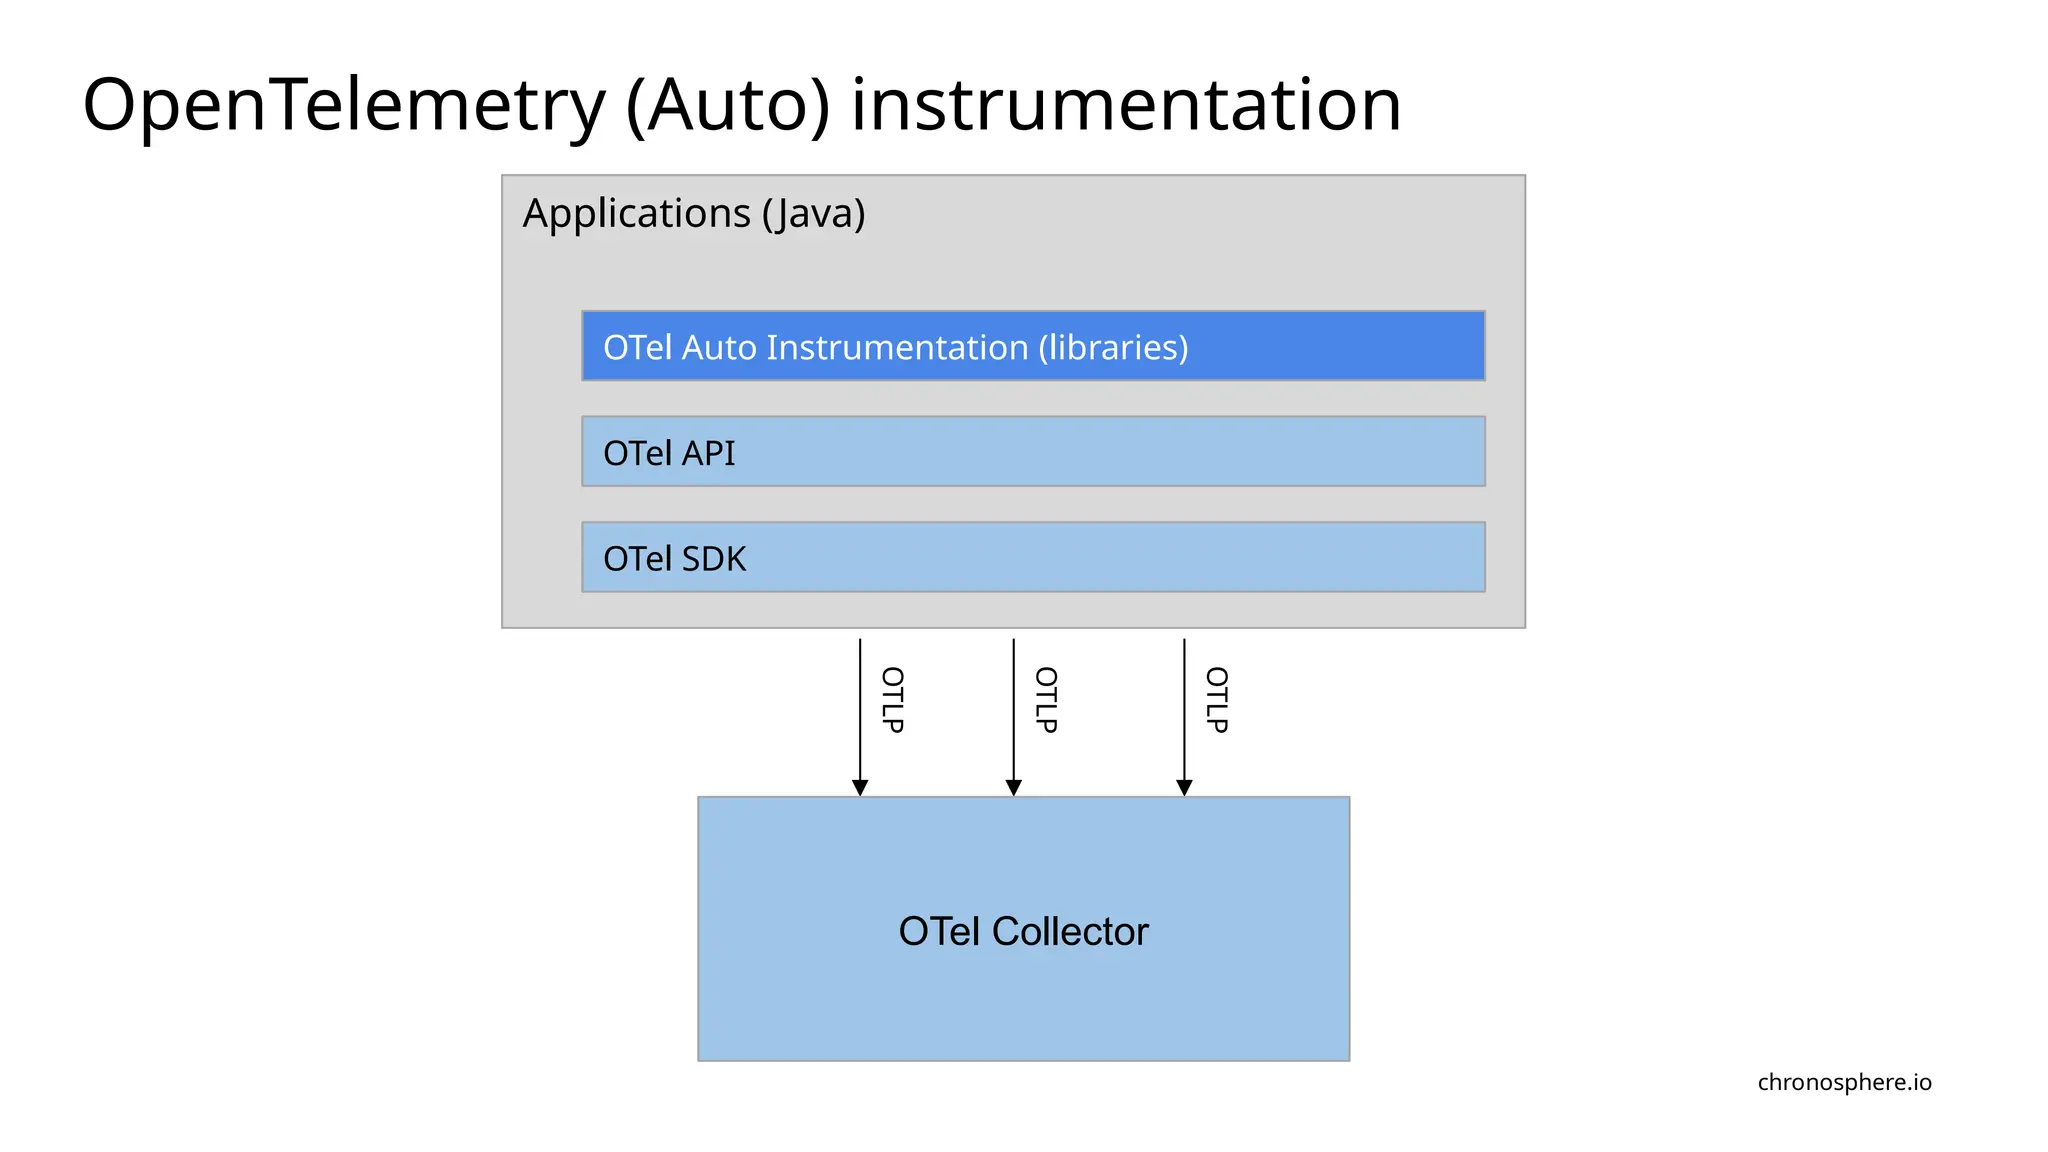
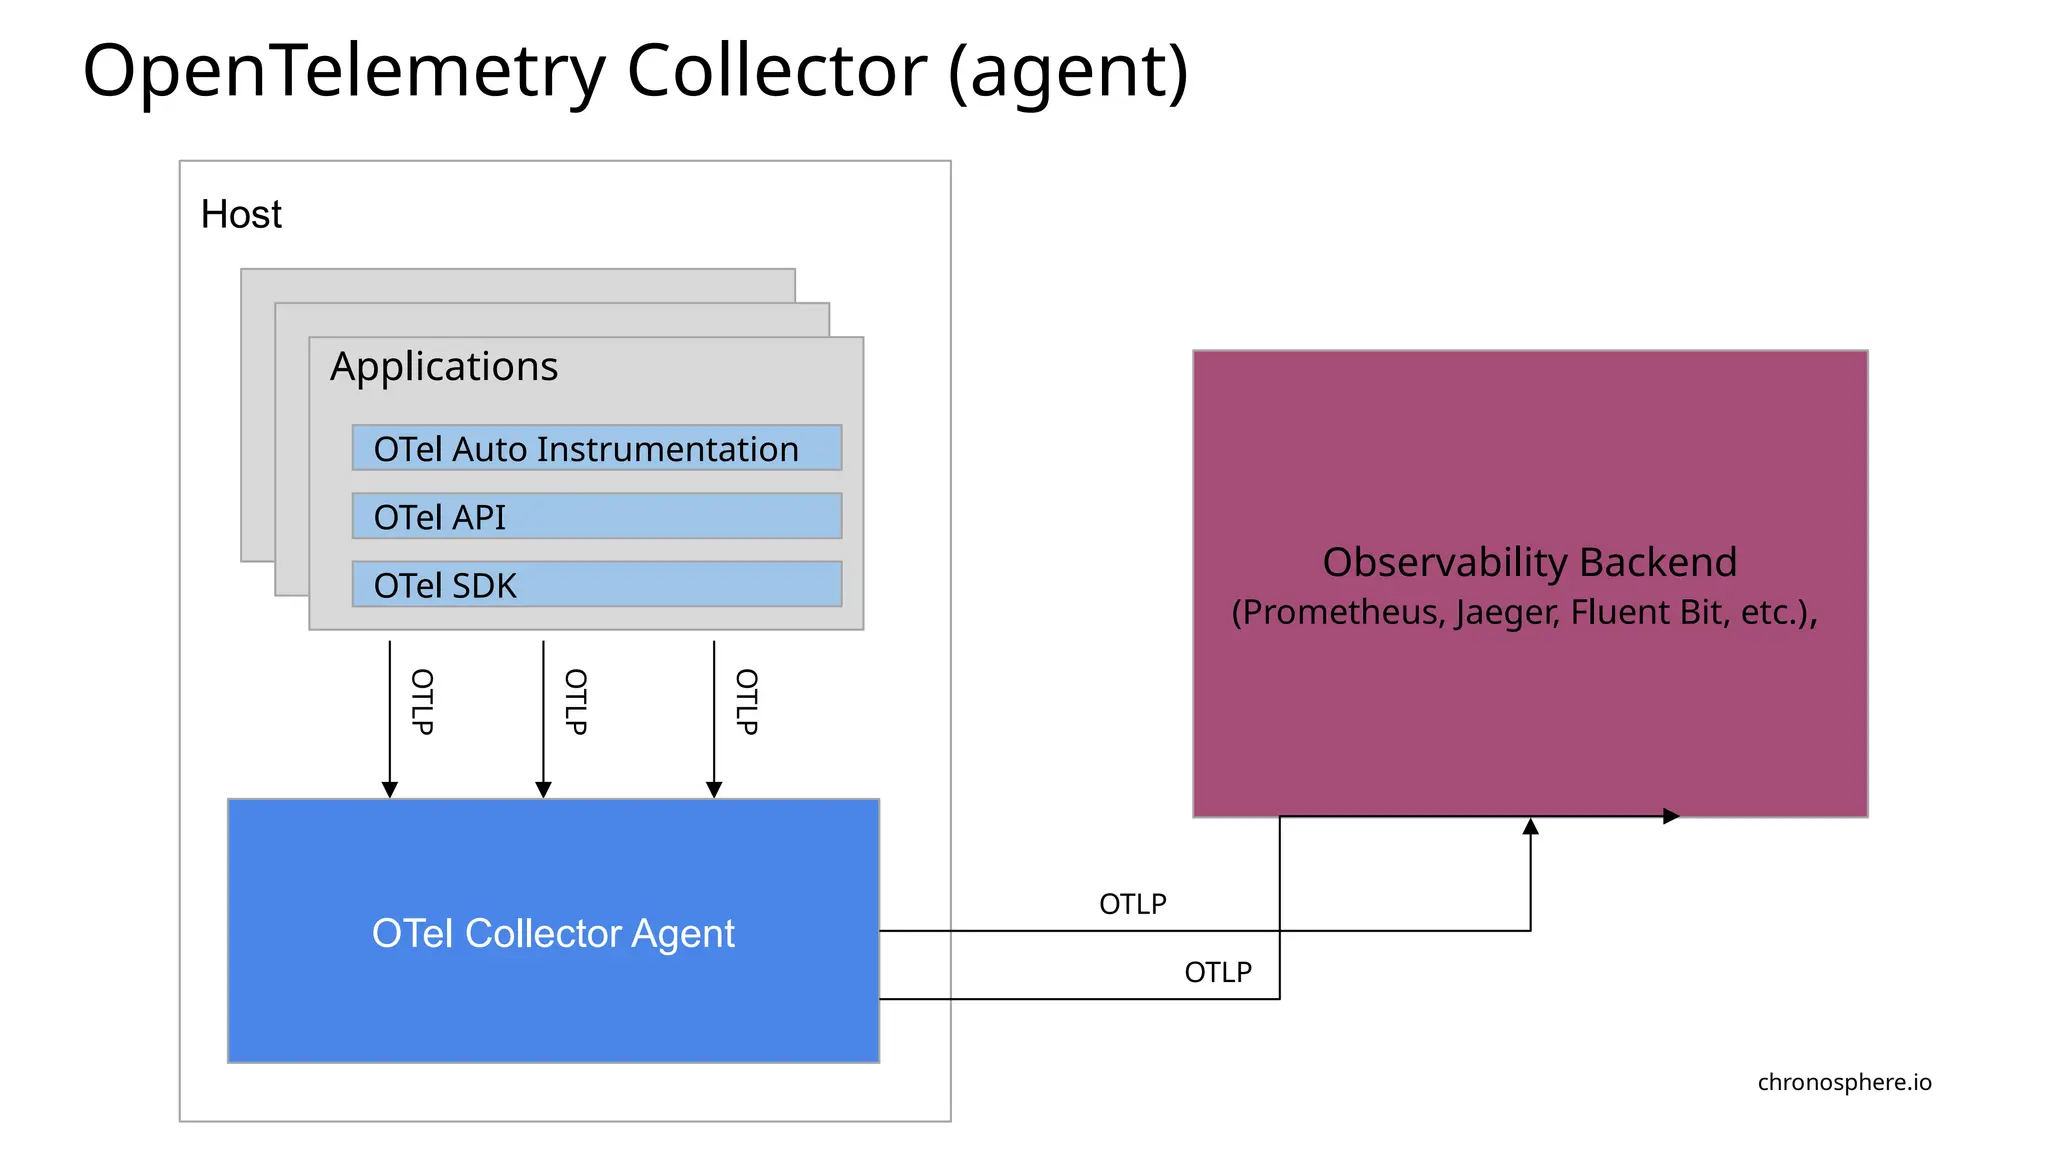
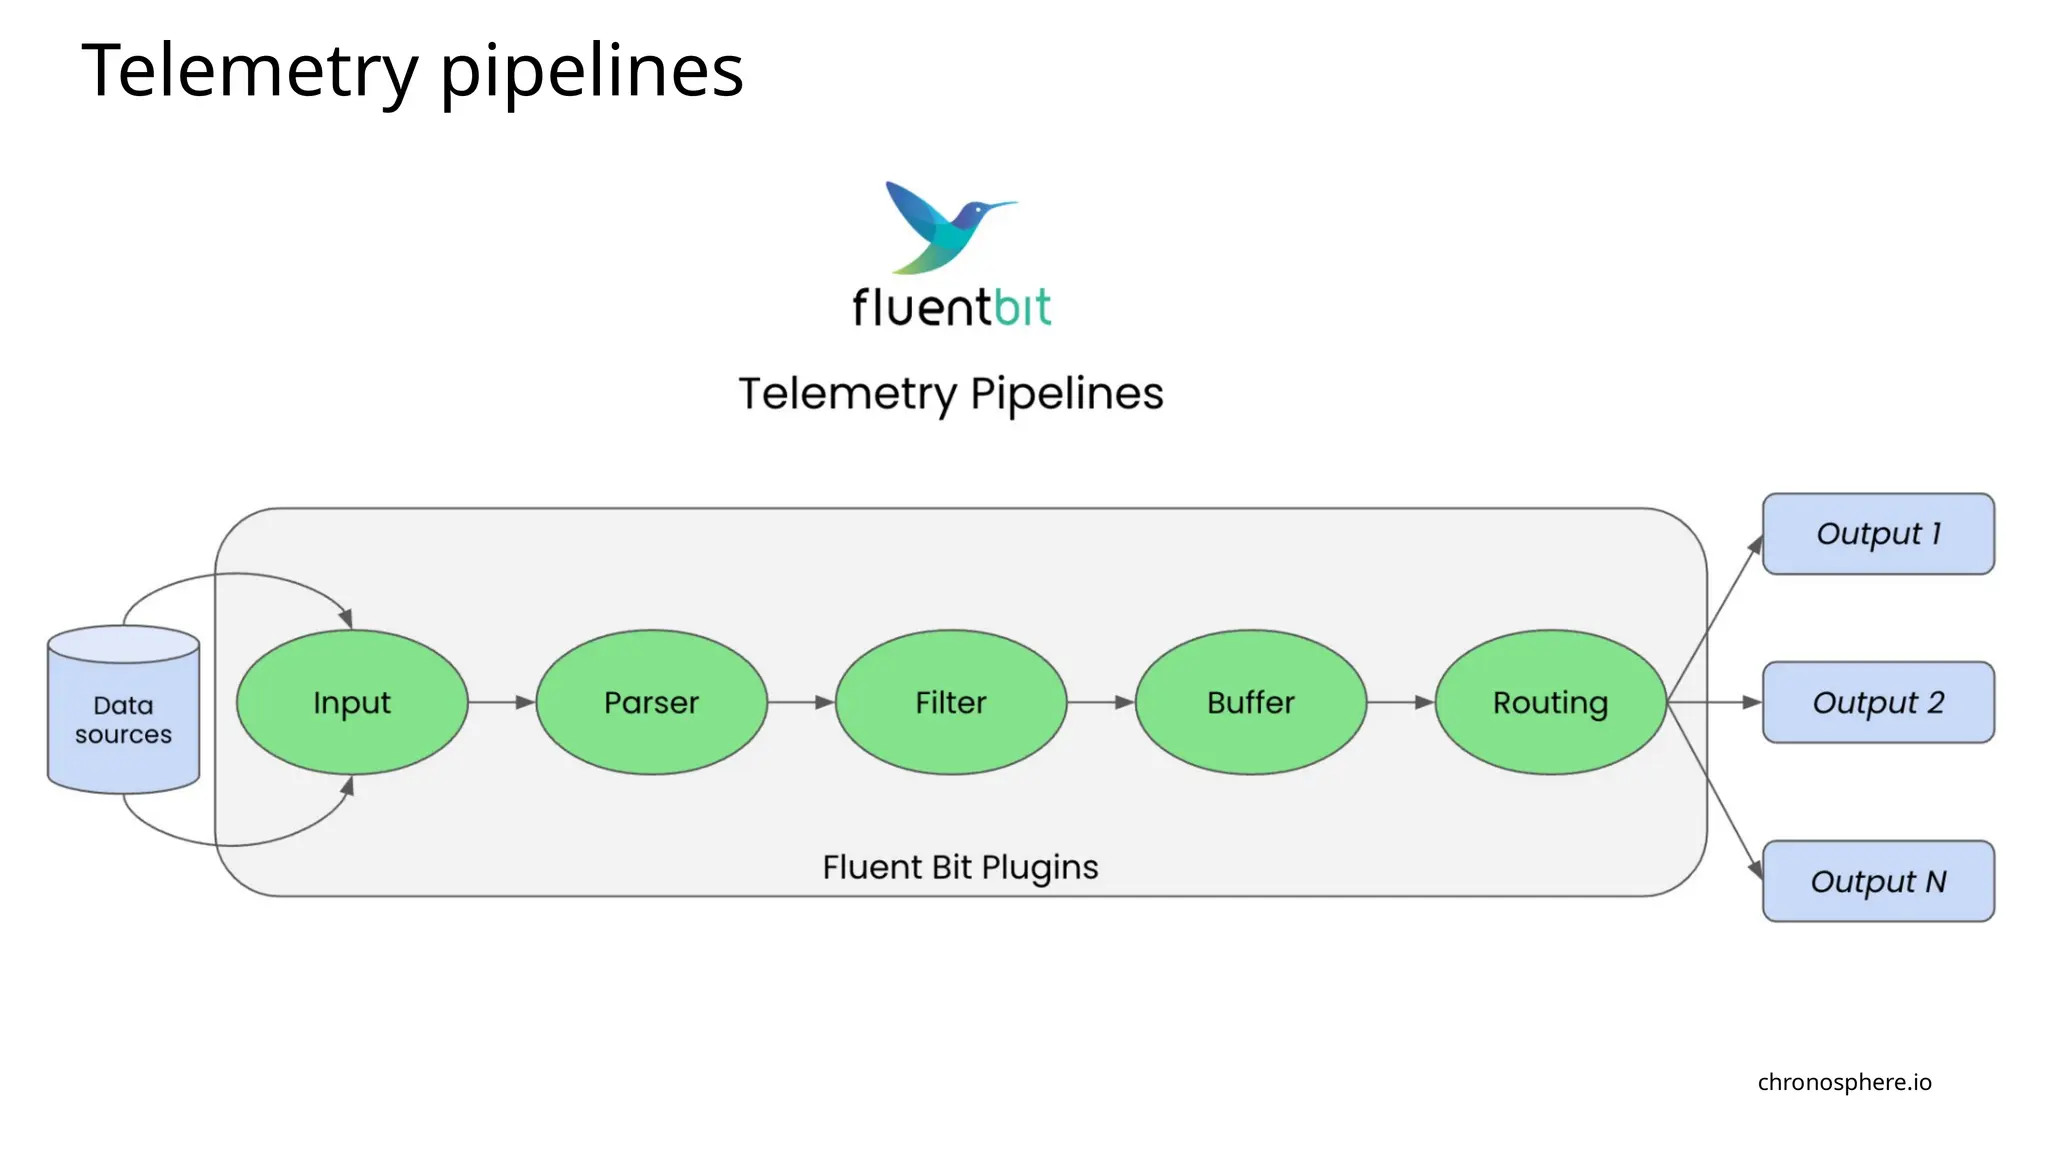
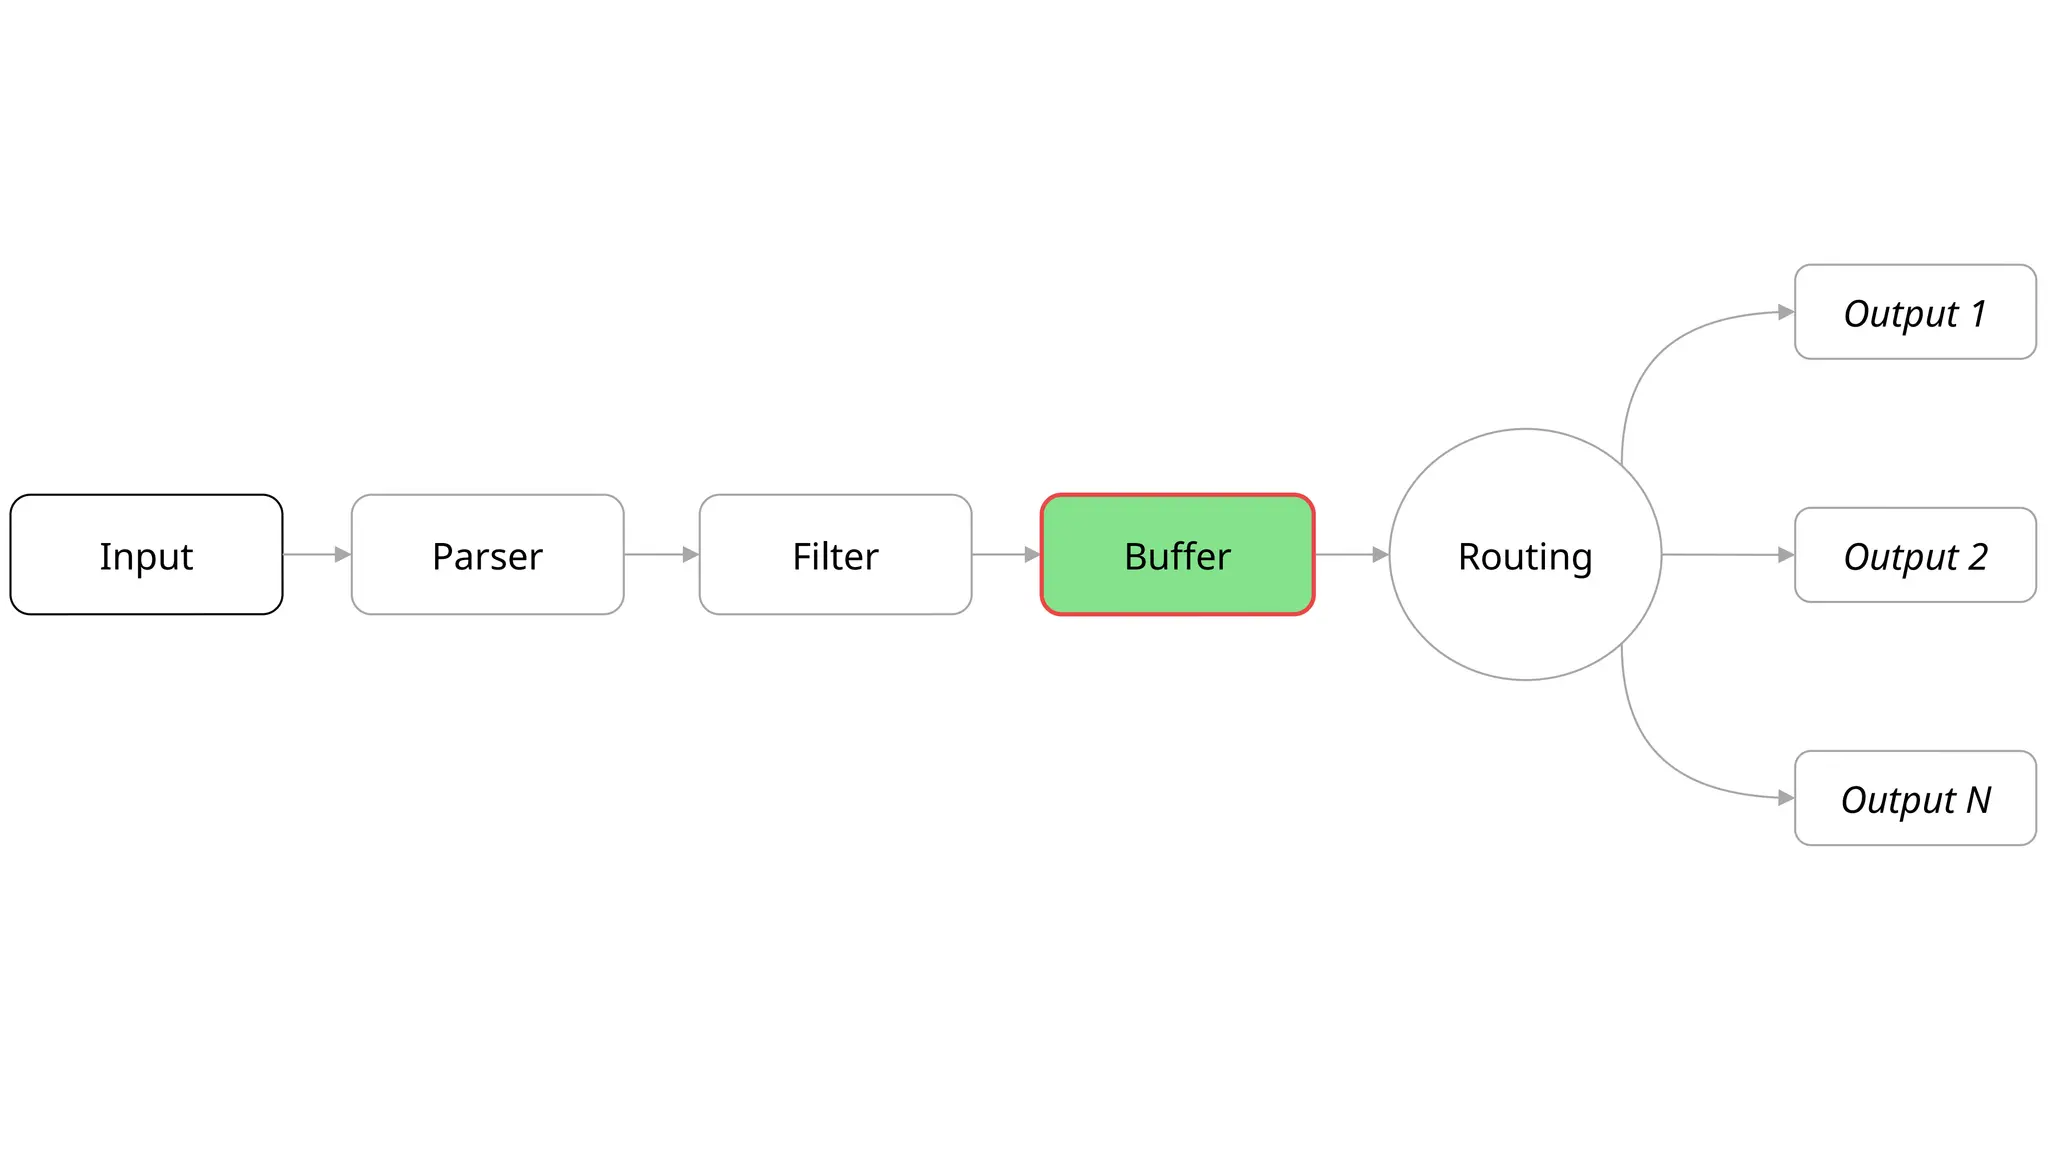
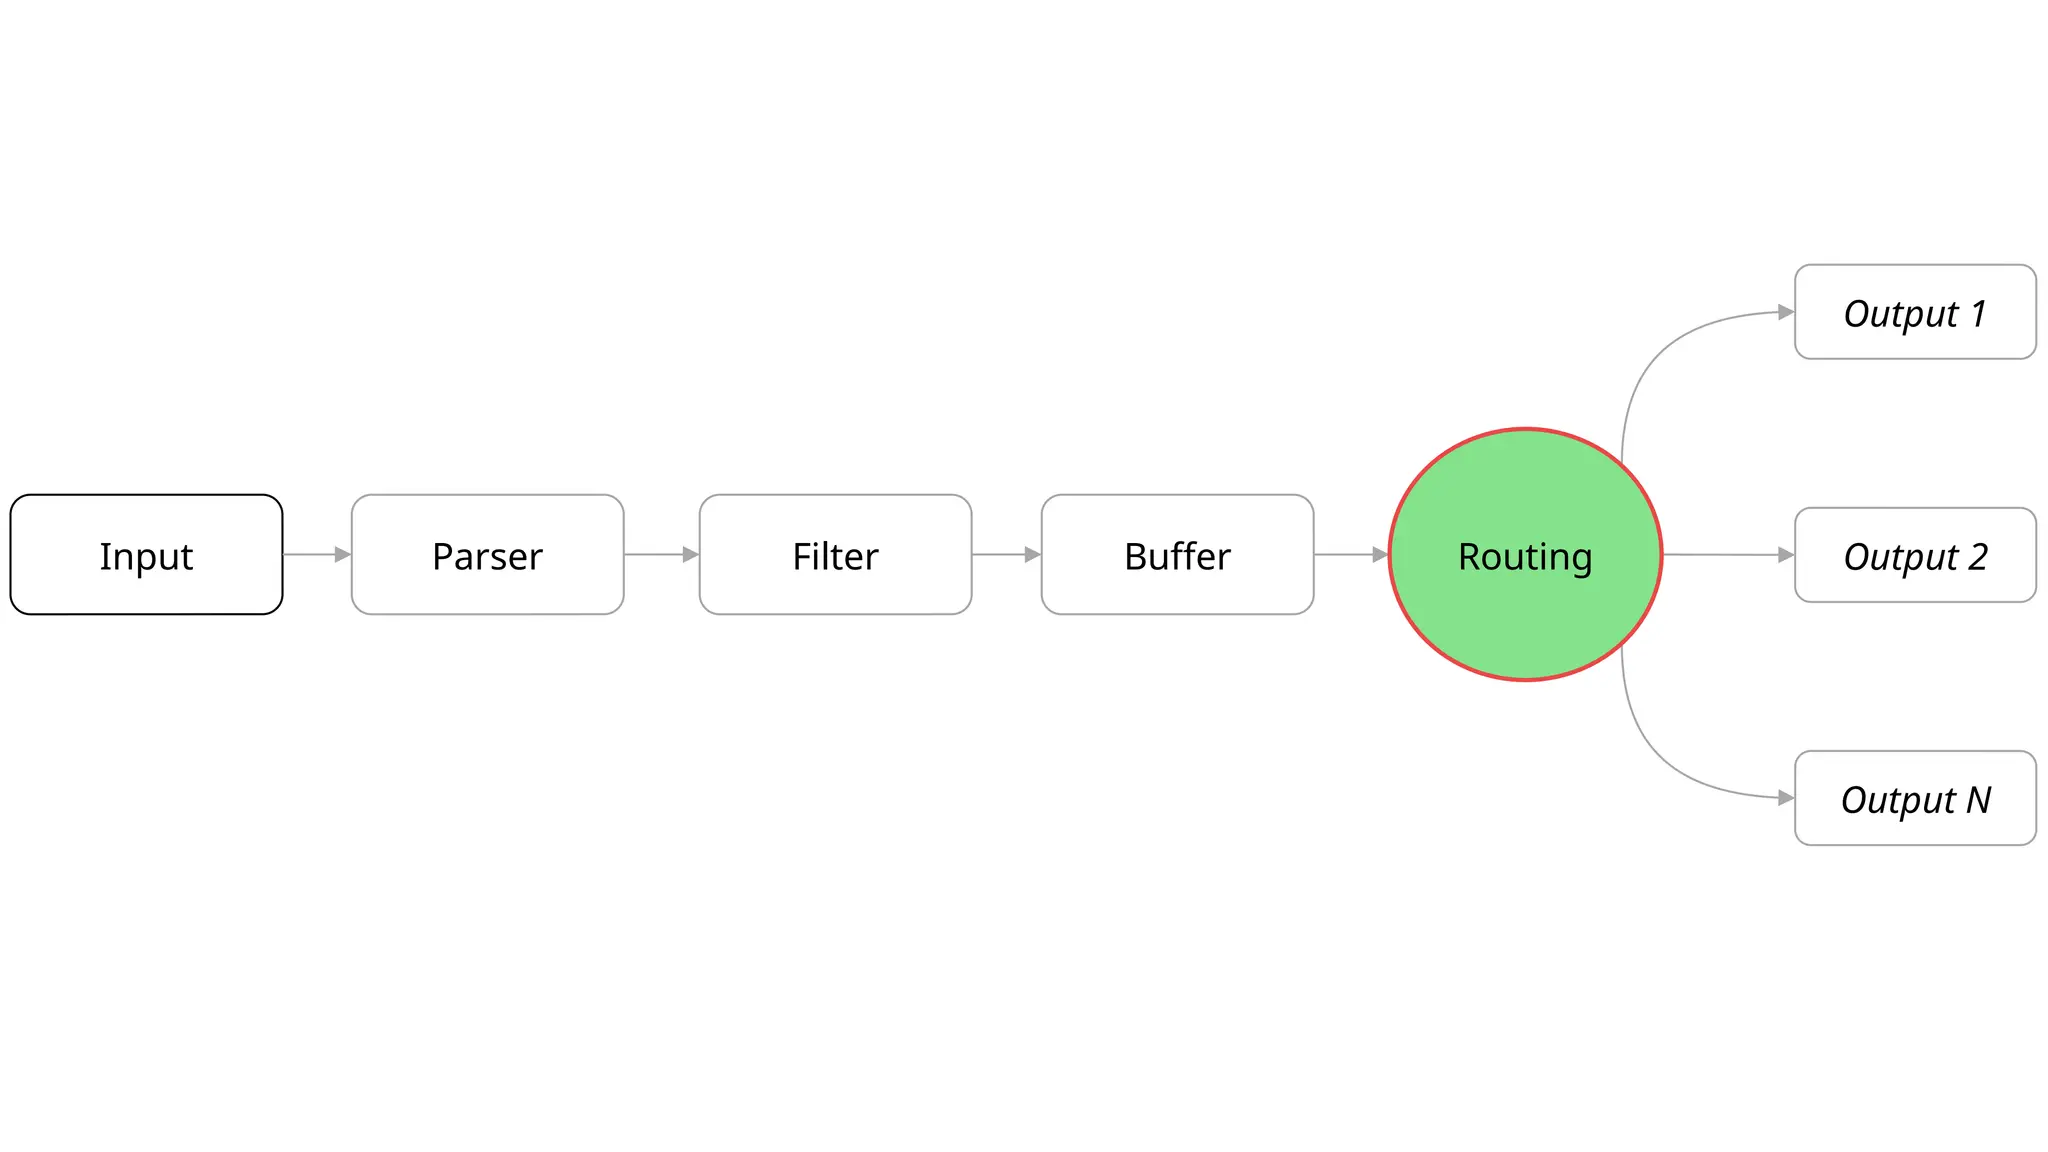
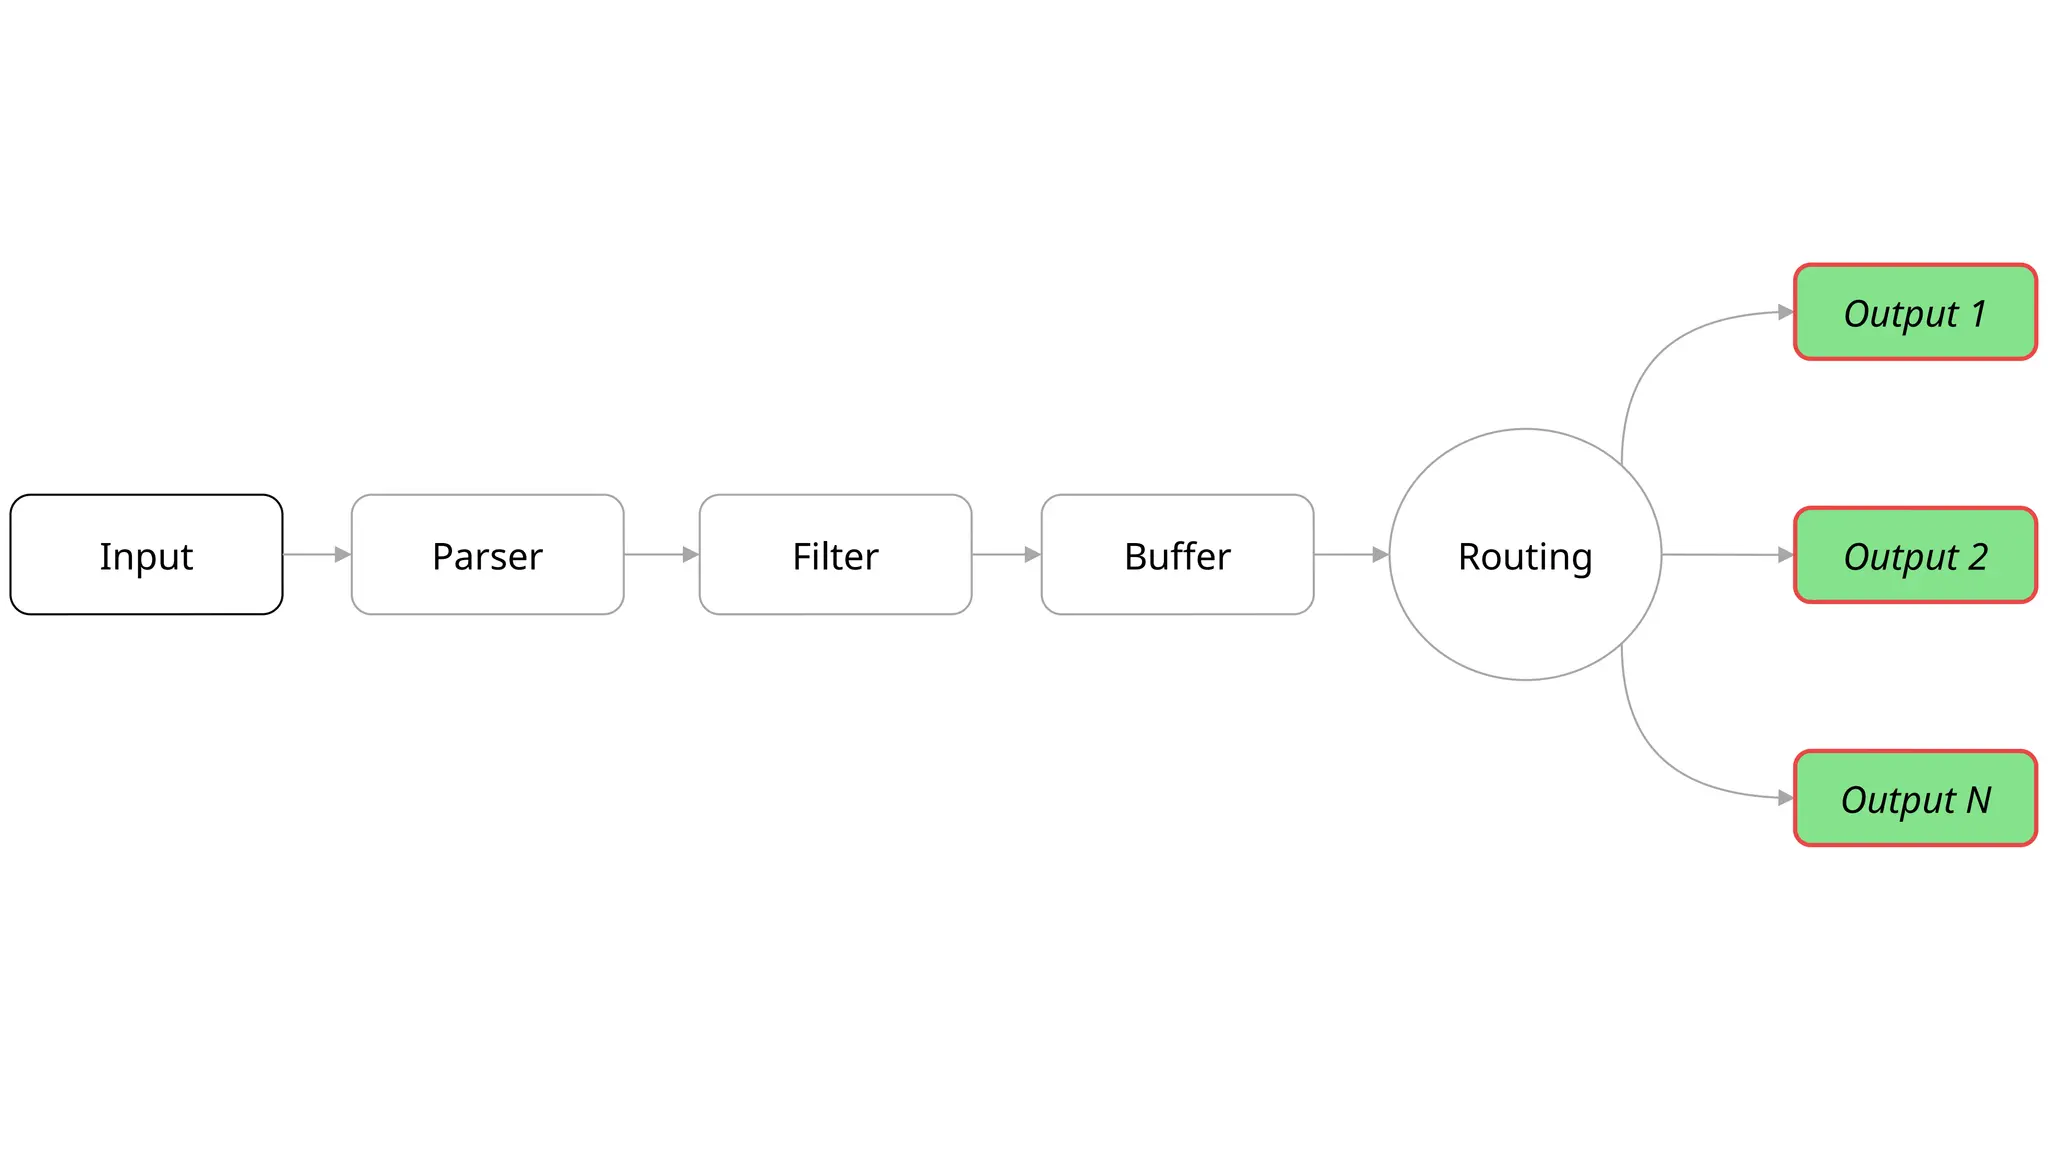

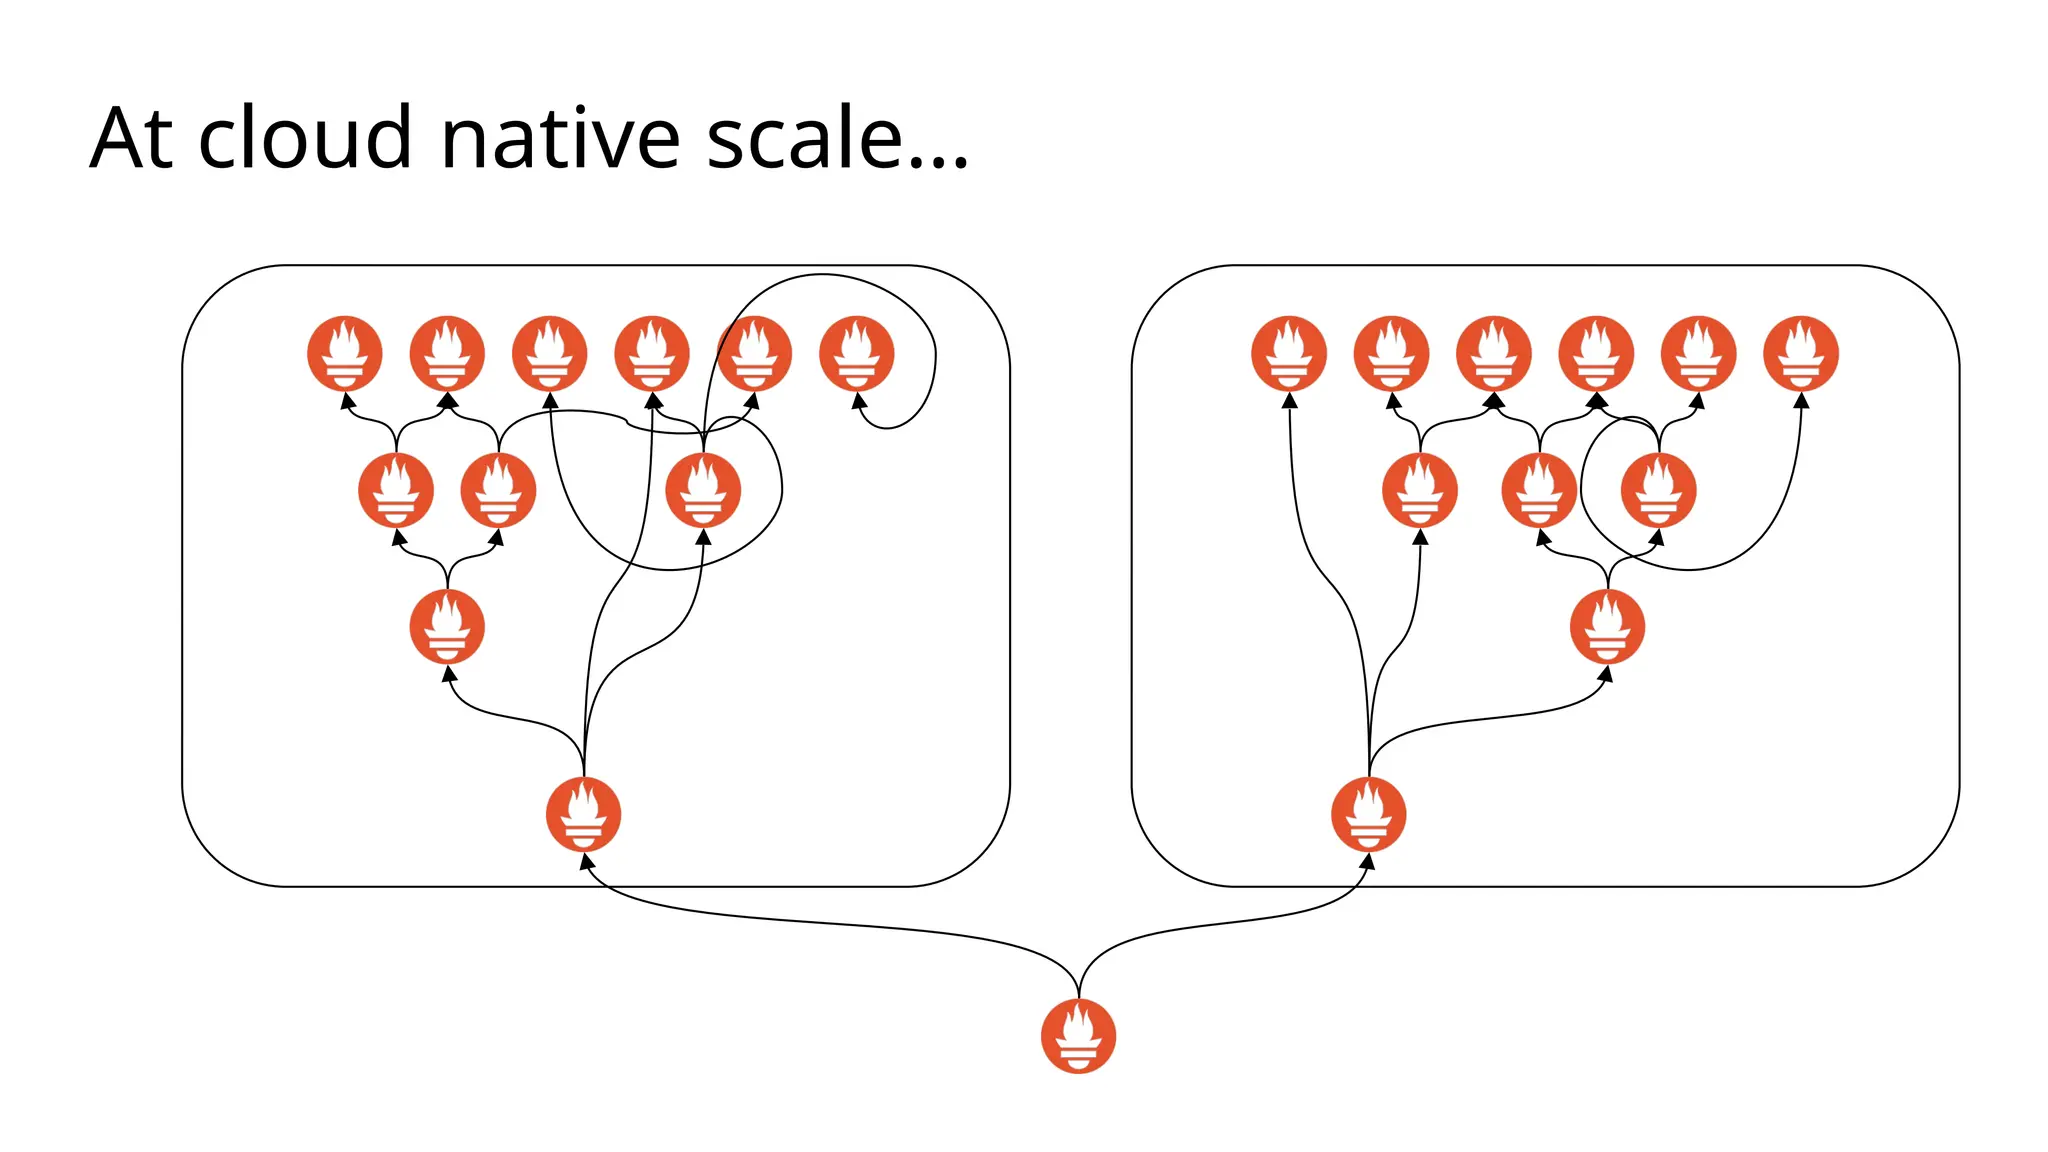
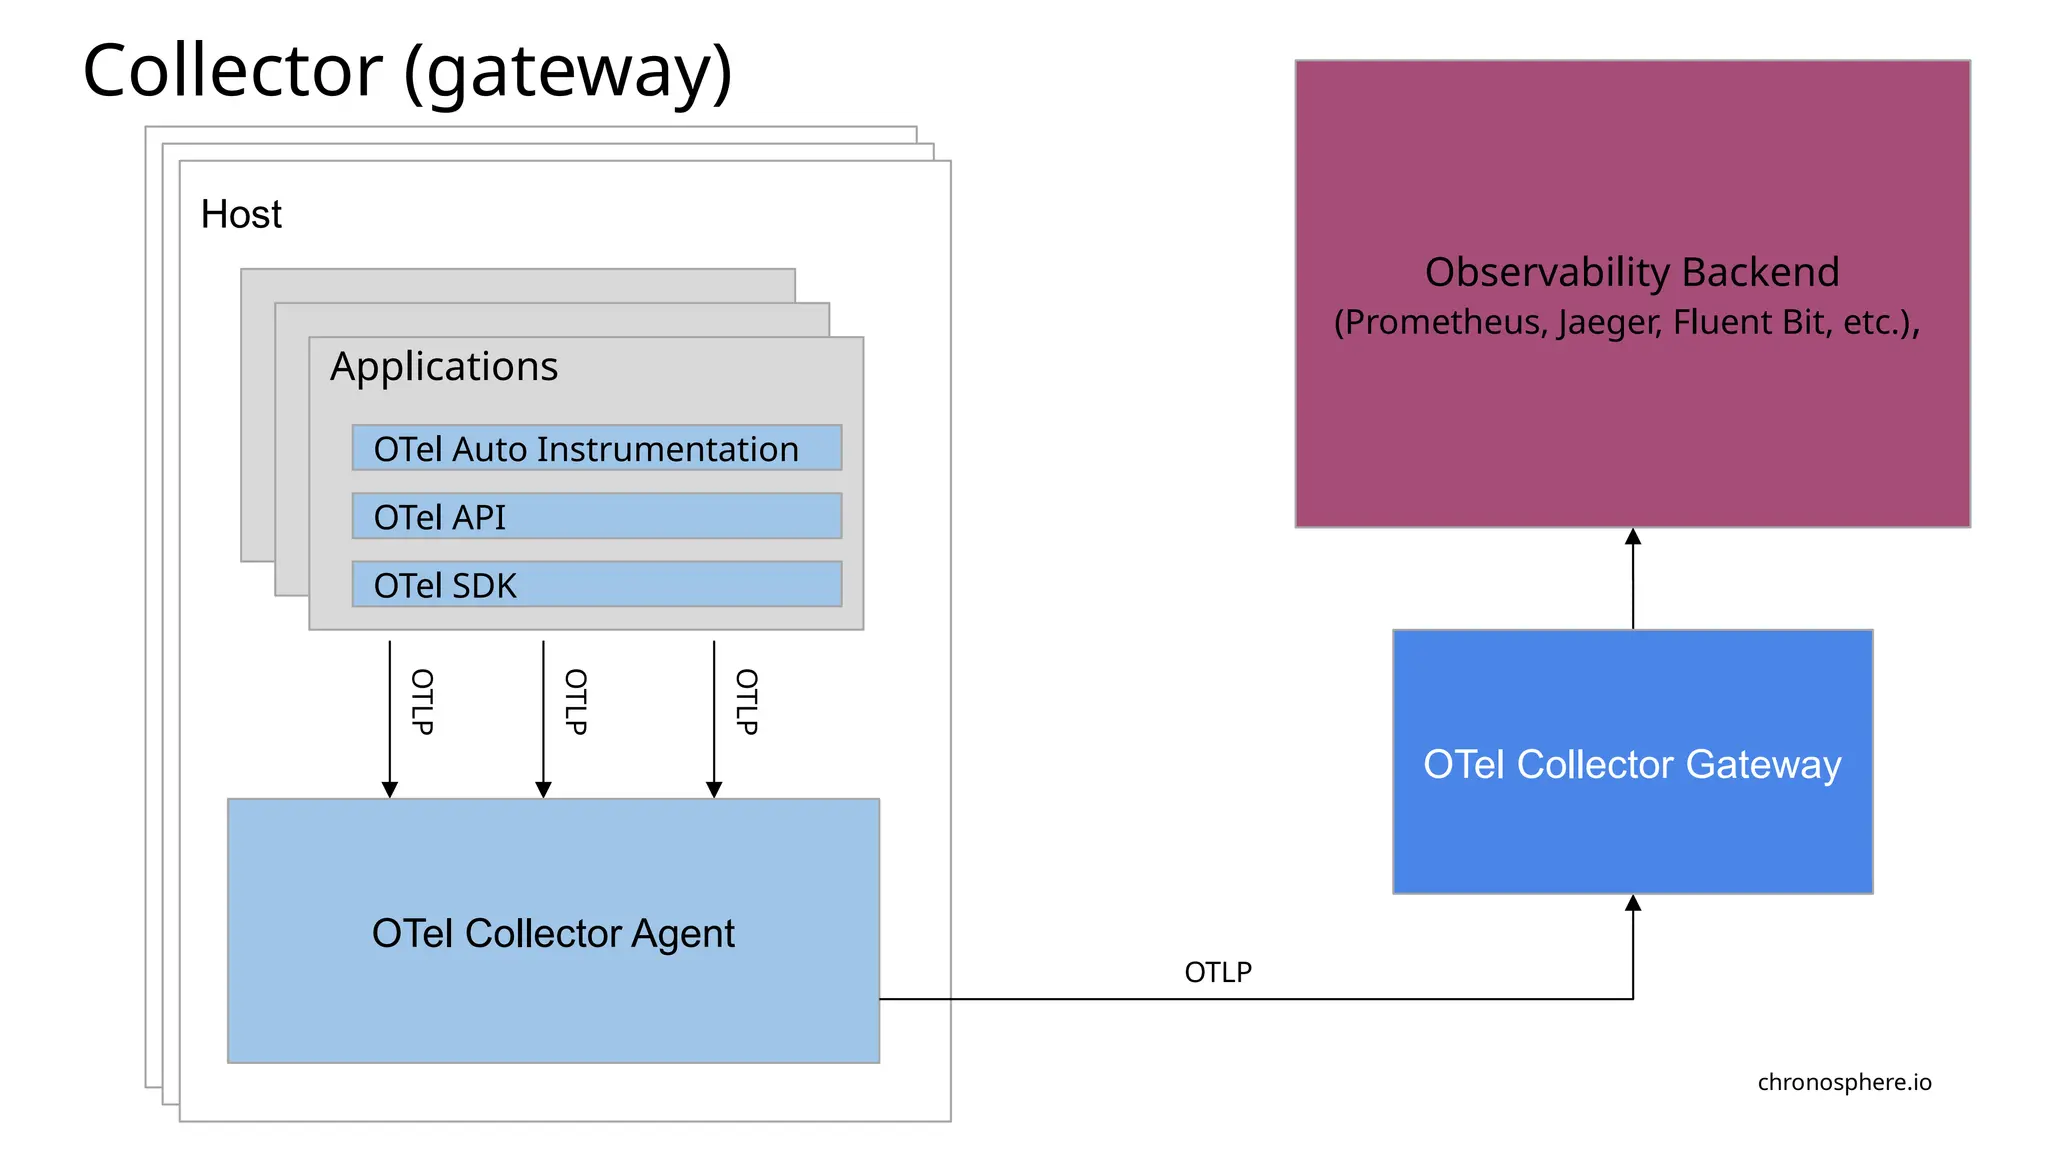
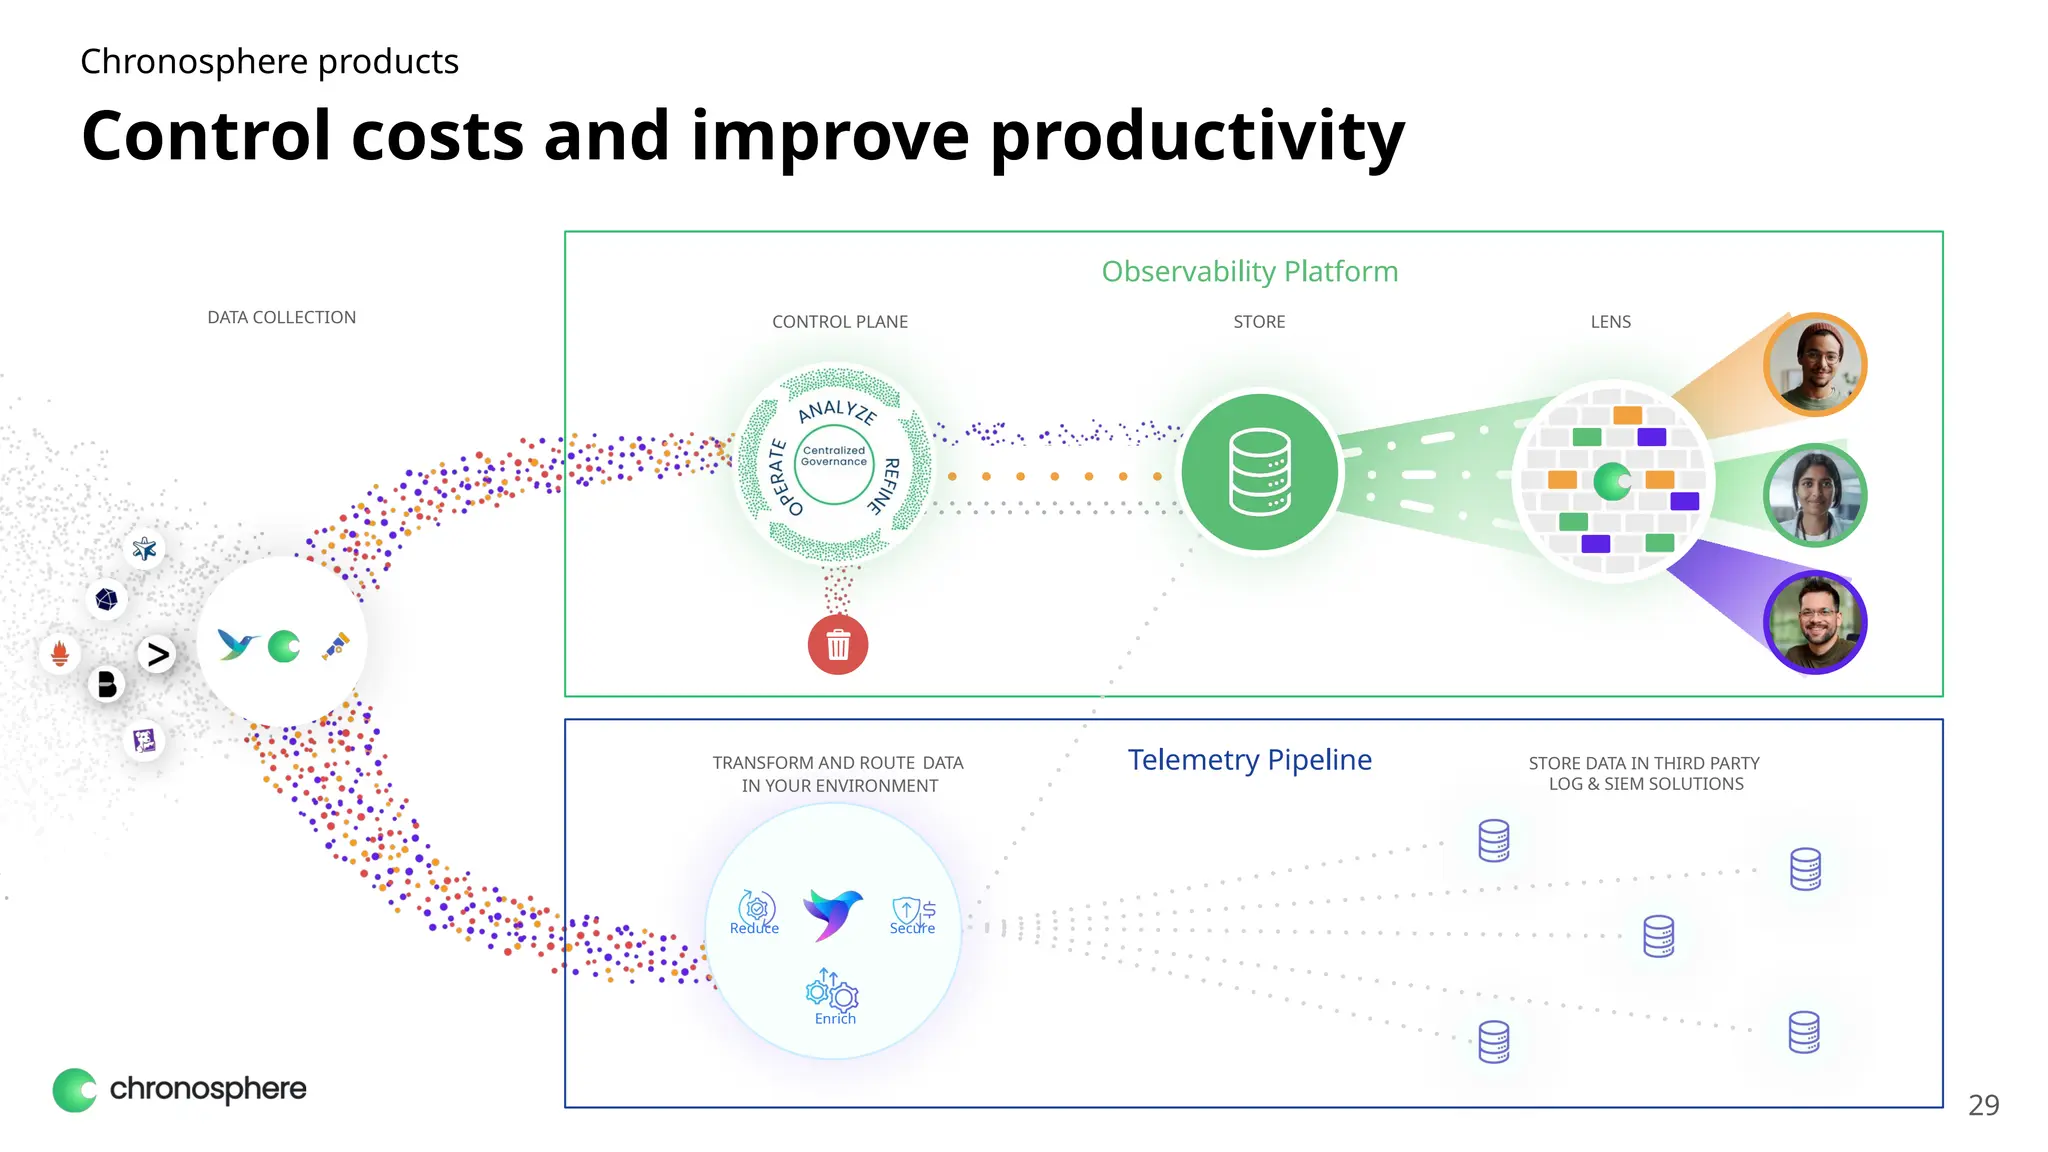

The document is a presentation by Eric D. Schabell from Chronosphere discussing automated cloud-native observability platforms and their integration with Prometheus for metrics, alerting, and querying. It outlines key components such as service discovery, telemetry pipelines, and auto-instrumentation using OpenTelemetry. The focus is on enhancing cloud-native observability to control costs and improve productivity in data management.


