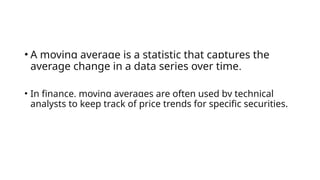
In finance, a moving average (MA) is a stock indicator commonly used in technical analysis. The reason for calculating the moving average of a stock is to help smooth out the price data by creating a constantly updated average price.
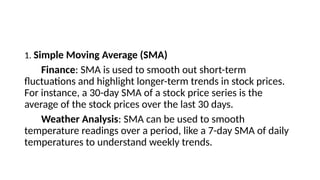
By calculating the moving average, the impacts of random, short-term fluctuations on the price of a stock over a specified time frame are mitigated. Simple moving averages (SMAs) use a simple arithmetic average of prices over some timespan, while exponential moving averages (EMAs) place greater weight on more recent prices than older ones over the time period.

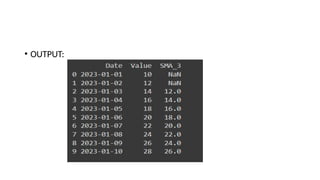
![Program:
import pandas as pd
data = {'Date': pd.date_range(start='2023-01-01',periods=10,freq='D'),
'Value': [10, 12, 14, 16, 18, 20, 22, 24, 26, 28]}
df = pd.DataFrame(data)
df['SMA_3'] = df['Value'].rolling(window=3).mean()
print(df)](https://image.slidesharecdn.com/movingaverages-250324101355-4bc28db3/85/moving-average-MA-is-a-stock-indicator-commonly-used-in-technical-analysis-8-320.jpg)