
More Related Content
Viewers also liked
Viewers also liked (16)
Recently uploaded
Recently uploaded (20)
Mountains 31.12
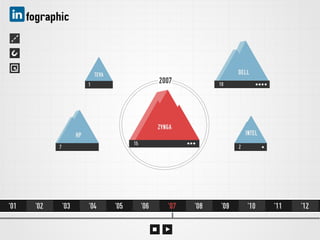
- 1. fographic TEVA DELL 1 2007 10 ZYNGA HP INTEL 15 7 2 '01 '02 '03 '04 '05 '06 '07 '08 '09 '10 '11 '12
- 2. fographic TEVA DELL 1 2007 10 ZYNGA HP INTEL 15 7 2 '01 '02 '03 '04 '05 '06 '07 '08 '09 '10 '11 '12
- 3. fographic TEVA DELL 1 2007 11 ZYNGA HP INTEL 14 7 2 '01 '02 '03 '04 '05 '06 '07 '08 '09 '10 '11 '12
- 4. fographic ZYNGA TEVA 1 2007 14 DELL HP INTEL 11 7 2 '01 '02 '03 '04 '05 '06 '07 '08 '09 '10 '11 '12
- 5. fographic ZYNGA TEVA 1 2007 14 DELL HP INTEL 11 7 2 '01 '02 '03 '04 '05 '06 '07 '08 '09 '10 '11 '12
- 6. fographic 11.2005 HP 7 04.2005 IBM INTEL ZYNGA DELL TEVA 15 1 2 14 11 '03 '04 '05 '06 '07 '08
- 7. fographic 11.2005 HP 7 04.2005 IBM INTEL ZYNGA DELL TEVA 15 1 2 14 11 '03 '04 '05 '06 '07 '08
- 8. fographic ZYNGA Nina Kok Damien Austin Madhusudan Valdespino Lankford Banerjee 2007 Er Amandeep Adie Gokel Siege Yady Quiroz Bongcayao INTEL ZYNGA DELL 2 14 11 Saad Kallah Rina-Louise Paula Natalie du Plessis Pemberton Levonian 2006 2008 Alicia Christina Gutierrez Bekkuzhynova