
Recommended
More Related Content
What's hot
What's hot (20)
Viewers also liked
Viewers also liked (17)
Similar to MLM Rate Survey 2016 Exec_Summary
Similar to MLM Rate Survey 2016 Exec_Summary (20)
MLM Rate Survey 2016 Exec_Summary
- 1. In this issue, we bring you our 26th Annual Rate Survey. This issue provides a continuing overview of changing rates for physicians’medical professional liabil- ity insurance. It is a snapshot in time, reporting rates effective July 1, 2016. It is a picture we paint state by state, county by county because where physi- cians practice largely determines the pre- miums they pay. This is because insurers base their rates on the aggregate claims experience in a particular geographic area. Because state insurance depart- ments may regulate rates, state tort reforms can affect the cost and patient compensation funds may influence the total premium, it is impossible to project a common national picture. Each year, we survey the major writers of liability insurance for physicians. We ask for manual rates for specific mature, claims-made specialties with limits of $1 million/$3 million—by far the most com- mon limits. These are the rates reported unless otherwise noted. We report on three specialties to reflect the wide range of rates charged: Internal Medicine, General Surgery and Obstetrics/Gynecology. With the exception of Medical Protective, Princeton, PLICO and Physicians’ Reciprocal Insurers, all rates shown were volunteered by their respec- tive companies. Those companies’ rates published herein were obtained through ANNUAL RATE SURVEY ISSUE RATE REPORT PRESENTS STATE-BY-STATE VIEW OF CHANGING MARKET OCTOBER 2016 VOL 41, NO 10 → CONTINUED ON PAGE 2 →CONTINUED ON PAGE 2 DO STILL WATERS STILL RUN DEEP? MEDICAL PROFESSIONAL LIABILITY IN 2016 by Paul Greve, JD, RPLU, and Alison Milford, ACAS, MAAA The medical professional liability insur- ance industry is continuing its unprece- dented run of consecutive profitable years in 2016. Never before has the industry wit- nessed such an unbroken string of annual favorable results, many of which were very favorable. If we apply the metaphor of sailing a ship to the medical professional liability industry, strong tailwinds and minimal waves have made for very smooth sailing during the past decade. But to be prudent, it’s smart to annually reexamine whether the weather is still favorable for safely sail- ing to profitability in MPL underwriting. Are there any storms on the horizon? THE NATIONAL ENVIRONMENT: SAFE HARBORS During the last decade or so, we’ve heard more than a few industry observers prog- nosticate that the party will soon be over: the hard market is coming. They’ve been dead wrong. The prognosticators’ thoughts were not without basis given the past hard-and-soft cycles the medical professional liability insurance industry experienced in the 1970s, 1980s and 1990s—with carryover into the first years of the 21st century. But there were, and are, many well-recognized factors that went in the medical liability industry’s favor during the first five years or so of the last decade. It would be a mistake to overlook them or minimize their continuing favorable effects. These factors include: • Successful medical liability tort reform laws enacted in many states. • Most of the medical liability tort reform laws enacted have been upheld by state courts—with a few notable exceptions. • Physician advocates—like the PIAA, American Medical Association, state med- ical societies and other tort reform champi- ons—have helped shift the American pub- lic’s perspective regarding medical malprac- tice litigation in the healthcare sector’s favor. Much of the advocacy of this type pointed to the link between healthcare access and medical professional liability costs. Today’s juries are much more likely to be sympathetic to the defendant physician than in years past. This attitude shift has resulted in a drop in claims frequency and fewer multi-million dollar jury verdicts. • The cost of funding malpractice litiga- tion became a barrier for the trial bar, which has also contributed to the decline in med- ical malpractice claims frequency. • Patient safety initiatives have improved care. A great example is obstetrics. Although fraught with potentially catastrophic risk, patient safety initiatives have effectively improved obstetric risk in both claim fre- quency and severity. • Claim frequency has remained at his- toric lows and demonstrates little-to-no evidence of a significant upward trend in the near future. Let’s examine each of these six points closer because they have been the anchors keeping the medical professional liability insurance industry in safe harbors and out of stormy waters. The first four points involve successful tort reform laws and a shift in the American public’s view toward medical malpractice lit- igation. This shows no signs of changing in the near term, nor does the significant cost to the trial bar when it comes to funding
- 2. 2 medical liability litigation. One can argue about the efficacy of patient safety initiatives, but the rapid pace of technological advancement in healthcare should ultimately help reduce patient injuries over time. Claim frequency has always been unpredictable, but if it were to turn upward, it’s likely that the rise in litigation would be more gradual than what the industry has witnessed historical- ly. There do not seem to be any factors on the horizon that would precipitate a large wave of medical liability claims. One point that should be carefully watched is the American public’s perspec- tive toward medical malpractice lawsuits. Consolidation in the healthcare industry, characterized by the purchase of commu- nity hospitals by large systems and the employment of physicians, could result in a change in the overall perception of hos- pitals and physicians. These larger systems face the risk of being viewed as profit-driv- en to the exclusion of all else. All types of healthcare providers are pursuing aggressive collection policies as health insurance programs push off more and more cost on to insureds in the form of deductibles and co-payments. Will this erode the public’s good will to hospitals and physicians? These six factors, as well as others, bode well for the future. One thing that must be kept in mind is that past medical professional liability industry cycles with very poor results were driven by claim activity, especially claim frequency. Today there are far fewer claims, but verdict and settlement valuations are higher in those claims that are paid. Still, it’s difficult, but not impossible, to imagine a scenario where claim frequency remains relatively low, yet claim severity alone dramatically drives up medical professional liability insurance premiums unless we see a notable increase in the frequency of sever- ity. Increasing severity would cause rates and premiums to rise, but it’s unlikely we would witness the size of premium increases that characterized hard markets some 15 to 20 years ago. HOSPITAL CONSOLIDATION Consolidation of the hospital industry via mergers and acquisitions has continued unabated into 2016, leading to the cre- ation of many large healthcare systems comprised of multiple facilities. Generally speaking, the larger the organization, the greater their self-insured retention. Many hospital systems retain the first $3 million to upward of $20-mil- lion-or-more of individual medical liability claims. These large healthcare systems often own a captive insurance company, and if it has been in existence for more than a few years, it has likely benefited sig- nificantly from favorable claim trends and thus is well capitalized. If excess hospital insurers/reinsurers were to attempt to pass along significant Subscriptions: Annual subscription rate $399, which includes monthly issues and the Annual Rate Survey. Subscriptions are available at www.mlmonitor.com or by calling 312-944-7900. © 2016 Medical Liability Monitor, Inc. Published monthly. May not be reproduced in whole or part without permission. JAMES H. CUNNINGHAM Publisher MICHAEL MATRAY Editor HERB JONES Circulation Manager P.O. Box 680 Oak Park, IL 60303 312-944-7900 Fax: 312-944-8845 e-mail: editor@mlmonitor.com website: www.mlmonitor.com Twitter: @MedMalMonitor MEDICAL LIABILITY MONITOR OCTOBER 2016 VOL 41, NO 10 →CONTINUED FROM COVER independent research and are believed to be accurate. The rates reported should not be interpreted as the actual premiums an individual physician pays for coverage. They do not reflect credits, debits, divi- dends or other factors that may reduce or increase premiums. Rates reported also do not include other underwriting factors that can increase premiums. States without compensation funds, by far the largest group, are reported first. Patient compensation fund states are grouped at the end of the survey. In patient compensation fund states, physicians pay surcharges that range from a modest percentage to more than the base premium. Also, limits of cover- age can differ in these states, which is noted with each PCF state. When we contact survey participants, we ask them to provide data on all the states in which they actively market to physicians. We only report rates for com- panies that maintain filed and approved rates for each state in which they sell medical professional liability insurance. We try to capture the leading, active writ- ers in each state, but every writer may not be included. In comparing this year’s report with previous reports, it is evident that the market is always changing. Many compa- nies formerly included no longer sell physicians’ malpractice insurance in cer- tain states, do not currently entertain new business, have withdrawn from this line of insurance or no longer exist. The com- panies shown were available for business as of July 1, 2016. We estimate that this survey repre- sents companies that comprise 65 to 75 percent of the market; as such, it is the most comprehensive report on medical professional liability rates available. The expanded rate report could not have been completed without the coop- eration of the many people who work in the companies surveyed. Their coopera- tion is invaluable in providing this infor- mation to all who have an interest in medical professional liability. →CONTINUED FROM COVER
- 3. rate increases, however justified, these large highly self-insured health- care entities would likely react by simply raising their retentions or per- haps not purchasing any excess medical liability insurance/reinsur- ance.Thus, the industry has much less leverage to raise premiums than it has had in the past with these types of large buyers. PHYSICIAN EMPLOYMENT AND LARGE GROUPS The employment of physicians by hospitals has been a notable trend since passage of the Patient Protection & Affordable Care Act of 2010, but there has been a marked deceleration in that trend recently, with the exception of primary care. This varies by regional market. Oneothertrendofnoteistheformationofmulti-specialtyphysician groups that want to remain independent of large health- care systems. Many physicians don’t want to become hospital employees, but don’t want to face the high overhead and hassle of running a private practice alone. Large multi- specialty physician groups help in addressing those issues and give them signifi- cant purchasing power, including when it comes to medical professional liability insurance. A number of large groups have formed risk retention groups and captive insurance companies, which is taking even more premium dollars out of the commercial market. SIGNIFICANT OBSERVATIONS FROM ANNUAL RATE SURVEY RESULTS In contrast to a significantly changing healthcare delivery system and medical professional liability insurance purchasing population, the MPL marketplace observed a fairly storm-free year with no real sen- tinel events or actions that would signal poor sailing conditions or dis- rupt the apparent slow migration from a competitive, yet profitable, marketplace to one that turns the corner on one or both fronts. According to the 2016 MEDICAL LIABILITY MONITOR Annual Rate Survey, marketplace participants look to effectively compete, but maintain underwriting and pricing discipline, which can be seen in the overt actions taken (or, perhaps, more accurately stated, not taken) on filed rates and the responses provided. • Respondents are expanding into new jurisdictions, broadening product offerings in current and new jurisdictions, deepening the coverage and benefits provided to their historic core insured base as well as pushing to sell bundled and unbundled non-risk bearing serv- ices as a means to be relevant and responsive to an evolving insured base. Many of these are not new or novel activities. However, the emphasis on and significance of these activities has increased. • From a competitive standpoint, only 23 percent of respondents registered concerns about underwriting guidelines used by competi- tors in the 2016 survey, down significantly from 2015 results of 52 per- cent and more in line with 2014 results. A lower result would be con- sistent with a more disciplined marketplace. • A small portion (15 percent) of respondents have increased their use of schedule credits in the past year (down from 29 percent in 2015), but several respondents (14 percent) have introduced new credits (up from zero in 2015). • Interestingly, just under 80 percent of respondents indicated that the market is neither becoming harder or softer, but staying about the same. A little more than 20 percent of respondents believe the market is getting softer (down from 43 percent in 2015). • Respondents continue to observe that frequency is generally flat, with only 8 percent observing a decrease and the same percentage observing an increase this year. • Close to one third (31 percent) of respondents stated that rein- surance costs have decreased in the past one or two years (down from 43 percent in 2015). Similar to last year, only one respondent indicat- ed that reinsurance costs have increased during the last two years. Most respondents see reinsurance costs remaining flat. • All of the respondents expect to continue to see consolidation within the medical professional liability marketplace. Case in point, the recent announcement by Medical Liability Mutual Insurance Co. (MLMIC) that it has entered into a definitive agreement to be acquired by National Indemnity Co., a sub- sidiary of Berkshire Hathaway (See MLM, August 2016). THE NATIONAL ENVIRONMENT: POTENTIAL STORMY WATERS Following are some of the waves that could make for rougher sailing for the medical professional liability insurance indus- try in the years ahead. Large Verdicts/Settlements. Many insurers report an increase in large verdicts and settlements, whether within the $1 million to $5 million layer or above that. And there have been an increasing num- ber of jumbo verdicts in recent years, but those verdicts comprise only a fraction of 1 percent of all verdicts and settlements. To date, this rise has been actuarially predictable, unlike it was in the late 1990s. Because medical liability litigation is so expensive (usually in the six figures) for the trial bar to fund, they have been forced to be more selective in pursuing litigation. The medical liability claims that are being filed often are more volatile and have a high verdict/settle- ment potential. The bottom line is that claim severity across the industry must be carefully monitored. Past crises were driven by claim activity—both frequency and severity. With claim frequency low, and seemingly sta- ble, only claim severity could drive a crisis in the near term. Claim severity has not impacted pricing to date. Fewer Hospital and Physician Buyers. A continuing source of downward pressure on medical professional liability insurance rates has been the steady decline in demand for coverage. This can be attributed to consolidation in the healthcare industry as well as an increased use of captives and risk retention groups in recent years. Consolidation continues unabated in the hospital industry and shows no signs of slowing. Although the race to purchase physician practices has slowed markedly for specialty practices, such acquisitions continue, varying by region. Primary care physicians are highly recruit- ed for hospital employment and will continue to be. A factor support- ing the growth of the hospital employment model is that new-to-prac- tice physicians seem more willing to enter employment with the grow- ing hospital systems, trading independent practice and associated issues for a more predictable work environment and income. The insurance market for both segments is already overcrowded, and new entrants have appeared in the last three years, while many 3 MEDICAL LIABILITY MONITOR OCTOBER 2016 VOL 41, NO 10 Claim frequency has always been unpredictable, but if it were to turn upward, it’s likely that the rise in litigation would be more gradual than what the industry has witnessed historically. There do not seem to be any factors on the horizon that would precipitate a large wave of medical liability claims.
- 4. MEDICAL LIABILITY MONITOR OCTOBER 2016 VOL 41, NO 10 4 traditional carriers have sought to expand into these segments. There is concern that the fierce competition has caused premiums to drop below what can support profitability. However, while there are many anecdotal examples supporting the position that business is being written below profitable levels, aggregated data is less con- clusive that this is the case on a broader basis and less likely to prompt actions given current marketplace circumstances. The potential prelude to stormy waters here is that the anecdotes are becoming the norm, rather than the exception, and the aggregat- ed data is lagging in recognition of this change. Increasing ALAE. In contrast to the moderate-to-low trends observed on indemnity severities, the defense cost severity, fre- quently referred to as ALAE (allocated loss adjustment expense, now “defense and cost containment expense” in statutory reporting ter- minology), has been increasing at a higher rate. This increasing pres- sure has not prompted rate action because of all the other favorable claim trends, which are having a significant effect, but the increased ALAE costs are not lost on insurers who have focused attention on it. There are a number of contributing factors. Certainly, general infla- tionary pressures apply to the rates charged by attorneys, their staff, expert witnesses and other court- related services. Additionally, many insurers have observed law firms“working cases harder”given the lower volume of claims and, in the case of expert witnesses, many insurers have noted sharp increas- es in fees charged, well above inflationary pressures. All of these put upward pressure on ALAE severity levels. Insurers have taken steps to mitigate increasing costs where possible. These include develop- ment of case research data banks tobesharedamongtheirlawfirmstoavoidduplicativework,moreeco- nomic procedures for taking depositions and other court-related servic- es as well as enhanced monitoring tools of legal spend, among others. For insurers, management of ALAE spend is a balancing act of maintaining a motivated and knowledgeable defense team as well as minimizing the increasing ALAE cost pressures. ALAE increases can contribute to the stormy waters if insurers are not able to achieve that balance. Reserve Development. Favorable reserve development during the last 10 years has played a significant role in the period of prof- itability observed in the MPL line of business. This run of favorable aggregated industry reserve development began in 2005 after a five-year period of unfavorable development. It occurred on the heels of significant broad-based increases in medical professional liability insurance rates and high-profile debates about the linkage among access to healthcare, increases in MPL loss costs/rates and tort reforms—with many states, consequently, implementing reforms beginning primarily in the 2003 to 2005 time period (for example, Florida, Georgia, Illinois and Ohio, among others). These changes, combined with the difficult-to-measure impacts of patient safety/risk management, the high cost to bring medical professional liability claims and a chill of the credit needed to finance claims due to the financial crisis later on in the decade, led to lower actual loss costs than expected. Insurers recognized the effects of these phenomena cautiously over time out of concern for the uncertainty of how the reforms to tort law would impact liabili- ty given the time it takes to sort out in the loss experience. The shelf life of these tort law changes were also a concern as many are/have been subject to judicial review. However, as time has passed, the storm clouds are beginning to assemble as the new lower-cost environment establishes itself as the norm, even after the effects of the overturn of some reforms passed earlier in the decade. From the standpoint of reserve devel- opment, the assembling clouds manifest themselves as a fairly steadily declining premium volume and its impact on favorable reserve development. During the last 10 years, favorable reserve development has ben- efited otherwise indicated industry calendar-year loss ratios by more than 27 points in some years. However, that benefit has declined to nearly 20 points in 2015 based on A.M. Best summarized results. As discussed below, this begs the question as to whether the medical professional liability insurance industry will continue the unprecedented string of calendar-year underwriting profitability reflected during the last 10 years. Although some would point out that favorable development is likely to continue (note that A.M. Best’s May 2016 Special Report on U.S. MPL suggests a redundancy of about $2.4 billion at Dec. 31, 2015, down about $0.4 billion rel- ative to Dec. 31, 2014), is it enough to offset the current cov- erage-year loss results discussed below? Calendar Year vs. Accident (Coverage) Year Combined Ratio. Most individuals interest- ed in MPL financial results have marveled at the years of consecu- tive profitability recorded by the coverage. But even more unex- pected has been the fact that these results are contributed to con- sistently by calendar-year underwriting profitability. That fact might be unexpected because, during the approximately 40 years MPL has been reported as a separate line of business, there have been only 13 years reflecting a calendar-year combined ratio under 100 per- cent. Ten of those 13 have been the last 10 years. This consistent profitability and level of the calendar-year combined ratio is due, in no small part, to the favorable reserve development discussed above. These results can be seen in the graph (see Exhibit 1: MPL Combined Ratios, on page 5) detailing the “Original Calendar-Year Combined Ratio” as compiled by A.M. Best. Also observable is the fairly consistent increase caused, in part, by a declining favorable reserve development benefit. However, a second way to evaluate underwriting profitability is on an accident-year (or coverage-year, considering claims-made and tail coverage) basis.This is obtained by using the estimate of the cur- rent accident-year loss ratio rather than the calendar-year loss ratio (i.e., eliminate the impact of prior-year reserve development). This perspective provides better insight into current underwriting prof- itability (i.e., how adequate is current collected premium to cover current coverage-year losses and operating costs, subject to devel- opment of the current coverage-year losses). That is the second line shown on the graph (see Exhibit 1: MPL Combined Ratios, on page 5) detailing “Original Accident-year Combined Ratio.” Setting aside the dip of the calendar-year combined ratio in the early years, both lines In contrast to the moderate-to-low trends observed on indemnity severities, the defense cost severity, frequently referred to as ALAE, has been increasing at a higher rate. This increasing pressure has not prompted rate action because of all the other favorable claim trends.
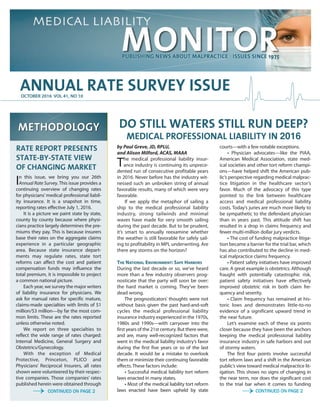
- 5. MEDICAL LIABILITY MONITOR OCTOBER 2016 VOL 41, NO 10 5 show a fairly slow, steady increase over time, but with the accident- year-based combined ratio showing more flattening during the last few years. However, for the accident- year-based combined ratio, that flattening is at a level between 115 percent and 120 percent—not near underwriting profitability territory. Some would argue that is not surprising as the pricing market- place has, largely, adjusted to new cost levels, including consideration of the loss of some of the reforms implemented. Even further, some might say the marketplace has crossed the line to levels that threat- en overall profitability. Others would argue that, while the gap between the two lines reflecting the reported favorable one-year devel- opment has narrowed, as noted above, the gap is not closed if the A.M. Best estimates are good. However, in our sailing analogy, these circumstances suggest deteri- orating weather ahead and rougher sailing when it arrives. SO WHAT DOES THE SURVEY SAY ABOUT RATES? Last year, the Annual Rate Survey indicated a slight increase in rates for the first time in eight years. While not materially different than last year’s average increase, the average rate change in the 2016 Annual Rate Survey is a decrease of 0.1-percent. For the vast majority (75 percent) of insurers in the survey, rates have remained flat between 2015 and 2016, slightly higher than the percentage with no manual change shown in 2015 (71 percent). Of note is the distortion created by the Patient Compensation Fund (PCF) states. In most cases, the PCFs are quasi-governmental entities, operate under different rules than primary carriers, are often subject to varying degrees of legislative/Insurance Department oversight and are less susceptible to marketplace deci- sions and discretion. Typically, the PCF charge is collected by the pri- mary carrier based on rates established by the PCF, often referred to as surcharges. In 2016, and to some degree in 2015, the PCF surcharges have been impacted by unusual events. For example, the Mcare fund in Pennsylvania reflected decreased surcharges by about 50 percent in last year’s survey, but an approximate 40 percent increase in this year’s survey (related to adjustments called for in a settlement of lit- igation). Primary carrier rates in Pennsylvania did not change in this survey (although an additional carrier is reporting). Besides Pennsylvania, this year’s survey reports changes for the PCF surcharges in Indiana (increase), Louisiana (decrease) and Nebraska (increase). Eliminating the distortion created by the PCF surcharge changes causes the 75-percent no-change percentage mentioned above to increase to 82 percent, reduces the percent- ages reflecting increases (15 percent becomes 10 percent) and slightly reduces the percentage of decreases (9.4 percent becomes 8.6 percent). Each of the three specialties surveyed saw very slight decreases in manual rates (0.2 percent, 0.0 percent and 0.1 percent, respective- ly). The change for General Surgery is very slightly negative, but rounds to a zero change. In last year’s 2015 Annual Rate Survey, insurers reported more rate increases than decreases for the first time since 2006. This trend con- tinues in the 2016 survey. The differential is slightly wider with 15 percent reporting increases and 9 percent reporting decreases. Double-digit rate decreases are nonexistent this year. Only three states are reporting decreases of more than 5 percent: Arizona, Colorado and Louisiana. Other than Louisiana, the decreases appear to generally stem from companies that are not the dominant writer in the state. For Louisiana, the decrease is primarily due to a change in the PCF surcharge partially offset by an increase in the base rate. For the twelfth-straight year, most increases were less than 10 percent (14 of the 15 percent increasing). Roughly 1 percent of rate increases exceeded 10 percent, compared to a more than 5 percent of rate increases in excess of 10 percent a year ago. Similarly, 4 percent of last year’s rate increases exceeded 15 per- cent, whereas this year only one-half-of-1-percent of rate changes fell in this range. Regionally, the Northeast and the Midwest are showing overall average rate increases, albeit very slight increases of 0.8 percent and 0.3 percent, respectively. The increase for the Northeast is driven by a significant increase in the Pennsylvania PCF surcharge resulting in Pennsylvania rates increasing roughly 4 percent as well as a modest increase in Rhode Island. Decreases in Connecticut and Maine par- tially offset the increases in Pennsylvania and Rhode Island. Other Northeast states are holding the line. The increase for the Midwest is also partially driven by increases to the PCF surcharges in Indiana and Nebraska. There was a modest increase for Illinois. The increases are almost offset by the slight !"#$%$&'()*+,-$./0'123 0.0% 20.0% 40.0% 60.0% 80.0% 100.0% 120.0% 140.0% 160.0% 2006 2007 2008 2009 2010 2011 2012 2013 2014 2015 Coverage Year Original Accident Year Combined Ratio Original Calendar Year Combined Ratio !"#$#%&'()%$*+%,-%./01%23'45*6%7'389)%8:%;2%$'<54*6%=98>'((58:*6%?5*@565)+% ! $ $ % % % % % % % % % % ()'&%$#" $ $ % % % % % % % % % % /.-,+*()$ $ % % % % % % % % % % 231'0/$ $ % % % % % % % % % % $ $ % % % % % % % % % % $ $ % % % % % % % % % % $ $ % % % % % % % % % % 120.0% 140.0% 160.0% $ $ % % % % % % % % % % $ $ % % % % % % % % % % $ $ % % % % % % % % % % $ $ % % % % % % % % % % $ $ % % % % % % % % % % $ $ % % % % % % % % % % $ $ % % % % % % % % % % 40.0% 60.0% 80.0% 100.0% $ $ % % % % % % % % % % $ $ % % % % % % % % % % $ $ % % % % % % % % % % $ $ % % % % % % % % % % $ $ % % % % % % % % % % $ $ % % % % % % % % % % $ $ % % % % % % % % % % 0.0% 20.0% 40.0% $ $ % % % % % % % % % % 2006 2007 $ $ % % % % % % % % % % 2008 2009 $ $ % % % % % % % % % % 2010 1201 raeYYeegraveoC $ $ % % % % % % % % % % 2012 2013 2014 $ $ % % % % % % % % % % 2014 2015 $ $ % % % % % % % % % % $ $ % % % % % % % % % % $ $ % % % % % % % % % % tnedAccilanigriO '3210/.-,$*+)%('&$##!" $ $ % % % % % % % % % % aRdenimboCraeYYet (('>89=*645<$'2;:8)%9837'*654 $ $ % % % % % % % % % % oita aClanigriO )+565*@5?*6:85 $ $ % % % % % % % % % % imboCraeYYeradnela $ $ % % % % % % % % % % oitaRden $ $ % % % % % % % % % % MPL Combined Ratios * Exhibit 1 * A.M. Best May 9, 2016, Special Report on U.S. Medical Professional Liability Year
- 6. decreases for Kansas and Michigan. The remainder of the Midwest states are flat. The South and West regions both show average decreases of less than 1 percent—0.7 percent and 0.5 percent, respectively. In the South, three states show slight average rate increases, while five states show decreases. Georgia, Kentucky and South Carolina reflect increases of 0.3 percent, 2.5 percent and 0.4 percent, respectively. Florida, Louisiana, North Carolina, Oklahoma and Texas reflect decreases of 3.7 percent, 6.7 percent, 3.1 percent, 1.3 percent and 0.5 percent, respectively. As noted previously, the decrease in Louisiana is driven by a decrease in the PCF surcharge partially off- set by an increase in the base rate. The remaining states in the South have not changed manual rates. In the West, there are two states with overall average increases. California is showing an average manual rate increase of 2.4 percent, driven by an increase of just under 10 percent for one of the domi- nant writers in the state. The average increase in Washington is just under 1 percent, driven by a slight change from one player in that market. There are implied average decreasing manual rates in four states in the West region. Arizona, Colorado, Idaho and Wyoming show decreases of 8.6 percent, 6.3 percent, 1.8 percent and 2.7 percent, respectively. In Arizona, the decrease is partially due to the domi- nant carrier decreasing rates close to 3 percent, but a smaller player in the Arizona market is significantly decreasing its rates for the General Surgery and OB/Gyn specialties. Similarly in Colorado, the dominant carrier is holding rates flat, while some of the other com- panies writing in the state are decreasing rates. The decrease in Idaho is driven by a newer player with one of the more established companies in the market increasing rates slightly. The change in Wyoming is due to one carrier. The remaining states in the West region have not changed manual rates since 2015. HEALTHCARE REFORM: SCANNING THE HORIZON Due, in part, to the long-tail nature of medical professional liability claims, healthcare reform has had little to no impact on claims to date. But changes wrought by the Affordable Care Act will shape malpractice risk and underwriter response as many healthcare organizations manage the implementation of healthcare reform, shift to value-based reimbursement and clinically integrate their organizations. Physician and hospital underwriting concerns regarding health- care reform are focused on: • A much higher volume of patients receiving primary and emer- gency care. • More patient handoffs, as care will need to be better coordinat- ed along a continuum of providers and facilities, which carry the potential for allegations of“you dropped the ball”in claim scenarios. • Allegations that appropriate care was not provided in order to maximize value-based payment. • An increased use of telemedicine. • A greater sophistication in the application of technology for patient care, including the use of electronic medical records. • Increased use of joint ventures, partnerships and contractual networks—accountable care organizations (ACOs), clinically inte- grated networks (CINs) and clinically integrated organizations (CIOs)—as less-expensive alternatives or adjuncts to mergers and acquisitions. This creates the potential for contractual liability and ostensible agency. The shift from fee-for-service reimbursement to value-based reimbursement, which the Affordable Care Act strongly encourages, is occurring slowly, but will accelerate in the next one to three years. OTHER MPL MARKET SEGMENTS We commented briefly for the first time on other medical profes- sional liability market segments in addition to physicians and sur- geons/ groups last year. This makes eminent sense as most physi- cian-focused carriers have expanded their coverages to include such additional market segments as acute care hospitals/health systems, long term care facilities, miscellaneous facilities (defined as any healthcare organization that is not acute or long-term care) and managed care organizations/health plans. Many medical profes- sional liability insurers have the policy forms and filings to under- write these classes of business with the potential to regain some of the premium lost due to fewer hospitals and private practice physicians/groups. H o s p i t a l s / H e a l t h Systems. The number of buyers in this segment has shrunk significantly due to consolidation through merg- ers and acquisitions. The hos- pital segment continues to be very competitive, and recent marketplace entrants in 2015 and 2016 have fur- thered that trend. Traditional physician insurers have also greatly expanded their facili- ty underwriting capabilities in recent years, partly by hir- ing experienced staff from traditional hospital insurers, and have been gaining mar- ket share—especially for excess liability coverage. The MEDICAL LIABILITY MONITOR OCTOBER 2016 VOL 41, NO 10 6 Range 2006 2007 2008 2009 2010 2011 2012 2013 2014 2015 2016 2016* > +100% 0.0% 0.6% 0.0% 0.0% 0.0% 0.0% 0.0% 0.0% 0.0% 0.0% 0.0% 0.0% +70.0 to +99% 0.0 0.6 0.0 0.1 0.0 0.0 0.0 0.0 0.0 0.0 0.0 0.0 +50.0 to +69.9% 0.0 0.4 0.0 0.1 0.0 0.0 0.0 0.0 0.0 0.0 0.0 0.0 +25.0 to +49.9% 2.3 0.5 0.6 0.0 0.0 0.3 0.1 0.3 0.0 0.2 0.1 0.1 +10.0 to +24.9% 5.6 5.9 1.2 1.9 0.8 4.8 0.2 2.4 0.1 5.5 0.9 0.9 +0.1 to +9.9% 22.6 8.2 5.6 5.7 13.4 9.4 14.8 11.0 12.1 11.4 14.5 8.6 0.0% 46.6 53.1 49.9 54.2 67.0 55.1 59.2 57.6 65.0 71.1 75.2 81.9 -9.9 to -0.1% 15.1 21.0 20.8 22.1 14.9 27.8 15.7 17.2 16.9 9.5 5.0 4.6 -19.9 to -10.0% 5.1 6.5 15.6 12.0 3.6 2.2 7.9 7.8 2.2 1.1 4.2 3.8 -29.9 to -20.0% 1.3 2.3 5.2 3.7 0.3 0.2 2.0 2.6 1.1 0.9 0.1 0.1 < -30.0% 1.4 0.0 1.1 0.2 0.0 0.1 0.1 1.2 2.6 0.3 0.2 0.1 "#$%&'(#)!*+,-%.!/0!%1-23#!*2!456!)'7%1-73#)! Overall Average Rate Change by Range Exhibit 2
- 7. fierce competition in this segment has helped keep pricing low for hospital buyers. The hospital segment should remain soft—with a range of flat to low double-digit decreases at typical renewals depending on loss experience, exposures and territory—through the end of 2016 and into 2017. Long Term Care. Long term care is the one segment of medical professional liability that has firmed slightly in recent years, although it remains competitive. This is, in part, because of several new market entrants. Pricing depends on the individual jurisdiction. In some states and regions, renewals are notably higher than the typical flat-to-5-percent increases, largely due to recent mega ver- dicts. A few markets have withdrawn from long term care as a con- sequence. Accounts with less-than-average loss experience are also experiencing notable renewal increases. Miscellaneous Facilities. This segment of medical professional liability—comprised of organiza- tions that provide healthcare, but are not acute care or long term care facilities (e.g., ASCs, community health clinics, urgent care centers, dialysis, hospice, labs, imaging facilities, home health, etc.)—is growing and very competitive. Competition has been driven in large part by abundant capacity. Healthcare reform has spurred the growth of such facilities, since they often provide less-expensive, but still-high-quality, care. Managed Care Organizations/Health Plans. This segment of medical professional liability has also remained stable and competi- tive, growing slightly in recent years primarily due to the Affordable Care Act. Renewals have seen flat to slight increases and are based on exposures and revenue. There are far fewer underwriters for both the primary and excess layers than there are in other segments. The increase in demand for medical liability as well as errors-and-omis- sions coverage underwritten by this segment has been driven by the proliferation of ACOs, CINs and CIOs. Allied Health Professionals. The allied health professions are thriving due to the Affordable Care Act. Physician assistants, advanced nurse practitioners and other types of allied health profes- sionals are in high demand, especially to deliver primary care given the shortage of primary care physicians, a situation that is only expected to worsen in the coming years. Annual premiums are renewing on a flat basis. This is a competitive line with plenty of capacity. Rates are quite low and have been for more than a decade. NEW AND EMERGING RISKS Following are a few of the emerging medical professional liability and related risks appearing on the radar. Cyber/Network Privacy Liability. The American healthcare industry leads all other industries in data breaches. According to responses to the 2016 Rate Survey Questionnaire, many underwrit- ers of physicians and surgeons are now offering coverage for this risk. Those that do offer it typically provide minimum limits of $50,000 to $100,000 with the ability to purchase higher limits. Some carriers offer up to $5 million in limit. A few have experienced claims (e.g., stolen laptops, etc.). Batch Claims. Coverage for a series of related events (a “batch”) is typically offered by hospital excess writers, but also as a form of reinsurance for physician carriers, often referred to as“systemic cov- erage.” Carriers anecdotally report a slight increase in these types of claims. Examples of these types of claims include such scenarios as the placement of unnecessary stents and the performance of unnec- essary surgeries. As the individual physician’s limits are so low com- pared to the potential for a recovery by sometimes hundreds of patients, the better target defendant is the hospital/hospitals where the physician practiced. With the high cost to the trial bar of pursu- ing MPL claims, these scenarios are very attractive for their high damage potential and potential huge payday for their law firms. Regulatory Risk Liability. A handful of carriers in the medical professional liability space now offer a comprehensive regulatory risk policy as freestanding coverage for claims arising out of fraud and abuse, HIPAA violations, False Claims Acts, Qui Tam actions and other regulatory violations. Many physician carriers also offer cover- age to insureds for various aspects of regulatory/administrative risk in varying limits, often including the ability to purchase higher lim- its of coverage. Telemedicine. Telemedicine is exploding as a care delivery modality. More health insurers are willing to reimburse physicians and hospitals for the use of telemedicine, and more employers are offering it to employees as part of their comprehensive benefits package. Telemedicine provides patient access that—especially in rural and underserved regions—is cost-effective and convenient. Most carriers responding to the 2016 Rate Survey Questionnaire indicated that they offer telemedicine coverage. The coverage is being offered across state lines and usual- ly with little or no underwriting restrictions, except requiring proper licensure of the insured within the jurisdiction(s). A few have seen claims, but most are deemed not significant. CONCLUSION In the near term, it looks like smooth sailing, but with some head- winds as the aggregate medical professional liability line of business seems poised to produce stable but less profitable results. Slowly declining underwriting results that reflect rate erosion/moderate loss cost trends across the industry—with no apparent help from a volatile investment environment—suggests overall profitability will follow the lead of underwriting results. However, there do not appear to be any rapidly developing storms on the horizon, although there are many possibilities. Surges in frequency and/or severity could be brought on by many of the phenomena noted, including: changes in patient attitudes toward providers; changes in healthcare provider/patient interactions and services due to, or independent of, healthcare reform; and changes in the technology used in healthcare delivery. Any one of these, par- tial impacts of all in combination or other unforeseen events, as well as the possibility of broad-based erosion of tort reforms, could pre- cipitate stormy seas. It can be tough sailing into the uncharted waters of the future, so keep your navigational aids at the ready. But for now, it seems “steady as she goes.” Paul A. Greve, JD, RPLU, is executive vice president/senior consultant in the Willis Towers Watson Health Care Practice. Alison M. Milford, ACAS, MAAA, is a senior consulting actuary with Willis Towers Watson's Atlanta office. MEDICAL LIABILITY MONITOR OCTOBER 2016 VOL 41, NO 10 7 Slowly declining underwriting results that reflect rate erosion/moderate loss cost trends across the industry together suggests overall profitability will follow the lead of underwriting results.