Download to read offline
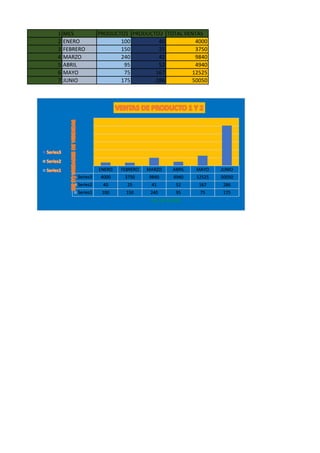

This document contains sales data for 6 months showing the quantities sold of Product1 and Product2 as well as total monthly sales. It displays the data in a table with months along the top and quantities/totals in columns, and also charts the data with months on the x-axis and quantities/totals in three separate line graphs.


