1. AppendicesMigrationsintheMediterraneanIEMed.MediterraneanYearbook2014428
Migrations in the Mediterranean
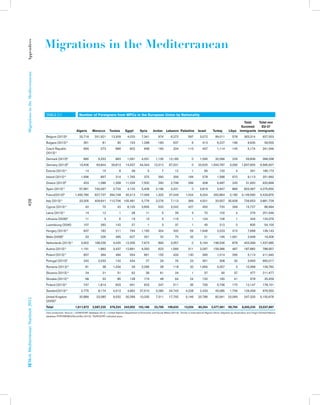
TABLE C1 Number of Foreigners from MPCs in the European Union by Nationality
Algeria Morocco Tunisia Egypt Syria Jordan Lebanon Palestine Israel Turkey Libya
Total
Euromed
immigrants
Total non
EU-27
immigrants
Belgium (2013)a
25,719 201,921 13,309 4,020 7,341 974 6,272 597 3,572 99,011 578 363,314 927,553
Bulgaria (2013) a 351 81 90 153 1,298 183 637 6 413 6,227 196 9,635 59,555
Czech Republic
(2013) a
659 273 689 602 658 160 324 113 437 1,114 145 5,174 241,346
Denmark (2013)a
890 5,253 863 1,591 4,031 1,135 12,183 0 1,595 32,066 229 59,836 368,338
Germany (2013)b 13,406 93,844 26,813 14,437 44,344 10,312 67,031 0 20,625 1,543,787 3,056 1,837,655 6,565,927
Estonia (2013) a 14 15 8 49 5 7 12 1 56 120 4 291 185,173
Ireland (2013) a
1,696 897 314 1,765 375 390 356 184 578 1,588 970 9,113 251,660
Greece (2013)b 453 1,086 1,358 11,026 7,500 290 2,748 299 408 6,487 245 31,900 920,899
Spain (2013) a 57,961 740,097 2,724 4,120 5,406 2,196 3,231 0 2,819 3,947 866 823,367 4,075,650
France(2013)b 1,455,780 927,737 394,748 30,413 17,069 1,322 47,249 1,024 9,204 262,864 2,180 3,149,590 5,433,875
Italy (2013) a
23,305 409,641 110,706 105,481 5,776 3,276 7,113 369 4,501 20,557 35,928 726,653 3,881,729
Cyprus (2013) a
42 75 42 6,105 3,835 520 3,242 427 450 720 269 15,727 86,994
Latvia (2013) a 14 12 1 28 11 5 26 3 70 102 4 276 251,546
Lithuania (2008)* 11 3 6 19 13 5 115 1 124 106 1 404 124,379
Luxembourg (2006) 107 260 142 27 1 3 37 1 45 212 0 835 54,100
Hungary (2013) a
637 182 211 794 1,165 304 332 59 1,646 2,023 315 7,668 139,143
Malta (2008)* 53 206 395 627 251 32 75 32 21 195 1,061 2,948 19,306
Netherlands (2013) a 3,902 168,236 4,425 12,335 7,673 893 3,357 0 5,164 196,536 878 403,399 1,437,685
Austria (2013) a
1,191 1,860 3,437 12,891 4,050 623 1,569 311 2,097 159,386 467 187,882 788,957
Poland (2013) a
657 364 484 554 661 155 433 130 395 1,014 266 5,113 411,940
Portugal (2010)* 240 2,033 142 434 27 29 76 23 351 308 30 3,693 660,017
Romania (2013) a
81 38 1,034 29 2,295 28 118 20 1,665 5,057 3 10,368 109,782
Slovenia (2013) a
24 21 51 92 39 61 24 1 37 90 37 477 211,477
Slovakia (2013) a
68 32 85 128 174 48 64 24 132 182 41 978 25,459
Finland (2013) a
747 1,814 603 931 623 247 511 35 730 5,736 170 12,147 178,151
Sweden(2013) a
2,775 8,174 4,512 4,962 27,510 3,280 24,743 4,228 2,433 45,085 1,756 129,458 976,550
United Kingdom
(2005)*
20,889 23,080 9,032 30,289 10,035 7,311 17,755 5,146 20,786 82,941 20,069 247,333 5,150,676
Total 1,611,672 2,587,235 576,224 243,902 152,166 33,789 199,633 13,034 80,354 2,477,461 69,764 8,045,234 33,537,867
Own production. Source: a EUROSTAT database 2013. b United Nations Department of Economic and Social Affairs (2013). Trends in International Migrant Stock: Migrants by Destination and Origin (United Nations
database POP/DB/MIG/Stock/Rev.2013); *EUROSTAT indicated years.
2. AppendicesMigrationsintheMediterraneanIEMed.MediterraneanYearbook2014429
CHART C1 Percentage of immigrants from MPCs on Total Immigrants 2013 (top 10 countries)
16.2%
16.2%
18.1%
18.7%
20.2%
23.8%
24.0%
28.0%
28.1%
39.2%
58.0%
83.8%
83.8%
81.9%
81.3%
79.8%
76.2%
76.0%
72.0%
71.9%
60.8%
42.0%
0% 10% 20% 30% 40% 50% 60% 70% 80% 90% 100%
Bulgaria (2013)ª
Denmark (2013)ª
Cyprus (2013)ª
Italy (2013)ª
Spain (2013)ª
Austria (2013)ª
EU average
Germany (2013)b
Netherlands (2013)ª
Belgium (2013)ª
France (2013)b
Immigrants from MED countires Immigrants from the rest of the world
EU average 24%
CHART C2 EU Immigrants from MPCs: from 2004 to 2013
4,782,989
4,875,811
5,742,679 5,971,098
7,700,318
8,045,234
20 21
19 19
24
24
0
5
10
15
20
25
30
-
1,000,000
2,000,000
3,000,000
4,000,000
5,000,000
6,000,000
7,000,000
8,000,000
9,000,000
2004 2006 2008 2010 2012 2013
PercentageofMPCimmigrantsontotalimmigration
TotalEUimmigrantsfromMPCcountries
Total EU immigrants from Euromed countries Percentage of immigrants from Euromed countries on total immigrants