Beginners Guide to TikTok for Search - Rachel Pearson - We are Tilt __ Bright...
Midterm_MaxParada
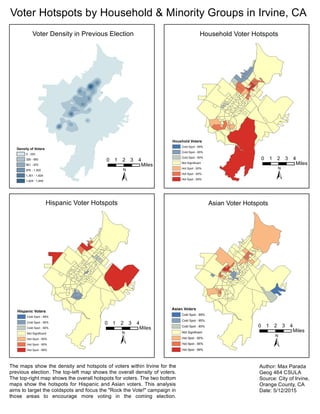
1. Voter Hotspots by Household & Minority Groups in Irvine, CA
Density of Voters
0 - 325
326 - 650
651 - 975
976 - 1,300
1,301 - 1,624
1,625 - 1,949
0 1 2 3 4
Miles
±
Houshold Voters
Cold Spot - 99%
Cold Spot - 95%
Cold Spot - 90%
Not Significant
Hot Spot - 90%
Hot Spot - 95%
Hot Spot - 99%
0 1 2 3 4
Miles
0 1 2 3 4
Miles 0 1 2 3 4
Miles
±
± ±
Hispanic Voters
Cold Spot - 99%
Cold Spot - 95%
Cold Spot - 90%
Not Significant
Hot Spot - 90%
Hot Spot - 95%
Hot Spot - 99%
Asian Voters
Cold Spot - 99%
Cold Spot - 95%
Cold Spot - 90%
Not Significant
Hot Spot - 90%
Hot Spot - 95%
Hot Spot - 99%
Voter Density in Previous Election Household Voter Hotspots
Hispanic Voter Hotspots Asian Voter Hotspots
The maps show the density and hotspots of voters within Irvine for the
previous election. The top-left map shows the overall density of voters.
The top-right map shows the overall hotspots for voters. The two bottom
maps show the hotspots for Hispanic and Asian voters. This analysis
aims to target the coldspots and focus the "Rock the Vote!" campaign in
those areas to encourage more voting in the coming election.
Author: Max Parada
Geog 464 CSULA
Source: City of Irvine,
Orange County, CA
Date: 5/12/2015