MGM MIRAGE SuppData05307
- 1. MGM MIRAGE AND SUBSIDIARIES
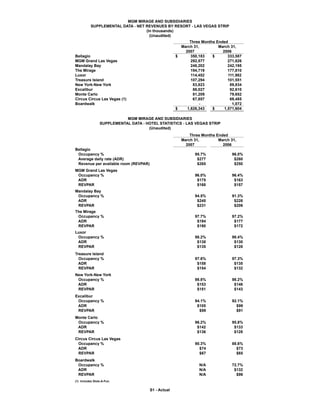
SUPPLEMENTAL DATA - NET REVENUES BY RESORT - LAS VEGAS STRIP
(In thousands)
(Unaudited)
Three Months Ended
March 31, March 31,
2007 2006
Bellagio $ 350,183 $ 333,587
MGM Grand Las Vegas 292,577 271,826
Mandalay Bay 248,202 242,195
The Mirage 194,719 177,810
Luxor 114,452 111,982
Treasure Island 107,294 101,551
New York-New York 83,823 89,834
Excalibur 86,027 92,610
Monte Carlo 81,209 79,652
Circus Circus Las Vegas (1) 67,857 69,485
Boardwalk - 1,072
$ 1,626,343 $ 1,571,604
MGM MIRAGE AND SUBSIDIARIES
SUPPLEMENTAL DATA - HOTEL STATISTICS - LAS VEGAS STRIP
(Unaudited)
Three Months Ended
March 31, March 31,
2007 2006
Bellagio
Occupancy % 95.7% 96.0%
Average daily rate (ADR) $277 $260
Revenue per available room (REVPAR) $265 $250
MGM Grand Las Vegas
Occupancy % 96.0% 96.4%
ADR $175 $163
REVPAR $168 $157
Mandalay Bay
Occupancy % 94.5% 91.3%
ADR $245 $226
REVPAR $231 $206
The Mirage
Occupancy % 97.7% 97.2%
ADR $194 $177
REVPAR $190 $172
Luxor
Occupancy % 98.2% 98.4%
ADR $138 $130
REVPAR $135 $128
Treasure Island
Occupancy % 97.6% 97.3%
ADR $158 $135
REVPAR $154 $132
New York-New York
Occupancy % 98.8% 98.2%
ADR $153 $146
REVPAR $151 $143
Excalibur
Occupancy % 94.1% 92.1%
ADR $105 $99
REVPAR $99 $91
Monte Carlo
Occupancy % 96.2% 95.8%
ADR $142 $133
REVPAR $136 $128
Circus Circus Las Vegas
Occupancy % 90.3% 88.6%
ADR $74 $73
REVPAR $67 $65
Boardwalk
Occupancy % N/A 72.7%
ADR N/A $132
REVPAR N/A $96
(1) Includes Slots-A-Fun.
S1 - Actual
- 2. MGM MIRAGE AND SUBSIDIARIES
SUPPLEMENTAL DATA - PROPERTY EBITDA BY RESORT - LAS VEGAS STRIP
(In thousands)
(Unaudited)
Three Months Ended
March 31, March 31,
2007 2006
Bellagio $ 131,614 $ 110,427
MGM Grand Las Vegas 95,669 80,833
Mandalay Bay 83,655 78,216
The Mirage 53,811 65,562
Luxor 45,600 43,657
Treasure Island 33,687 31,628
New York-New York 34,904 39,215
Excalibur 31,560 35,825
Monte Carlo 33,567 22,375
Circus Circus Las Vegas (1) 18,749 19,339
CityCenter (13,974) (2,137)
Boardwalk - (1,559)
$ 548,842 $ 523,381
MGM MIRAGE AND SUBSIDIARIES
DETAIL OF CERTAIN CHARGES AFFECTING PROPERTY EBITDA - LAS VEGAS STRIP
(In thousands)
(Unaudited)
Three Months Ended March 31, 2007
Preopening and Restructuring Property
start-up expenses costs transactions, net Total
Bellagio $ - $ - $ (275) $ (275)
MGM Grand Las Vegas 220 - - 220
Mandalay Bay - - 17 17
The Mirage - - - -
Luxor - - (25) (25)
Treasure Island - - (3) (3)
New York-New York - - - -
Excalibur - - 189 189
Monte Carlo 110 - 368 478
Circus Circus Las Vegas (1) - - 7 7
CityCenter 8,142 - - 8,142
Boardwalk - - - -
$ 8,472 $ - $ 278 $ 8,750
Three Months Ended March 31, 2006
Preopening and Restructuring Property
start-up expenses costs transactions, net Total
Bellagio $ - $ - $ 12,332 $ 12,332
MGM Grand Las Vegas 919 - 414 1,333
Mandalay Bay - - 767 767
The Mirage 310 - 411 721
Luxor 497 - (9) 488
Treasure Island 21 - (10) 11
New York-New York - - (5) (5)
Excalibur - - 51 51
Monte Carlo - - 9,542 9,542
Circus Circus Las Vegas (1) - - - -
CityCenter 1,461 - - 1,461
Boardwalk - 804 - 804
$ 3,208 $ 804 $ 23,493 $ 27,505
(1) Includes Slots-A-Fun.
S2 - Actual
- 3. MGM MIRAGE AND SUBSIDIARIES
SUPPLEMENTAL DATA - RECONCILIATION OF OPERATING INCOME
TO PROPERTY EBITDA - LAS VEGAS STRIP
(In thousands)
(Unaudited)
Three Months Ended March 31, 2007
Operating income Depreciation and
(loss) amortization EBITDA
Bellagio $ 100,643 $ 30,971 $ 131,614
MGM Grand Las Vegas 71,231 24,438 95,669
Mandalay Bay 62,297 21,358 83,655
The Mirage 38,260 15,551 53,811
Luxor 36,122 9,478 45,600
Treasure Island 25,849 7,838 33,687
New York-New York 27,295 7,609 34,904
Excalibur 26,023 5,537 31,560
Monte Carlo 28,176 5,391 33,567
Circus Circus Las Vegas (1) 13,604 5,145 18,749
CityCenter (14,555) 581 (13,974)
Boardwalk - - -
$ 414,945 $ 133,897 $ 548,842
Three Months Ended March 31, 2006
Operating income Depreciation and
(loss) amortization EBITDA
Bellagio $ 79,777 $ 30,650 $ 110,427
MGM Grand Las Vegas 57,310 23,523 80,833
Mandalay Bay 58,538 19,678 78,216
The Mirage 53,029 12,533 65,562
Luxor 34,167 9,490 43,657
Treasure Island 24,656 6,972 31,628
New York-New York 30,859 8,356 39,215
Excalibur 31,418 4,407 35,825
Monte Carlo 15,256 7,119 22,375
Circus Circus Las Vegas (1) 14,037 5,302 19,339
CityCenter (2,137) - (2,137)
Boardwalk (1,559) - (1,559)
$ 395,351 $ 128,030 $ 523,381
(1) Includes Slots-A-Fun.
S3 - Actual