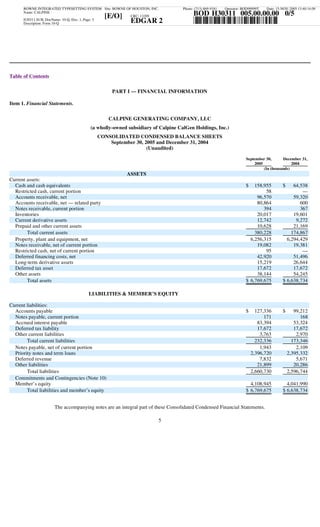
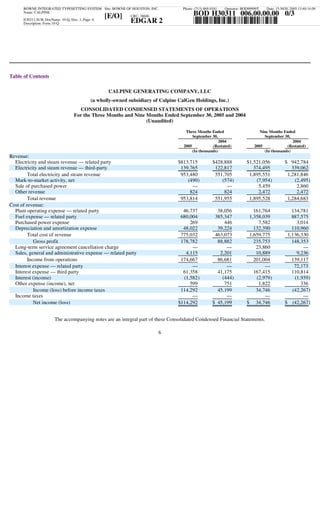
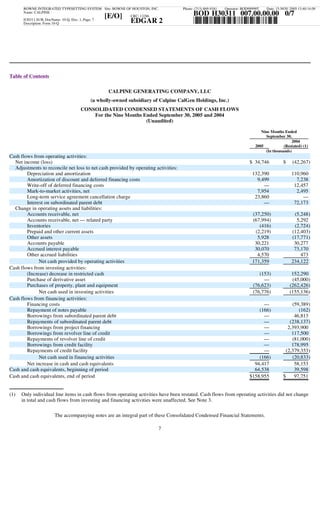
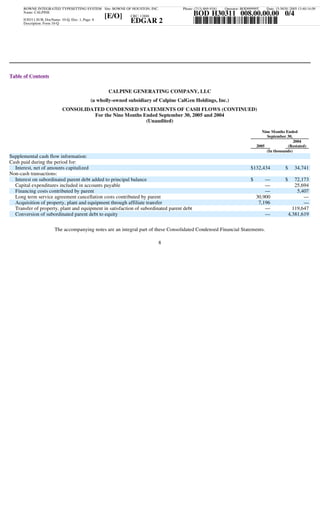
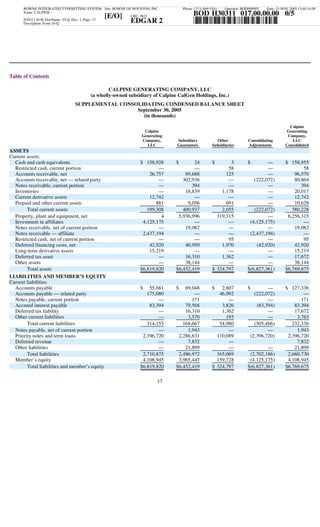
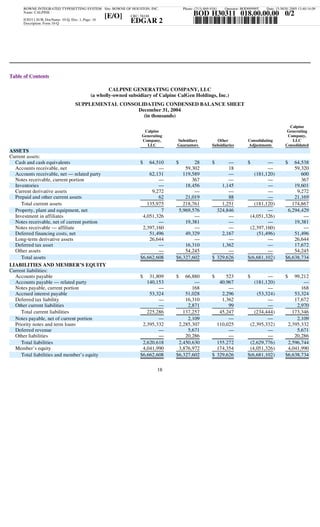
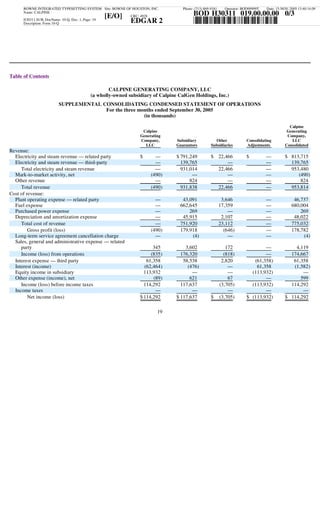
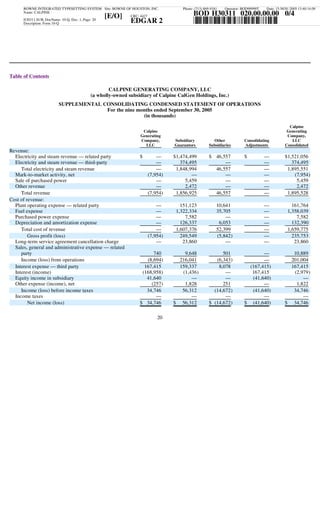
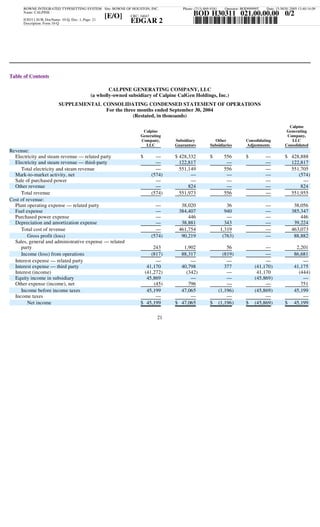
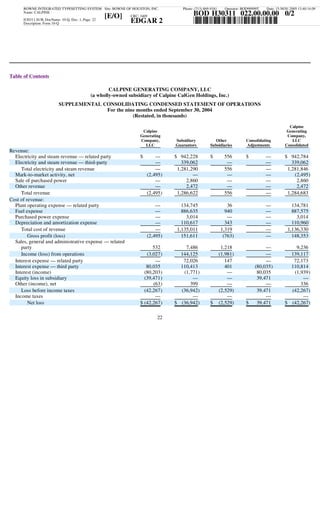
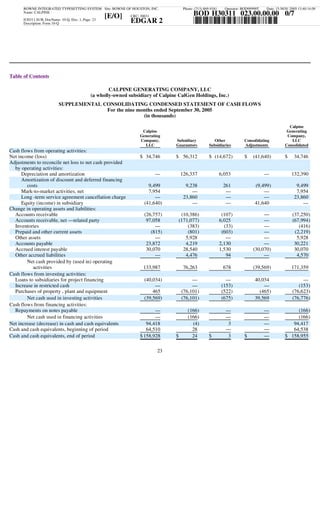
This document is a Form 10-Q quarterly report filed with the SEC by Calpine Generating Company, LLC. It includes an unaudited consolidated condensed balance sheet comparing assets and liabilities as of September 30, 2005 to December 31, 2004, as well as unaudited consolidated condensed statements of operations and cash flows for the three and nine month periods ended September 30, 2005 and 2004. The document also includes notes to the financial statements and sections for management's discussion of financial condition and results of operations, market risk, controls and procedures, legal proceedings, and certifications.
This document is a Form 10-K annual report filed with the SEC by Calpine Generating Company, LLC and CalGen Finance Corp. for the fiscal year ending December 31, 2004. It provides an overview of the companies, including that CalGen owns 14 power generation facilities with 9,834 MW of peak capacity. It also summarizes principal agreements with affiliates for fuel supply and power sales. Risk factors are incorporated by reference from other SEC filings. Financial and operational results for 2004 are provided in detail within the filing.
This document is Southwestern Public Service Company's (SPS) annual report on Form 10-K filed with the Securities and Exchange Commission for the fiscal year ended December 31, 2007. SPS is an electric utility that generates, transmits, and distributes electricity to customers in portions of Texas and New Mexico. The report provides an overview of SPS's business operations, including its focus on growing its electric rate base to meet customer demand. It also discusses recent regulatory developments in the electric utility industry, such as policies to address climate change and encourage renewable energy. The report addresses risks related to increasing environmental regulations and the potential impacts of climate change policy on SPS's operations.
Registration Status: Active in CCR until 11/15/2011. DUNS: 016206984. Legal Business Name: L. W. SURVEY ENGINEERING & DESIGN CO. Physical Street Address 1: 325 S LAKE AVE. Business Start Date: 01/07/1998. Type of Organization: Corporate Entity, Not Federal Tax Exempt (State of Incorporation is IL). NAICS Code 541330 - Engineering Services.
This document is Northern States Power Company's (NSP-Wisconsin) annual report on Form 10-K filed with the SEC for the fiscal year ended December 31, 2007. NSP-Wisconsin is an operating public utility engaged in the generation, transmission, distribution and sale of electricity and natural gas in portions of Wisconsin and Michigan. It had approximately 246,000 electric customers and 102,000 natural gas customers. The report provides an overview of NSP-Wisconsin's operations, discusses its regulatory environment and recent regulatory developments, and outlines its principal business risks and challenges.
This document is a Form 10-K annual report filed with the SEC by Calpine Generating Company, LLC and CalGen Finance Corp. for the fiscal year ended December 31, 2005. The report provides information on the companies' businesses and operations, financial statements, legal proceedings, risks factors, executive officers and directors. Specifically, it summarizes the companies' principal business activities, discusses risks related to their significant debt levels and bankruptcy proceedings, and incorporates audited financial statements and notes.
This document is Public Service Company of Colorado's (PSCo) annual report on Form 10-K filed with the SEC for the fiscal year ended December 31, 2007. PSCo is a wholly owned subsidiary of Xcel Energy Inc. that operates primarily in Colorado generating, purchasing, transmitting, distributing and selling electricity. Key details include that PSCo serves both retail and wholesale customers, its rates and services are regulated by the CPUC and FERC, and it owns and operates electric generation facilities as well as transmission and distribution infrastructure to deliver electricity to customers. The report provides an overview of PSCo's electric and natural gas utility operations, recent regulatory developments, environmental matters, and risk factors.
1. The document is Masco Corporation's proxy statement for its 2005 annual meeting of shareholders, providing information on matters to be voted on including election of directors.
2. It provides background information on nominees for election as Class I and Class II directors, including their occupations, ages, experience, and other directorships.
3. The proxy statement requests shareholder votes to elect nominees for director positions and to ratify selection of the independent auditors for 2005.
This document provides information about a survey being conducted by the U.S. Census Bureau and the Bureau of Justice Statistics. It notes that the survey is being conducted under the authority of Title 13 and Title 42 of the United States Code, which require respondent information to be kept confidential and only used for statistical purposes. The document includes a notice that no one is required to respond without a valid OMB number. It then lists various items that will be filled out before, during and after the interview regarding the household and respondents.
The document is the annual report from MGM Mirage for 2002. It summarizes the company's record financial performance in 2002 with record revenues and earnings. It highlights new projects, partnerships, and initiatives including expanding existing properties, developing new shows with Cirque du Soleil, and continuing efforts to promote diversity within the company's workforce. The company is positioned for continued strong performance with new attractions and a focus on attracting top talent.
The document provides an overview of how electricity market restructuring has impacted the Texas market. It discusses how restructuring led to billions of dollars in investment in new efficient natural gas power plants, increasing generation capacity by over 25 GW. This brought average wholesale power prices down significantly from $80/MWh to $45/MWh while also improving the efficiency of the generation fleet as reflected by lower system-wide heat rates. The changes created a more competitive market structure with over 50 retail electricity providers while also improving reliability.
The document summarizes an EEI conference presentation by the CEO of TXU. It discusses three phases of TXU's turnaround plan to address challenges in the transition to a competitive energy environment: 1) Risk and return restructuring through asset sales and balance sheet repair, 2) Performance improvement targeting $1.3 billion in savings, and 3) Ongoing value creation. The presentation highlights how execution of the plan through portfolio management, risk management, and performance management has created over $15 billion in shareholder value. It also outlines TXU's strategic principles focused on structurally advantaged assets, industrial performance, and scale.
This document provides supplemental financial data for MGM MIRAGE, including net revenues and property EBITDA by resort on the Las Vegas Strip for Q1 2007 and Q1 2006. It also includes hotel operating statistics like occupancy rates and average daily rates for their Strip properties. Revenues increased for most properties in 2007 compared to 2006. CityCenter had a loss of $14 million in property EBITDA in Q1 2007 due to ongoing preopening and start-up expenses.
This document is Calpine Corporation's quarterly report on Form 10-Q for the quarter ended June 30, 2007 filed with the SEC. It includes Calpine's consolidated condensed financial statements and notes for the quarter. Key details include that Calpine has filed for Chapter 11 bankruptcy protection and indicates it has 487,258,132 shares of common stock outstanding as of August 3, 2007. The report also provides management's discussion and analysis of Calpine's financial condition and operating performance for the quarter.
The document summarizes the company's financial performance and strategy in 2002. It discusses maximizing shareholder value through growing revenue, improving marketing, investing in new attractions, and focusing on expense control. Key accomplishments included record earnings of $1.83 per share and industry-leading operating margins. The company also reduced debt by $314 million and repurchased $208 million of its own stock. Looking ahead, it plans additional investments in existing properties and evaluating new development opportunities to continue delivering strong returns.
This document provides an overview of Chesapeake Energy Corporation (CHK) from a March 2009 investor presentation. It summarizes that CHK is a leading producer of natural gas in the US, with production of over 2 billion cubic feet per day. It has top-quality assets in major shale plays like the Haynesville, Marcellus, Barnett, and Fayetteville, giving it low finding and development costs. Joint venture deals have also provided significant value for the company while improving its balance sheet. Looking ahead, CHK expects to continue increasing production and reserves at a low cost despite the economic downturn.
The document contains a single number - 5.5% - which appears to indicate a percentage or rate of some kind. No other context or details are provided that would help explain what the given percentage refers to.
The document is the table of contents for the Form 11-K annual report filed by Precision Strip, Inc. Retirement and Savings Plan. It lists various reports, financial statements, and notes related to the plan for the year ended December 31, 2006. The table of contents includes the report of the independent registered public accounting firm, statements of net assets available for benefits as of December 31, 2006 and 2005, statement of changes in net assets available for benefits for the year ended December 31, 2006, notes to the financial statements, and a supplemental schedule of assets held at the end of the year.
Google filed a Form 10-Q with the SEC for the quarter ending September 30, 2005. Some key details from the filing include:
- Revenues for the quarter were $1.58 billion, up from $806 million in the same quarter last year. Net income was $381 million, up from $52 million last year.
- Cash and cash equivalents totaled $5.52 billion at the end of the quarter, up from $427 million at the end of 2004.
- Total costs and expenses for the quarter were $1.05 billion, up from $795 million in the same quarter last year.
- Basic and diluted earnings per share for the quarter were $1
This document is Google's Form 10-Q filing with the SEC for the quarterly period ended September 30, 2005. It includes Google's condensed consolidated balance sheets as of December 31, 2004 and September 30, 2005, which shows an increase in total assets from $2.7 billion to $8.4 billion over that period. It also includes condensed consolidated statements of income for quarters ended September 30, 2004 and 2005 and condensed consolidated statements of cash flows for the nine month periods ended September 30, 2004 and 2005. The filing also includes notes to the unaudited condensed consolidated financial statements and sections for management's discussion of financial results, market risk disclosures, and controls and procedures.
- The document is Google Inc.'s Form 10-Q filing with the SEC for the quarterly period ended September 30, 2007.
- It provides Google's consolidated financial statements including balance sheets, income statements, and cash flow statements for interim periods.
- The financial statements show Google's revenues increased over the comparable prior year periods as did costs and expenses, resulting in increased income from operations and net income.
This document is Google Inc.'s Form 10-Q quarterly report filed with the SEC for the quarter ended June 30, 2005. The summary includes:
1) Google reported revenues of $1.38 billion for the quarter, up from $700 million in the same quarter last year. Net income was $342.8 million compared to $79.1 million last year.
2) Costs and expenses increased to $908.8 million from $529.3 million due primarily to increases in costs of revenues, research and development, sales and marketing, and general and administrative expenses.
3) Cash provided by operating activities was $1.15 billion, and cash and marketable securities totaled
This document is Google Inc.'s Form 10-Q quarterly report filed with the SEC for the quarter ended June 30, 2005. The summary includes:
1) Google reported revenues of $1.38 billion for the quarter, up from $700 million in the same quarter last year. Net income was $342.8 million compared to $79.1 million last year.
2) Costs and expenses increased to $908.8 million from $529.3 million driven primarily by increases in cost of revenues, research and development, sales and marketing, and general administrative expenses.
3) Cash provided by operating activities was $1.15 billion for the first six months of 2005 compared to $
This document is Google's Form 10-Q filing with the SEC for the quarterly period ended June 30, 2005. It includes Google's condensed consolidated balance sheets as of December 31, 2004 and June 30, 2005 (unaudited), as well as condensed consolidated statements of income and cash flows for the three and six month periods ended June 30, 2004 and 2005 (unaudited). Notes to the unaudited condensed consolidated financial statements are also provided. The filing provides key financial information about Google's financial position and performance during the reported periods.
This document is a submission information file and 10-K/A form filed by Toll Brothers, Inc. with the SEC for the fiscal year ended October 31, 2001. It includes information such as the type of filing, contact information, registration details, financial statements, and notes. The 10-K/A amends the original 10-K filing to correct typographical errors in item 8, add omitted disclosure of executive compensation for Robert I. Toll and Bruce E. Toll in item 11, and provide an explanation of the amendments.
This document is a submission information file and 10-K/A form filed by Toll Brothers, Inc. with the SEC. It provides information on Toll Brothers such as its CIK number, contact information, period covered, and types of securities registered. It also restates Items 8 and 11 of the original 10-K filing to correct typographical errors, provide omitted compensation details for executives Robert and Bruce Toll, and add disclosure of perquisites received by Robert Toll.
This document is Winn-Dixie Stores, Inc.'s annual report on Form 10-K for the fiscal year ended June 28, 2006. It provides information on Winn-Dixie's business operations, legal proceedings, financial results, executive officers, ownership, and accounting practices. Notably, it discusses that Winn-Dixie filed for Chapter 11 bankruptcy protection in February 2005 and has since closed over 350 stores while restructuring its operations and debts.
This document is Winn-Dixie Stores, Inc.'s annual report on Form 10-K for the fiscal year ended June 28, 2006. It provides information on Winn-Dixie's business, legal proceedings, risks, financial statements, executive compensation, and other disclosures required by the SEC. The report states that as of August 23, 2006, Winn-Dixie had over 141 million shares of common stock outstanding and that the aggregate market value of shares held by non-affiliates was approximately $70.7 million as of January 11, 2006. It also contains forward-looking statements and cautions readers that the company's actual results could differ materially from these statements.
- Public Service Company of Colorado (PSCo) filed a quarterly report on Form 10-Q with the SEC for the quarter ended Sept. 30, 2008.
- PSCo is a wholly owned subsidiary of Xcel Energy Inc. that operates regulated electric and natural gas utilities in Colorado.
- For the quarter, PSCo reported net income of $86.3 million on operating revenues of $1.1 billion, compared to net income of $105.7 million on operating revenues of $781.3 million for the same quarter last year.
This document is Southwestern Public Service Company's (SPS) annual report on Form 10-K filed with the SEC. It provides an overview of SPS's electric utility operations in Texas and New Mexico, including key regulatory developments. SPS generates, transmits, and distributes electricity to approximately 388,000 customers. Looking forward, SPS expects significant future environmental regulations to address climate change and encourage clean energy. While not currently subject to emissions limits, SPS is undertaking initiatives to reduce greenhouse gas emissions in preparation for potential regulation. The report also discusses ongoing federal efforts to promote competitive wholesale electricity markets and the impacts of utility restructuring on SPS's retail business.
SemGroup Energy Partners, L.P. filed its annual report (Form 10-K) with the SEC for the fiscal year ending December 31, 2008. The report provides information on the company's business operations, legal proceedings, risk factors, financial statements, and other disclosures required by the SEC for public companies. SemGroup Energy Partners operates in 23 states providing crude oil and liquid asphalt services including terminalling, storage, gathering, processing and transportation.
This document is Molson Coors Brewing Company's annual report on Form 10-K for the fiscal year ended December 30, 2007. It provides a summary of Molson Coors' business operations and financial results. Key details include:
- Molson Coors is a leading global brewer formed in 2005 by the merger of Molson Inc. and Adolph Coors Company.
- In 2006, Molson Coors sold a majority stake in its Brazilian subsidiary Kaiser and retained a minority interest, which it later divested.
- Molson Coors has existing joint ventures for activities like can manufacturing, bottle manufacturing, and transportation in some markets.
- In 2007, Molson Co
This document is Molson Coors Brewing Company's annual report on Form 10-K for the fiscal year ended December 30, 2007. It provides a summary of Molson Coors' business operations and financial results. Key details include:
- Molson Coors is a leading global brewer formed in 2005 by the merger of Molson Inc. and Adolph Coors Company.
- In 2006, Molson Coors sold a majority stake in its Brazilian subsidiary Kaiser and retained a minority interest, which it later divested.
- Molson Coors has several joint ventures for activities like can manufacturing, bottle manufacturing, and transportation and distribution in various markets.
- In 2007, Mol
This document is Molson Coors Brewing Company's annual report on Form 10-K for the fiscal year ending December 30, 2007 filed with the United States Securities and Exchange Commission. It provides an overview of Molson Coors' business operations, financial results, properties used, legal proceedings, market for stock, management discussion and analysis, financial statements, controls and procedures, and other required disclosures. The report is signed and certified by Molson Coors' management and its auditors.
The document contains a single number - 5.5% - which appears to indicate a percentage or rate of some kind. No other context or details are provided that would help explain the meaning or significance of this number.
This document provides an overview of Chesapeake Energy Corporation (CHK) from a March 2009 investor presentation. It summarizes that CHK is a leading producer of natural gas in the US, with production of over 2 billion cubic feet per day. It has top-quality assets in major shale plays like the Haynesville, Marcellus, Barnett, and Fayetteville shales. CHK has captured value through joint venture deals in these plays while maintaining high production growth rates and low finding costs. The document outlines CHK's competitive advantages that position it well during an economic downturn.
The document contains a single number - 5.5% - which appears to indicate a percentage or rate of some kind. No other context or details are provided, so a concise 3 sentence summary cannot capture much meaningful information from this very brief document.
The document contains a single number - 5.5% - which appears to indicate a percentage or rate of some kind. No other context or details are provided that would help explain what the given percentage refers to.
This document provides an overview of Chesapeake Energy Corporation (CHK) from a March 2009 investor presentation. It summarizes that CHK is a leading producer of natural gas in the US, with production of over 2 billion cubic feet per day. It has top-quality assets in major shale plays like the Haynesville, Marcellus, Barnett, and Fayetteville, giving it low finding and development costs. Joint venture deals have also provided significant value for the company while improving its balance sheet. Looking ahead, CHK expects to continue increasing production and reserves at a low cost despite the economic downturn.
This document contains selected historical net revenue and EBITDA data by resort for MGM MIRAGE and its subsidiaries. It shows that for the quarter ending September 30, 2004, Mandalay Bay had the highest net revenue of $194,864,000 and EBITDA of $47,807,000. Overall for 2004, Mandalay Bay had the highest annual net revenue of $823,464,000 and EBITDA of $241,512,000 among all the listed resorts. The data is broken out by quarter and resort, with notes on what properties are included in certain categories.
This document provides pro forma net revenues and EBITDA by resort for MGM MIRAGE and subsidiaries for the second quarter and first half of 2005 and 2004. It shows that the Bellagio and MGM Grand Las Vegas resorts generated the highest net revenues and EBITDA amounts both quarterly and year-to-date. Additional data includes pro forma results for other Nevada properties, MGM Grand Detroit, and Mississippi properties including Beau Rivage and Gold Strike Tunica. Schedules also reconcile operating income to EBITDA for the periods presented.
This document provides supplemental data on net revenues and EBITDA by resort for MGM MIRAGE and its subsidiaries. It shows that for the second quarter of 2005, net revenues increased over 60% and EBITDA increased over 47% compared to the same period in 2004. The largest contributors to net revenues and EBITDA were the Bellagio, MGM Grand Las Vegas, and other Las Vegas Strip properties. EBITDA margins expanded as several new acquisitions were integrated into operations.
This document provides quarterly net revenue and hotel statistics for MGM Resorts International properties on the Las Vegas Strip from 2007 to 2006. It shows that Bellagio and MGM Grand Las Vegas generally had the highest net revenues, while occupancy rates were consistently over 90% across most properties. Property EBITDA was highest for Bellagio, MGM Grand, and Mandalay Bay. Certain preopening, restructuring, and transaction costs affected Property EBITDA amounts.
The document provides quarterly and year-to-date net revenue and hotel operating metrics for MGM Resorts International's Las Vegas Strip properties from 2007 to 2006. Bellagio typically leads in revenues but saw a slight decline in the most recent quarter. Occupancy rates remained high across properties, generally above 90%, while average daily rates and revenue per available room increased at most properties year-over-year. Operating income decreased at some properties in the most recent quarter due to certain one-time preopening, restructuring and property transaction costs.
Navigating Your Financial Future: Comprehensive Planning with Mike Baumannmikebaumannfinancial
Learn how financial planner Mike Baumann helps individuals and families articulate their financial aspirations and develop tailored plans. This presentation delves into budgeting, investment strategies, retirement planning, tax optimization, and the importance of ongoing plan adjustments.
Dr. Alyce Su Cover Story - China's Investment Leadermsthrill
In World Expo 2010 Shanghai – the most visited Expo in the World History
https://www.britannica.com/event/Expo-Shanghai-2010
China’s official organizer of the Expo, CCPIT (China Council for the Promotion of International Trade https://en.ccpit.org/) has chosen Dr. Alyce Su as the Cover Person with Cover Story, in the Expo’s official magazine distributed throughout the Expo, showcasing China’s New Generation of Leaders to the World.
Poonawalla Fincorp’s Strategy to Achieve Industry-Leading NPA Metricsshruti1menon2
Poonawalla Fincorp Limited, under the leadership of Managing Director Abhay Bhutada, has achieved industry-leading Gross Non-Performing Assets (GNPA) below 1% and Net Non-Performing Assets (NNPA) below 0.5% as of May 31, 2024. This success is attributed to a strategic vision focusing on prudent credit policies, robust risk management, and digital transformation. Bhutada's leadership has driven the company to exceed its targets ahead of schedule, emphasizing rigorous credit assessment, advanced risk management, and enhanced collection efficiency. By prioritizing customer-centric solutions, leveraging digital innovation, and maintaining strong financial performance, Poonawalla Fincorp sets new benchmarks in the industry. With a continued focus on asset quality, digital enhancement, and exploring growth opportunities, the company is well-positioned for sustained success in the future.
Calculation of compliance cost: Veterinary and sanitary control of aquatic bi...Alexander Belyaev
Calculation of compliance cost in the fishing industry of Russia after extended SCM model (Veterinary and sanitary control of aquatic biological resources (ABR) - Preparation of documents, passing expertise)
Fabular Frames and the Four Ratio ProblemMajid Iqbal
Digital, interactive art showing the struggle of a society in providing for its present population while also saving planetary resources for future generations. Spread across several frames, the art is actually the rendering of real and speculative data. The stereographic projections change shape in response to prompts and provocations. Visitors interact with the model through speculative statements about how to increase savings across communities, regions, ecosystems and environments. Their fabulations combined with random noise, i.e. factors beyond control, have a dramatic effect on the societal transition. Things get better. Things get worse. The aim is to give visitors a new grasp and feel of the ongoing struggles in democracies around the world.
Stunning art in the small multiples format brings out the spatiotemporal nature of societal transitions, against backdrop issues such as energy, housing, waste, farmland and forest. In each frame we see hopeful and frightful interplays between spending and saving. Problems emerge when one of the two parts of the existential anaglyph rapidly shrinks like Arctic ice, as factors cross thresholds. Ecological wealth and intergenerational equity areFour at stake. Not enough spending could mean economic stress, social unrest and political conflict. Not enough saving and there will be climate breakdown and ‘bankruptcy’. So where does speculative design start and the gambling and betting end? Behind each fabular frame is a four ratio problem. Each ratio reflects the level of sacrifice and self-restraint a society is willing to accept, against promises of prosperity and freedom. Some values seem to stabilise a frame while others cause collapse. Get the ratios right and we can have it all. Get them wrong and things get more desperate.
What Lessons Can New Investors Learn from Newman Leech’s Success?Newman Leech
Newman Leech's success in the real estate industry is based on key lessons and principles, offering practical advice for new investors and serving as a blueprint for building a successful career.
In World Expo 2010 Shanghai – the most visited Expo in the World History
https://www.britannica.com/event/Expo-Shanghai-2010
China’s official organizer of the Expo, CCPIT (China Council for the Promotion of International Trade https://en.ccpit.org/) has chosen Dr. Alyce Su as the Cover Person with Cover Story, in the Expo’s official magazine distributed throughout the Expo, showcasing China’s New Generation of Leaders to the World.
1. BOWNE INTEGRATED TYPESETTING SYSTEM Site: BOWNE OF HOUSTON, INC. Phone: (713) 869-9181 Operator: BOD99999T Date: 15-NOV-2005 13:40:14.09
BOD H30311 001.00.00.00 0/3
Name: CALPINE
[E/O] CRC: 16343
*H30311/001/3*
EDGAR 2
H30311.SUB, DocName: 10-Q, Doc: 1, Page: 1
Description: Form 10-Q
Table of Contents
UNITED STATES SECURITIES AND EXCHANGE COMMISSION
Washington, D.C. 20549
Form 10-Q
(Mark One)
QUARTERLY REPORT PURSUANT TO SECTION 13 OR 15(d) OF THE SECURITIES
EXCHANGE ACT OF 1934
For the quarterly period ended September 30, 2005
Or
TRANSITION REPORT PURSUANT TO SECTION 13 OR 15(d) OF THE SECURITIES
EXCHANGE ACT OF 1934
For the transition period from to
Commission file number: 333-117335
Calpine Generating Company, LLC
Date: 15-NOV-2005 13:40:14.09
(A Delaware Limited Liability Company)
CalGen Finance Corp.
(A Delaware Corporation)
BOD H30311 001.00.00.00 0/3
I.R.S. Employer Identification Nos.
77-0555128
*H30311/001/3*
20-1162632
50 West San Fernando Street
Operator: BOD99999T
San Jose, California 95113
Telephone: (408) 995-5115
Indicate by check mark whether the registrant (1) has filed all reports required to be filed by Section 13 or 15(d) of the Securities Exchange
Act of 1934 during the preceding 12 months (or for such shorter period that the registrant was required to file such reports), and (2) has been
subject to such filing requirements for the past 90 days. Yes No
Indicate by check mark whether the registrant is an accelerated filer (as defined in Rule 12b-2 of the Exchange Act). Yes No
Phone: (713) 869-9181
Indicate by check mark whether the registrant is a shell company (as defined in Rule 12b-2 of the Exchange Act). Yes No
Indicate the number of shares outstanding of each of the issuer’s classes of common stock, as of the latest practicable date:
Calpine Generating Company, LLC is a single member limited liability company and has no common stock.
With respect to CalGen Finance Corp., 1,000 shares of common stock, par value $1, were outstanding as of the date hereof.
EDGAR 2
WNE INTEGRATED TYPESETTING SYSTEM Site: BOWNE OF HOUSTON, INC.
CRC: 16343
[E/O]
30311.SUB, DocName: 10-Q, Doc: 1, Page: 1
escription: Form 10-Q
ame: CALPINE
2. BOWNE INTEGRATED TYPESETTING SYSTEM Site: BOWNE OF HOUSTON, INC. Phone: (713) 869-9181 Operator: BOD99999T Date: 15-NOV-2005 13:40:14.09
BOD H30311 002.00.00.00 0/1
Name: CALPINE
[E/O] CRC: 42550
*H30311/002/1*
EDGAR 2
H30311.SUB, DocName: 10-Q, Doc: 1, Page: 2
Description: Form 10-Q
Table of Contents
TABLE OF ADDITIONAL REGISTRANTS
State of I.R.S. Employer
Incorporation Commission File Identification
Registrant or Organization Number Number
CalGen Expansion Company, LLC Delaware 333-117335-39 77-0555127
Baytown Energy Center, LP Delaware 333-117335-38 77-0555135
Calpine Baytown Energy Center GP, LLC Delaware 333-117335-37 77-0555133
Calpine Baytown Energy Center LP, LLC Delaware 333-117335-36 77-0555138
Baytown Power GP, LLC Delaware 333-117335-35 86-1056699
Baytown Power, LP Delaware 333-117335-34 86-1056708
Carville Energy LLC Delaware 333-117335-33 36-4309608
Channel Energy Center, LP Delaware 333-117335-32 77-0555137
Calpine Channel Energy Center GP, LLC Delaware 333-117335-31 77-0555139
Calpine Channel Energy Center LP, LLC Delaware 333-117335-09 77-0555140
Channel Power GP, LLC Delaware 333-117335-08 86-1056758
Channel Power, LP Delaware 333-117335-07 86-1056755
Columbia Energy LLC Delaware 333-117335-06 36-4380154
Corpus Christi Cogeneration LP Delaware 333-117335-05 36-4337040
Nueces Bay Energy LLC Delaware 333-117335-04 36-4216016
Calpine Northbrook Southcoast Investors, LLC Delaware 333-117335-03 36-4337045
Calpine Corpus Christi Energy GP, LLC Delaware 333-117335-02 86-1056770
Calpine Corpus Christi Energy, LP Delaware 333-117335-30 86-1056497
Decatur Energy Center, LLC Delaware 333-117335-29 77-0555708
Delta Energy Center, LLC Delaware 333-117335-28 95-4812214
CalGen Project Equipment Finance Company Two, LLC Delaware 333-117335-27 77-0585399
Freestone Power Generation LP Texas 333-117335-26 76-0608559
Date: 15-NOV-2005 13:40:14.09
Calpine Freestone, LLC Delaware 333-117335-25 77-0486738
CPN Freestone, LLC Delaware 333-117335-24 77-0545937
Calpine Freestone Energy GP, LLC Delaware 333-117335-23 86-1056713
BOD H30311 002.00.00.00 0/1
Calpine Freestone Energy, LP Delaware 333-117335-22 86-1056720
Calpine Power Equipment LP Texas 333-117335-21 76-0645514
Los Medanos Energy Center, LLC Delaware 333-117335-20 77-0553164
*H30311/002/1*
CalGen Project Equipment Finance Company One, LLC Delaware 333-117335-19 77-0556245
Morgan Energy Center, LLC Delaware 333-117335-18 77-0555141
Pastoria Energy Facility L.L.C. Delaware 333-117335-17 77-0581976
Operator: BOD99999T
Calpine Pastoria Holdings, LLC Delaware 333-117335-16 77-0559247
Calpine Oneta Power, L.P. Delaware 333-117335-15 75-2815392
Calpine Oneta Power I, LLC Delaware 333-117335-14 75-2815390
Calpine Oneta Power II, LLC Delaware 333-117335-13 75-2815394
Zion Energy LLC Delaware 333-117335-12 36-4330312
CalGen Project Equipment Finance Company Three LLC Delaware 333-117335-11 10-0008436
CalGen Equipment Finance Holdings, LLC Delaware 333-117335-10 77-0555519
CalGen Equipment Finance Company, LLC Delaware 333-117335-01 77-0555523
Phone: (713) 869-9181
2
EDGAR 2
WNE INTEGRATED TYPESETTING SYSTEM Site: BOWNE OF HOUSTON, INC.
CRC: 42550
[E/O]
30311.SUB, DocName: 10-Q, Doc: 1, Page: 2
escription: Form 10-Q
ame: CALPINE
3. BOWNE INTEGRATED TYPESETTING SYSTEM Site: BOWNE OF HOUSTON, INC. Phone: (713) 869-9181 Operator: BOD99999T Date: 15-NOV-2005 13:40:14.09
BOD H30311 003.00.00.00 0/4
Name: CALPINE
[E/O] CRC: 57835
*H30311/003/4*
EDGAR 2
H30311.SUB, DocName: 10-Q, Doc: 1, Page: 3
Description: Form 10-Q
CALPINE GENERATING COMPANY, LLC
(a wholly-owned subsidiary of Calpine CalGen Holdings, Inc.)
REPORT ON FORM 10-Q
For the Quarter Ended September 30, 2005
INDEX
Page
No.
PART I — FINANCIAL INFORMATION
Item 1. Financial Statements 5
Consolidated Condensed Balance Sheets as of September 30, 2005 and December 31, 2004 5
Consolidated Condensed Statements of Operations for the Three Months and Nine Months Ended September 30, 2005 and
2004 6
Consolidated Condensed Statements of Cash Flows for the Nine Months Ended September 30, 2005 and 2004 7
Notes to Consolidated Condensed Financial Statements 9
Item 2. Management’s Discussion and Analysis of Financial Condition and Results of Operations 25
Item 3. Quantitative and Qualitative Disclosures About Market Risk 36
Item 4. Controls and Procedures 36
PART II — OTHER INFORMATION
Item 1. Legal Proceedings 37
Item 6. Exhibits 37
Signatures 38
Certification of CEO & President Pursuant to Rule 13a-14(a)
Date: 15-NOV-2005 13:40:14.09
Certification of VP & CFO Pursuant to Rule 13a-14(a)
Certification of CEO & CFO Pursuant to Section 1350
BOD H30311 003.00.00.00 0/4
3
*H30311/003/4*
Operator: BOD99999T
Phone: (713) 869-9181
EDGAR 2
WNE INTEGRATED TYPESETTING SYSTEM Site: BOWNE OF HOUSTON, INC.
CRC: 57835
[E/O]
30311.SUB, DocName: 10-Q, Doc: 1, Page: 3
escription: Form 10-Q
ame: CALPINE
4. BOWNE INTEGRATED TYPESETTING SYSTEM Site: BOWNE OF HOUSTON, INC. Phone: (713) 869-9181 Operator: BOD99999T Date: 15-NOV-2005 13:40:14.09
BOD H30311 004.00.00.00 0/4
Name: CALPINE
[E/O] CRC: 20983
*H30311/004/4*
EDGAR 2
H30311.SUB, DocName: 10-Q, Doc: 1, Page: 4
Description: Form 10-Q
Table of Contents
DEFINITIONS
As used in this Form 10-Q, the abbreviations contained herein have the meanings set forth below. Additionally, the terms, “CalGen,” “we,”
“us” and “our” refer to Calpine Generating Company, LLC and its subsidiaries, unless the context clearly indicates otherwise.
ABBREVIATION DEFINITION
Btu British thermal units
CalGen Calpine Generating Company, LLC
Calpine Calpine Corporation
CES Calpine Energy Services, L.P.
COD Commercial operations date
E&S Electricity and steam
EITF Emerging Issues Task Force
FASB Financial Accounting Standards Board
GAAP Generally accepted accounting principles
KW Kilowatt(s)
KWh Kilowatt hour(s)
LIBOR London Inter-Bank Offered Rate
LTSA Long Term Service Agreement
MMBtu Million Btu
MSCG Morgan Stanley Capital Group
MW Megawatt(s)
MWh Megawatt hour(s)
O&M Operations and maintenance
POX Plant operating expense
SAB Staff Accounting Bulletin
SEC Securities and Exchange Commission
Date: 15-NOV-2005 13:40:14.09
S&P Standard and Poor’s
Securities Act Securities Act of 1933, as amended
SFAS Statement of Financial Accounting Standards
BOD H30311 004.00.00.00 0/4
4
*H30311/004/4*
Operator: BOD99999T
Phone: (713) 869-9181
EDGAR 2
WNE INTEGRATED TYPESETTING SYSTEM Site: BOWNE OF HOUSTON, INC.
CRC: 20983
[E/O]
30311.SUB, DocName: 10-Q, Doc: 1, Page: 4
escription: Form 10-Q
ame: CALPINE
5. BOWNE INTEGRATED TYPESETTING SYSTEM Site: BOWNE OF HOUSTON, INC. Phone: (713) 869-9181 Operator: BOD99999T Date: 15-NOV-2005 13:40:14.09
BOD H30311 005.00.00.00 0/5
Name: CALPINE
[E/O] CRC: 13209
*H30311/005/5*
EDGAR 2
H30311.SUB, DocName: 10-Q, Doc: 1, Page: 5
Description: Form 10-Q
Table of Contents
PART I — FINANCIAL INFORMATION
Item 1. Financial Statements.
CALPINE GENERATING COMPANY, LLC
(a wholly-owned subsidiary of Calpine CalGen Holdings, Inc.)
CONSOLIDATED CONDENSED BALANCE SHEETS
September 30, 2005 and December 31, 2004
(Unaudited)
September 30, December 31,
2005 2004
(In thousands)
ASSETS
Current assets:
Cash and cash equivalents $ 158,955 $ 64,538
Restricted cash, current portion 58 —
Accounts receivable, net 96,570 59,320
Accounts receivable, net — related party 80,864 600
Notes receivable, current portion 394 367
Inventories 20,017 19,601
Current derivative assets 12,742 9,272
Prepaid and other current assets 10,628 21,169
Total current assets 380,228 174,867
Property, plant and equipment, net 6,256,315 6,294,429
Date: 15-NOV-2005 13:40:14.09
Notes receivable, net of current portion 19,082 19,381
Restricted cash, net of current portion 95 —
Deferred financing costs, net 42,920 51,496
BOD H30311 005.00.00.00 0/5
Long-term derivative assets 15,219 26,644
Deferred tax asset 17,672 17,672
Other assets 38,144 54,245
*H30311/005/5*
Total assets $ 6,769,675 $ 6,638,734
LIABILITIES & MEMBER’S EQUITY
Operator: BOD99999T
Current liabilities:
Accounts payable $ 127,336 $ 99,212
Notes payable, current portion 171 168
Accrued interest payable 83,394 53,324
Deferred tax liability 17,672 17,672
Other current liabilities 3,763 2,970
Phone: (713) 869-9181
Total current liabilities 232,336 173,346
Notes payable, net of current portion 1,943 2,109
Priority notes and term loans 2,396,720 2,395,332
Deferred revenue 7,832 5,671
Other liabilities 21,899 20,286
Total liabilities 2,660,730 2,596,744
Commitments and Contingencies (Note 10)
Member’s equity 4,108,945 4,041,990
Total liabilities and member’s equity $ 6,769,675 $ 6,638,734
EDGAR 2
WNE INTEGRATED TYPESETTING SYSTEM Site: BOWNE OF HOUSTON, INC.
CRC: 13209
The accompanying notes are an integral part of these Consolidated Condensed Financial Statements.
5
[E/O]
30311.SUB, DocName: 10-Q, Doc: 1, Page: 5
escription: Form 10-Q
ame: CALPINE
6. BOWNE INTEGRATED TYPESETTING SYSTEM Site: BOWNE OF HOUSTON, INC. Phone: (713) 869-9181 Operator: BOD99999T Date: 15-NOV-2005 13:40:14.09
BOD H30311 006.00.00.00 0/3
Name: CALPINE
[E/O] CRC: 38606
*H30311/006/3*
EDGAR 2
H30311.SUB, DocName: 10-Q, Doc: 1, Page: 6
Description: Form 10-Q
Table of Contents
CALPINE GENERATING COMPANY, LLC
(a wholly-owned subsidiary of Calpine CalGen Holdings, Inc.)
CONSOLIDATED CONDENSED STATEMENTS OF OPERATIONS
For the Three Months and Nine Months Ended September 30, 2005 and 2004
(Unaudited)
Three Months Ended Nine Months Ended
September 30, September 30,
2004 2004
2005 (Restated) 2005 (Restated)
(In thousands) (In thousands)
Revenue:
Electricity and steam revenue — related party $813,715 $428,888 $1,521,056 $ 942,784
Electricity and steam revenue — third-party 139,765 122,817 374,495 339,062
Total electricity and steam revenue 953,480 551,705 1,895,551 1,281,846
Mark-to-market activity, net (490) (574) (7,954) (2,495)
Sale of purchased power –– –– 5,459 2,860
Other revenue 824 824 2,472 2,472
Total revenue 953,814 551,955 1,895,528 1,284,683
Cost of revenue:
Plant operating expense — related party 46,737 38,056 161,764 134,781
Fuel expense — related party 680,004 385,347 1,358,039 887,575
Purchased power expense 269 446 7,582 3,014
Depreciation and amortization expense 48,022 39,224 132,390 110,960
Total cost of revenue 775,032 463,073 1,659,775 1,136,330
Date: 15-NOV-2005 13:40:14.09
Gross profit 178,782 88,882 235,753 148,353
Long-term service agreement cancellation charge –– — 23,860 —
Sales, general and administrative expense — related party 4,115 2,201 10,889 9,236
Income from operations 174,667 86,681 201,004 139,117
BOD H30311 006.00.00.00 0/3
Interest expense — related party –– — –– 72,173
Interest expense — third party 61,358 41,175 167,415 110,814
*H30311/006/3*
Interest (income) (1,582) (444) (2,979) (1,939)
Other expense (income), net 599 751 1,822 336
Income (loss) before income taxes 114,292 45,199 34,746 (42,267)
Income taxes — — — —
Operator: BOD99999T
Net income (loss) $114,292 $ 45,199 $ 34,746 $ (42,267)
The accompanying notes are an integral part of these Consolidated Condensed Financial Statements.
6
Phone: (713) 869-9181
EDGAR 2
WNE INTEGRATED TYPESETTING SYSTEM Site: BOWNE OF HOUSTON, INC.
CRC: 38606
[E/O]
30311.SUB, DocName: 10-Q, Doc: 1, Page: 6
escription: Form 10-Q
ame: CALPINE
7. BOWNE INTEGRATED TYPESETTING SYSTEM Site: BOWNE OF HOUSTON, INC. Phone: (713) 869-9181 Operator: BOD99999T Date: 15-NOV-2005 13:40:14.09
BOD H30311 007.00.00.00 0/7
Name: CALPINE
[E/O] CRC: 13286
*H30311/007/7*
EDGAR 2
H30311.SUB, DocName: 10-Q, Doc: 1, Page: 7
Description: Form 10-Q
Table of Contents
CALPINE GENERATING COMPANY, LLC
(a wholly-owned subsidiary of Calpine CalGen Holdings, Inc.)
CONSOLIDATED CONDENSED STATEMENTS OF CASH FLOWS
For the Nine Months Ended September 30, 2005 and 2004
(Unaudited)
Nine Months Ended
September 30,
2004
2005 (Restated) (1)
(In thousands)
Cash flows from operating activities:
Net income (loss) $ 34,746 $ (42,267)
Adjustments to reconcile net loss to net cash provided by operating activities:
Depreciation and amortization 132,390 110,960
Amortization of discount and deferred financing costs 9,499 7,238
Write-off of deferred financing costs — 12,457
Mark-to-market activities, net 7,954 2,495
Long-term service agreement cancellation charge 23,860 —
Interest on subordinated parent debt — 72,173
Change in operating assets and liabilities:
Accounts receivable, net (37,250) (5,248)
Accounts receivable, net — related party (67,994) 5,292
Inventories (416) (2,724)
Prepaid and other current assets (2,219) (12,403)
Other assets 5,928 (17,771)
Date: 15-NOV-2005 13:40:14.09
Accounts payable 30,221 30,277
Accrued interest payable 30,070 73,170
Other accrued liabilities 4,570 473
BOD H30311 007.00.00.00 0/7
Net cash provided by operating activities 171,359 234,122
Cash flows from investing activities:
(Increase) decrease in restricted cash (153) 152,290
*H30311/007/7*
Purchase of derivative asset –– (45,000)
Purchases of property, plant and equipment (76,623) (262,426)
Net cash used in investing activities (76,776) (155,136)
Operator: BOD99999T
Cash flows from financing activities:
Financing costs — (59,389)
Repayment of notes payable (166) (162)
Borrowings from subordinated parent debt — 46,813
Repayments of subordinated parent debt — (238,137)
Borrowings from project financing — 2,393,900
Borrowings from revolver line of credit — 117,500
Phone: (713) 869-9181
Repayments of revolver line of credit — (81,000)
Borrowings from credit facility — 178,995
Repayments of credit facility — (2,379,353)
Net cash used in financing activities (166) (20,833)
Net increase in cash and cash equivalents 94,417 58,153
Cash and cash equivalents, beginning of period 64,538 39,598
Cash and cash equivalents, end of period $158,955 $ 97,751
EDGAR 2
(1) Only individual line items in cash flows from operating activities have been restated. Cash flows from operating activities did not change
WNE INTEGRATED TYPESETTING SYSTEM Site: BOWNE OF HOUSTON, INC.
in total and cash flows from investing and financing activities were unaffected. See Note 3.
CRC: 13286
The accompanying notes are an integral part of these Consolidated Condensed Financial Statements.
7
[E/O]
30311.SUB, DocName: 10-Q, Doc: 1, Page: 7
escription: Form 10-Q
ame: CALPINE
8. BOWNE INTEGRATED TYPESETTING SYSTEM Site: BOWNE OF HOUSTON, INC. Phone: (713) 869-9181 Operator: BOD99999T Date: 15-NOV-2005 13:40:14.09
BOD H30311 008.00.00.00 0/4
Name: CALPINE
[E/O] CRC: 13888
*H30311/008/4*
EDGAR 2
H30311.SUB, DocName: 10-Q, Doc: 1, Page: 8
Description: Form 10-Q
Table of Contents
CALPINE GENERATING COMPANY, LLC
(a wholly-owned subsidiary of Calpine CalGen Holdings, Inc.)
CONSOLIDATED CONDENSED STATEMENTS OF CASH FLOWS (CONTINUED)
For the Nine Months Ended September 30, 2005 and 2004
(Unaudited)
Nine Months Ended
September 30,
2004
2005 (Restated)
(In thousands)
Supplemental cash flow information:
Cash paid during the period for:
Interest, net of amounts capitalized $132,434 $ 34,741
Non-cash transactions:
Interest on subordinated parent debt added to principal balance $ — $ 72,173
Capital expenditures included in accounts payable — 25,694
Financing costs contributed by parent — 5,407
Long term service agreement cancellation costs contributed by parent 30,900 —
Acquisition of property, plant and equipment through affiliate transfer 7,196 —
Transfer of property, plant and equipment in satisfaction of subordinated parent debt — 119,647
Conversion of subordinated parent debt to equity — 4,381,619
The accompanying notes are an integral part of these Consolidated Condensed Financial Statements.
Date: 15-NOV-2005 13:40:14.09
8
BOD H30311 008.00.00.00 0/4
*H30311/008/4*
Operator: BOD99999T
Phone: (713) 869-9181
EDGAR 2
WNE INTEGRATED TYPESETTING SYSTEM Site: BOWNE OF HOUSTON, INC.
CRC: 13888
[E/O]
30311.SUB, DocName: 10-Q, Doc: 1, Page: 8
escription: Form 10-Q
ame: CALPINE
9. BOWNE INTEGRATED TYPESETTING SYSTEM Site: BOWNE OF HOUSTON, INC. Phone: (713) 869-9181 Operator: BOD99999T Date: 15-NOV-2005 13:40:14.09
BOD H30311 009.00.00.00 0/2
Name: CALPINE
[E/O] CRC: 19136
*H30311/009/2*
EDGAR 2
H30311.SUB, DocName: 10-Q, Doc: 1, Page: 9
Description: Form 10-Q
Table of Contents
CALPINE GENERATION COMPANY, LLC
(a wholly-owned subsidiary of Calpine CalGen Holdings, Inc.)
NOTES TO CONSOLIDATED CONDENSED FINANCIAL STATEMENTS
September 30, 2005
(Unaudited)
1. Organization and Operations of the Company
Calpine Generating Company, LLC (the “Company” or “CalGen”), a Delaware limited liability company, is an indirect wholly-owned
subsidiary of Calpine Corporation (“Calpine” or the “Parent”). CalGen is engaged, through its subsidiaries, in ownership and operation of
electric power generation facilities and the sale of energy, capacity and related products in the United States of America. The purpose of these
Consolidated Condensed Financial Statements is to present the financial position, results of operations and cash flows of CalGen, which is
comprised of the 14 power projects (collectively, the “projects” or the “facilities”) listed below and other legal entities that are indirectly
owned by CalGen.
CalGen is comprised of the following 14 power projects (the dates represent commercial operation of the project): (1) Delta project near
Pittsburg, California, June 2002; (2) Goldendale project near Goldendale, Washington, September 2004; (3) Los Medanos project near
Pittsburg, California, August 2001; (4) Pastoria project near Kern County, California, Phase 1 May 2005, Phase 2 July 2005; (5) Baytown
project near Baytown, Texas, June 2002; (6) Channel project near Houston, Texas, Phase 1 August 2001, Phase 2 April 2002; (7) Corpus
Christi project located near Corpus Christi, Texas, October 2002; (8) Freestone project near Fairfield, Texas, Phase 1 June 2002, Phase 2
July 2002; (9) Carville project near St. Gabriel, Louisiana, June 2003; (10) Columbia project near Columbia, South Carolina, May 2004;
(11) Decatur project near Decatur, Alabama, Phase 1 June 2002, Phase 2 June 2003; (12) Morgan project near Morgan County, Alabama,
Phase 1 July 2003, Phase 2 January 2004; (13) Oneta project near Coweta, Oklahoma, Phase 1 July 2002, Phase 2 June 2003; and (14) Zion
project near Zion, Illinois, Phase 1 June 2002, Phase 2 June 2003. These facilities comprise substantially all of CalGen’s assets.
2. Basis of Interim Presentation
Date: 15-NOV-2005 13:40:14.09
The accompanying unaudited interim Consolidated Condensed Financial Statements of the Company have been prepared by the Company
pursuant to the rules and regulations of the Securities and Exchange Commission (“SEC”). In the opinion of management, the Consolidated
Condensed Financial Statements include the adjustments necessary to present fairly the information required to be set forth therein (which were
BOD H30311 009.00.00.00 0/2
all of a normal, recurring nature, except as described in Note 3). Certain information and footnote disclosures normally included in financial
statements prepared in accordance with Generally Accepted Accounting Principles in the United States of America (“GAAP”) have been
condensed or omitted from these statements pursuant to such rules and regulations and, accordingly, these financial statements should be read
*H30311/009/2*
in conjunction with the audited Consolidated Financial Statements of the Company for the year ended December 31, 2004, included in the
Company’s Annual Report on Form 10-K, certain of which has been restated as set forth in Note 3. The results for interim periods are not
necessarily indicative of the results for the entire year.
Operator: BOD99999T
CalGen’s financial statements for all periods reflect an allocation of charges for Calpine’s common expenditures. Such charges have been
made in accordance with Staff Accounting Bulletin (“SAB”) No. 55, “Allocation of Expenses and Related Disclosure in Financial Statements
of Subsidiaries, Divisions or Lesser Business Components of Another Entity.”
The accompanying unaudited interim Consolidated Condensed Financial Statements reflect all costs of doing business, including those
incurred by the Parent on CalGen’s behalf. Costs that are clearly identifiable as being applicable to CalGen have been allocated to CalGen and
are reimbursed to Calpine. The most significant costs included in this category include costs incurred during the construction phase of the
Phone: (713) 869-9181
facilities when salaries and other costs are charged directly to the related construction project. Costs of centralized departments that serve all
business segments have been allocated, where such charges would be material, using relevant allocation measures, primarily the base labor of
CalGen as a percentage of the consolidated base labor of the Parent. The most significant costs in this category include salary and benefits of
certain employees, legal and other professional fees, information technology costs and facilities costs, including office rent. Parent corporate
costs that clearly relate to other business segments of Calpine have not been allocated to CalGen. As further described in Note 10, certain
charges of $30.9 million associated with the termination of certain long-term service agreements related to major maintenance paid by Calpine
have been recorded as contributions from the Parent.
For all periods presented, CalGen accounted for income taxes associated with the projects using the separate return method, pursuant to
Financial Accounting Standards Board (“FASB”) Statement of Financial Accounting Standards (“SFAS”) No. 109, “Accounting for Income
EDGAR 2
Taxes.” (“SFAS No. 109”).
WNE INTEGRATED TYPESETTING SYSTEM Site: BOWNE OF HOUSTON, INC.
CRC: 19136
9
[E/O]
30311.SUB, DocName: 10-Q, Doc: 1, Page: 9
escription: Form 10-Q
ame: CALPINE
10. BOWNE INTEGRATED TYPESETTING SYSTEM Site: BOWNE OF HOUSTON, INC. Phone: (713) 869-9181 Operator: BOD99999T Date: 15-NOV-2005 13:40:14.09
BOD H30311 010.00.00.00 0/2
Name: CALPINE
[E/O] CRC: 15915
*H30311/010/2*
EDGAR 2
H30311.SUB, DocName: 10-Q, Doc: 1, Page: 10
Description: Form 10-Q
Table of Contents
CALPINE GENERATION COMPANY, LLC
(a wholly-owned subsidiary of Calpine CalGen Holdings, Inc.)
NOTES TO CONSOLIDATED CONDENSED FINANCIAL STATEMENTS
September 30, 2005
(Unaudited)
3. Restatement
In connection with the automation of its billing process, in the fourth quarter of 2004 the Company identified an error made in determining
payments due from Calpine Energy Services, L.P. (“CES”), a subsidiary of the Parent, to the Company for capacity pursuant to the Index
Based Gas Sale and Power Purchase Agreement (“Index Based Agreement”) and the WECC Fixed Price Gas Sale and Power Purchase
Agreement (the “Fixed Price Agreement”) among the Company, CES, and the subsidiaries of the Company named therein. The error caused
the Company to over-report revenue by approximately $16.9 million from March 23, 2004, the date of the 2004 Refinancing (as defined in
Note 4), until September 30, 2004. This error had no impact on Calpine’s financial statements because the revenue transactions between the
Company and CES are eliminated in Calpine’s consolidation. All amounts in this Form 10-Q for the three months and nine months ended
September 30, 2004 reflect the impact of this restatement.
CalGen bills for its power sales and gas purchases under the Index Based Agreement and the Fixed Price Agreement. Billings under these
agreements include payment for fixed capacity fees and variable energy and Operation and Maintenance (“O&M”) fees for all of CalGen’s
power plants. Capacity charges billed under the Fixed Price Agreement should have been deducted from amounts used to calculate the capacity
charges under the Index Based Agreement; however, an error occurred when capacity for two of the Company’s plants was inadvertently billed
under both agreements.
The following table reflects the originally reported and restated amounts for the three months and nine months ended September 30, 2004
(in thousands):
Date: 15-NOV-2005 13:40:14.09
Three Months Ended Nine Months Ended
September 30, 2004 September 30, 2004
As previously As previously
Restated reported(i) Restated reported(i)
Electricity and steam revenue-related party $428,888 $ 438,695 $ 942,784 $ 959,663
BOD H30311 010.00.00.00 0/2
Total revenue 551,955 561,762 1,284,683 1,301,562
Gross profit 88,882 98,689 148,353 165,232
*H30311/010/2*
Income from operations 86,681 96,488 139,117 155,996
Net income (loss) 45,199 55,006 (42,267) (25,388)
Operator: BOD99999T
(i) The consolidated condensed financial statements for the three months and nine months ended September 30, 2004 are herein restated to
correct revenue, gross profit, income from operations and net income (loss), which had been overstated due to the billing error discussed
above.
4. Summary of Significant Accounting Policies
Principles of Consolidation — The accompanying consolidated condensed financial statements include accounts of the Company and its
wholly-owned subsidiaries. The basis of consolidating the financial statements is common ownership of the facilities and other assets.
Phone: (713) 869-9181
Intercompany accounts and transactions are eliminated in the Consolidated Condensed Financial Statements.
Use of Estimates in Preparation of Financial Statements — The preparation of financial statements in conformity with GAAP requires
management to make estimates and assumptions that affect the reported amounts of assets and liabilities, disclosure of contingent assets and
liabilities at the date of the financial statements and the reported amounts of revenue and expense during the reporting period. Actual results
could differ from those estimates. The most significant estimates with regard to these financial statements relate to useful lives and carrying
values of assets, salvage value assumptions, tax valuation allowance, fair value calculations of derivative instruments, capitalization of interest,
impairment assessments, the outcome of pending litigation, the allocation of the Parent’s shared expenditures and the ability of CalGen to
recover the carrying value of the facilities.
EDGAR 2
Restricted Cash — CalGen is required to maintain cash balances that are restricted by regulatory provisions to which CalGen or its
WNE INTEGRATED TYPESETTING SYSTEM Site: BOWNE OF HOUSTON, INC.
subsidiaries are subject. These amounts are held by depository banks in order to comply with the contractual provisions requiring reserves for
CRC: 15915
environmental payments. Funds that can be used to satisfy obligations due during the next twelve months are classified as current restricted
cash, with the remainder classified as non-current restricted cash. The carrying value approximates fair value due to
10
[E/O]
30311.SUB, DocName: 10-Q, Doc: 1, Page: 10
escription: Form 10-Q
ame: CALPINE
11. BOWNE INTEGRATED TYPESETTING SYSTEM Site: BOWNE OF HOUSTON, INC. Phone: (713) 869-9181 Operator: BOD99999T Date: 15-NOV-2005 13:40:14.09
BOD H30311 011.00.00.00 0/5
Name: CALPINE
[E/O] CRC: 21001
*H30311/011/5*
EDGAR 2
H30311.SUB, DocName: 10-Q, Doc: 1, Page: 11
Description: Form 10-Q
Table of Contents
the short-term maturities of these balances. Such cash is excluded from cash and cash equivalents in the Consolidated Condensed Balance
Sheet and Statement of Cash Flows.
Effective Tax Rate — CalGen is a single member limited liability company that has been treated as a taxable entity for financial reporting
purposes. For all periods presented, the Company accounted for income taxes using the separate return method, pursuant to SFAS No. 109.
Under SFAS No. 109, a valuation allowance is recognized if, based on the weight of available evidence, it is more likely than not that some
portion or all of the deferred tax assets will not be realized. Because of significant historical net losses incurred by the Company, a valuation
allowance has been established for the entire amount of the excess of deferred tax assets over deferred tax liabilities. Accordingly, the
Company’s net deferred tax asset has been reduced to zero and any current period tax provision or benefit has been offset and reduced to zero.
The taxable income or loss of the Company is included with the consolidated income tax returns of Calpine Corporation. For the three months
and nine months ended September 30, 2005 and 2004, the effective rate was 0%.
Revenue Recognition — Capacity revenue is recognized monthly, based on each plant’s availability. Energy revenue is recognized upon
transmission or delivery to the customer. In addition to various third-party contracts, CalGen has entered into long-term power sales
agreements with CES, whereby CES purchases virtually all of the projects’ available electric energy and capacity (other than that sold under
third-party power and steam agreements) and provides the facilities substantially all of their required natural gas needs. For the period from
January 1, 2004 through March 23, 2004, for all fuel contracts where title for fuel did not transfer, the related power sales agreements were
accounted for as tolling agreements and the associated fuel costs were presented as a reduction of the related power revenues. In connection
with the issuance of the secured term loans and secured notes on March 23, 2004 (the “2004 Refinancing”), new contracts were executed with
CES. Under these new contracts, the title for fuel transfers to CalGen; therefore, they are not considered tolling agreements. As a result, the
projects record gross revenues and fuel expense. Steam is generated as a by-product at our facilities and revenue is recognized upon delivery to
the customer.
Under certain circumstances, CalGen is a party to a number of “buy-sell” transactions whereby CalGen purchases gas from a third-party,
sells the gas to CES at substantially the same price, and then repurchases the gas from CES at the contract price. Revenues from these
transactions are netted against the affiliated fuel expense. For the three-month period ended September 30, 2005, revenues of approximately
$177.4 million from these transactions were netted against $177.4 million of associated fuel expense. For the nine-month period ended
September 30, 2005, revenues of approximately $393.2 million from these transactions were netted against $393.2 million of associated fuel
Date: 15-NOV-2005 13:40:14.09
expense.
New Accounting Pronouncements
BOD H30311 011.00.00.00 0/5
SFAS No. 154
In May 2005, FASB issued SFAS No. 154, “Accounting Changes and Error Corrections.” This Statement replaces APB Opinion No. 20,
*H30311/011/5*
“Accounting Changes,” and FASB Statement No. 3, “Reporting Accounting Changes in Interim Financial Statements,” and changes the
requirements for the accounting for and reporting of a change in accounting principle. SFAS No. 154 applies to all voluntary changes in
accounting principle. Opinion No. 20 previously required that most voluntary changes in accounting principle be recognized by including in
Operator: BOD99999T
net income for the period of the change the cumulative effect of changing to the new accounting principle. SFAS No. 154 requires
retrospective application to prior periods’ financial statements of changes in accounting principle, unless it is impracticable to determine either
the period-specific effects or the cumulative effect of the change. When it is impracticable to determine the cumulative effect of applying a
change in accounting principle to all prior periods, SFAS No. 154 requires that the new accounting principle be applied as if it were adopted
prospectively from the earliest date practicable.
SFAS No. 154 also requires that a change in depreciation, amortization, or depletion method for long-lived, nonfinancial assets be
accounted for as a change in accounting estimate effected by a change in accounting principle. SFAS No. 154 is effective beginning after
Phone: (713) 869-9181
December 15, 2005. Adoption of this statement is not expected to materially impact the Division’s consolidated results of operations, cash
flows or financial position.
FIN 47
In March 2005, the FASB issued Interpretation No. 47, “Accounting for Conditional Asset Retirement Obligations,” (“FIN 47”) which is an
interpretation of SFAS No. 143, “Accounting for Asset Retirement Obligations.” FIN 47 clarifies the term “conditional asset retirement
obligation,” which refers to legal obligations for which companies must perform asset retirement activity for which the timing and/or method
of settlement are conditional upon future events that may or may not be within the control of the entity. However, the obligation to perform the
EDGAR 2
asset retirement is unconditional, despite the uncertainty that exists surrounding the timing and method of settlement. Uncertainty about the
WNE INTEGRATED TYPESETTING SYSTEM Site: BOWNE OF HOUSTON, INC.
timing and method of settlement for a conditional asset retirement obligation (“ARO”) should be considered in estimating the ARO when
sufficient information exists. FIN 47 clarifies when sufficient information exists to reasonably estimate the fair value of an ARO. FIN 47 is
CRC: 21001
effective no later than the end of the first fiscal year ending after December 15, 2005, and early adoption is encouraged. Adoption of this
statement is not expected to materially impact the Division’s consolidated results of operations, cash flows or financial position.
5. Property, Plant and Equipment, Net
[E/O]
As of September 30, 2005 and December 31, 2004, the components of property, plant and equipment, net, are stated at cost less
accumulated depreciation and amortization as follows (in thousands):
September 30, December 31,
2005 2004
30311.SUB, DocName: 10-Q, Doc: 1, Page: 11
Buildings, machinery and equipment $ 6,716,431 $ 5,917,575
Less: Accumulated depreciation and amortization (469,582) (338,172)
6,246,849 5,579,403
Land 7,854 7,854
Construction in progress 1,612 707,172
Property, plant and equipment, net $ 6,256,315 $ 6,294,429
escription: Form 10-Q
ame: CALPINE
Phase I of Pastoria went into operation during May 2005 and Phase II of Pastoria went into operation during July 2005. Amounts that were
recorded as construction in progress were transferred to buildings, machinery and equipment at that time.
12. BOWNE INTEGRATED TYPESETTING SYSTEM Site: BOWNE OF HOUSTON, INC. Phone: (713) 869-9181 Operator: BOD99999T Date: 15-NOV-2005 13:40:14.09
BOD H30311 011.00.00.00-1 0/5
Name: CALPINE
[E/O] CRC: 21001
*H30311/011/5*
EDGAR 2
H30311.SUB, DocName: 10-Q, Doc: 1, Page: 11
Description: Form 10-Q
Total depreciation and amortization expense for the three months ended September 30, 2005 and 2004 was $48.0 million and $39.2 million,
respectively. Total depreciation and amortization expense for the nine months ended September 30, 2005 and 2004 was $132.4 million and
$111.0 million, respectively.
Buildings, Machinery, and Equipment — This component primarily includes electric power plants and related equipment. Depreciation is
recorded utilizing the straight-line method over the estimated original composite useful life, generally 35 years for baseload power plants,
exclusive of the estimated salvage value, typically 10%. Zion, which is a peaking facility, is depreciated over 40 years, less the estimated
salvage value of 10%.
11
Date: 15-NOV-2005 13:40:14.09
BOD H30311 011.00.00.00-1 0/5
*H30311/011/5*
Operator: BOD99999T
Phone: (713) 869-9181
EDGAR 2
WNE INTEGRATED TYPESETTING SYSTEM Site: BOWNE OF HOUSTON, INC.
CRC: 21001
[E/O]
30311.SUB, DocName: 10-Q, Doc: 1, Page: 11
escription: Form 10-Q
ame: CALPINE
13. BOWNE INTEGRATED TYPESETTING SYSTEM Site: BOWNE OF HOUSTON, INC. Phone: (713) 869-9181 Operator: BOD99999T Date: 15-NOV-2005 13:40:14.09
BOD H30311 012.00.00.00 0/10
Name: CALPINE
[E/O] CRC: 47572
*H30311/012/10*
EDGAR 2
H30311.SUB, DocName: 10-Q, Doc: 1, Page: 12
Description: Form 10-Q
Table of Contents
Major Maintenance — The Company capitalizes costs for major turbine generator refurbishments for the “hot gas path section” and
compressor components, which include such significant items as combustor parts (e.g. fuel nozzles, transition pieces and “baskets”),
compressor blades, vanes and diaphragms. These refurbishments are done either under long term service agreements by the original equipment
manufacturer or by Calpine’s Turbine Maintenance Group. The capitalized costs are depreciated over their estimated useful lives. The
Company expenses annual planned maintenance.
Impairment Evaluation — All long-lived assets, such as property, plant and equipment, are reviewed for impairment whenever there is an
indication of a potential reduction in fair value. Factors that could trigger an impairment include significant underperformance relative to
historical or projected future operating results, significant changes in how the Company uses the acquired assets in its overall business strategy
and significant negative industry or economic trends.
The determination of whether impairment has occurred is based on an estimate of undiscounted cash flows attributable to the assets, as
compared to the carrying value of the assets. The significant assumptions used in the Company’s undiscounted future cash flow estimates
include the future supply and demand relationships for electricity and natural gas and the expected pricing for those commodities as well as the
resultant spark spreads in the various regions where the Company generates electricity. If an impairment has occurred, the amount of the
impairment loss recognized would be determined by estimating the fair value of the assets and recording a loss to the extent that the fair value
was less than the book value.
The Company’s assessment regarding the existence of impairment factors is based on market conditions, operational performance and legal
factors related to its projects. The Company’s review of factors present and the resulting appropriate carrying value of long-lived assets are
subject to judgments and estimates that management is required to make. No impairment charge has been recorded to date for any projects.
However, future events could cause us to conclude that impairment indicators exist and that long-lived assets might be impaired.
6. Notes Payable, Term Loans and Other Financings
On March 23, 2004, the Company completed its 2004 Refinancing in which the offerings of secured term loans and secured notes totaled
$2.4 billion. Net proceeds from the offerings were used to repay amounts outstanding under the $2.5 billion CCFC II revolving construction
credit facility (the “Construction Facility”), which was scheduled to mature in November 2004, and to pay fees and transaction costs associated
Date: 15-NOV-2005 13:40:14.09
with the 2004 Refinancing. The new secured notes (the “Notes”) and the new term loans (the “Loans”) are in several traunches and, except for
the 11.50% Third Priority Secured Notes Due 2011, carry a floating interest rate based on LIBOR plus a spread. The Third Priority Secured
Notes Due 2011 carry a fixed interest rate of 11.5%. The Notes and Loans comprise:
BOD H30311 012.00.00.00 0/10
Carrying Amount at
Face Amount Description Interest Rate September 30, 2005
*H30311/012/10*
$ 235.0 million First Priority Secured Floating Rate LIBOR plus 375 basis points $ 235.0 million
Notes Due 2009
$ 640.0 million Second Priority Secured Floating LIBOR plus 575 basis points $ 632.8 million
Rate Notes Due 2010
Operator: BOD99999T
$ 680.0 million Third Priority Secured Floating Rate LIBOR plus 900 basis points $ 680.0 million
Notes Due 2011
$ 150.0 million Third Priority Secured Notes Due 11.50% $ 150.0 million
2011
$ 600.0 million First Priority Secured Term Loans LIBOR plus 375 basis points(1) $ 600.0 million
due 2009
$ 100.0 million Second Priority Secured Term Loans LIBOR plus 575 basis points(2) $ 98.9 million
due 2010
Phone: (713) 869-9181
$ 2,405.0 million $ 2,396.7 million
(1) The Company may also elect a Base Rate plus 275 basis points.
(2) The Company may also elect a Base Rate plus 475 basis points.
The Loans and Notes described above are collateralized through a combination of pledges of the equity interests in CalGen and its first tier
subsidiary, CalGen Expansion Company, liens on the assets of CalGen’s power generating facilities (other than its Goldendale facility) and
related assets located throughout the United States. The lenders’ recourse is limited to such security and none of the indebtedness is guaranteed
EDGAR 2
by Calpine (see Note 11, Guarantor Subsidiaries — Supplemental Consolidating Financial Statements).
WNE INTEGRATED TYPESETTING SYSTEM Site: BOWNE OF HOUSTON, INC.
CRC: 47572
Other Financings
Concurrently with the refinancing, described above, the Company entered into an agreement with a group of banks led by The Bank of
Nova Scotia for a $200.0 million revolving credit facility (the “Revolving Credit Facility”). This three-year facility is
[E/O]
12
30311.SUB, DocName: 10-Q, Doc: 1, Page: 12
escription: Form 10-Q
ame: CALPINE