Measures of Central
Tendency:Unlocking
Data's Core
Delve into the fundamental statistical tools that reveal the true
'average' of your data.
2.
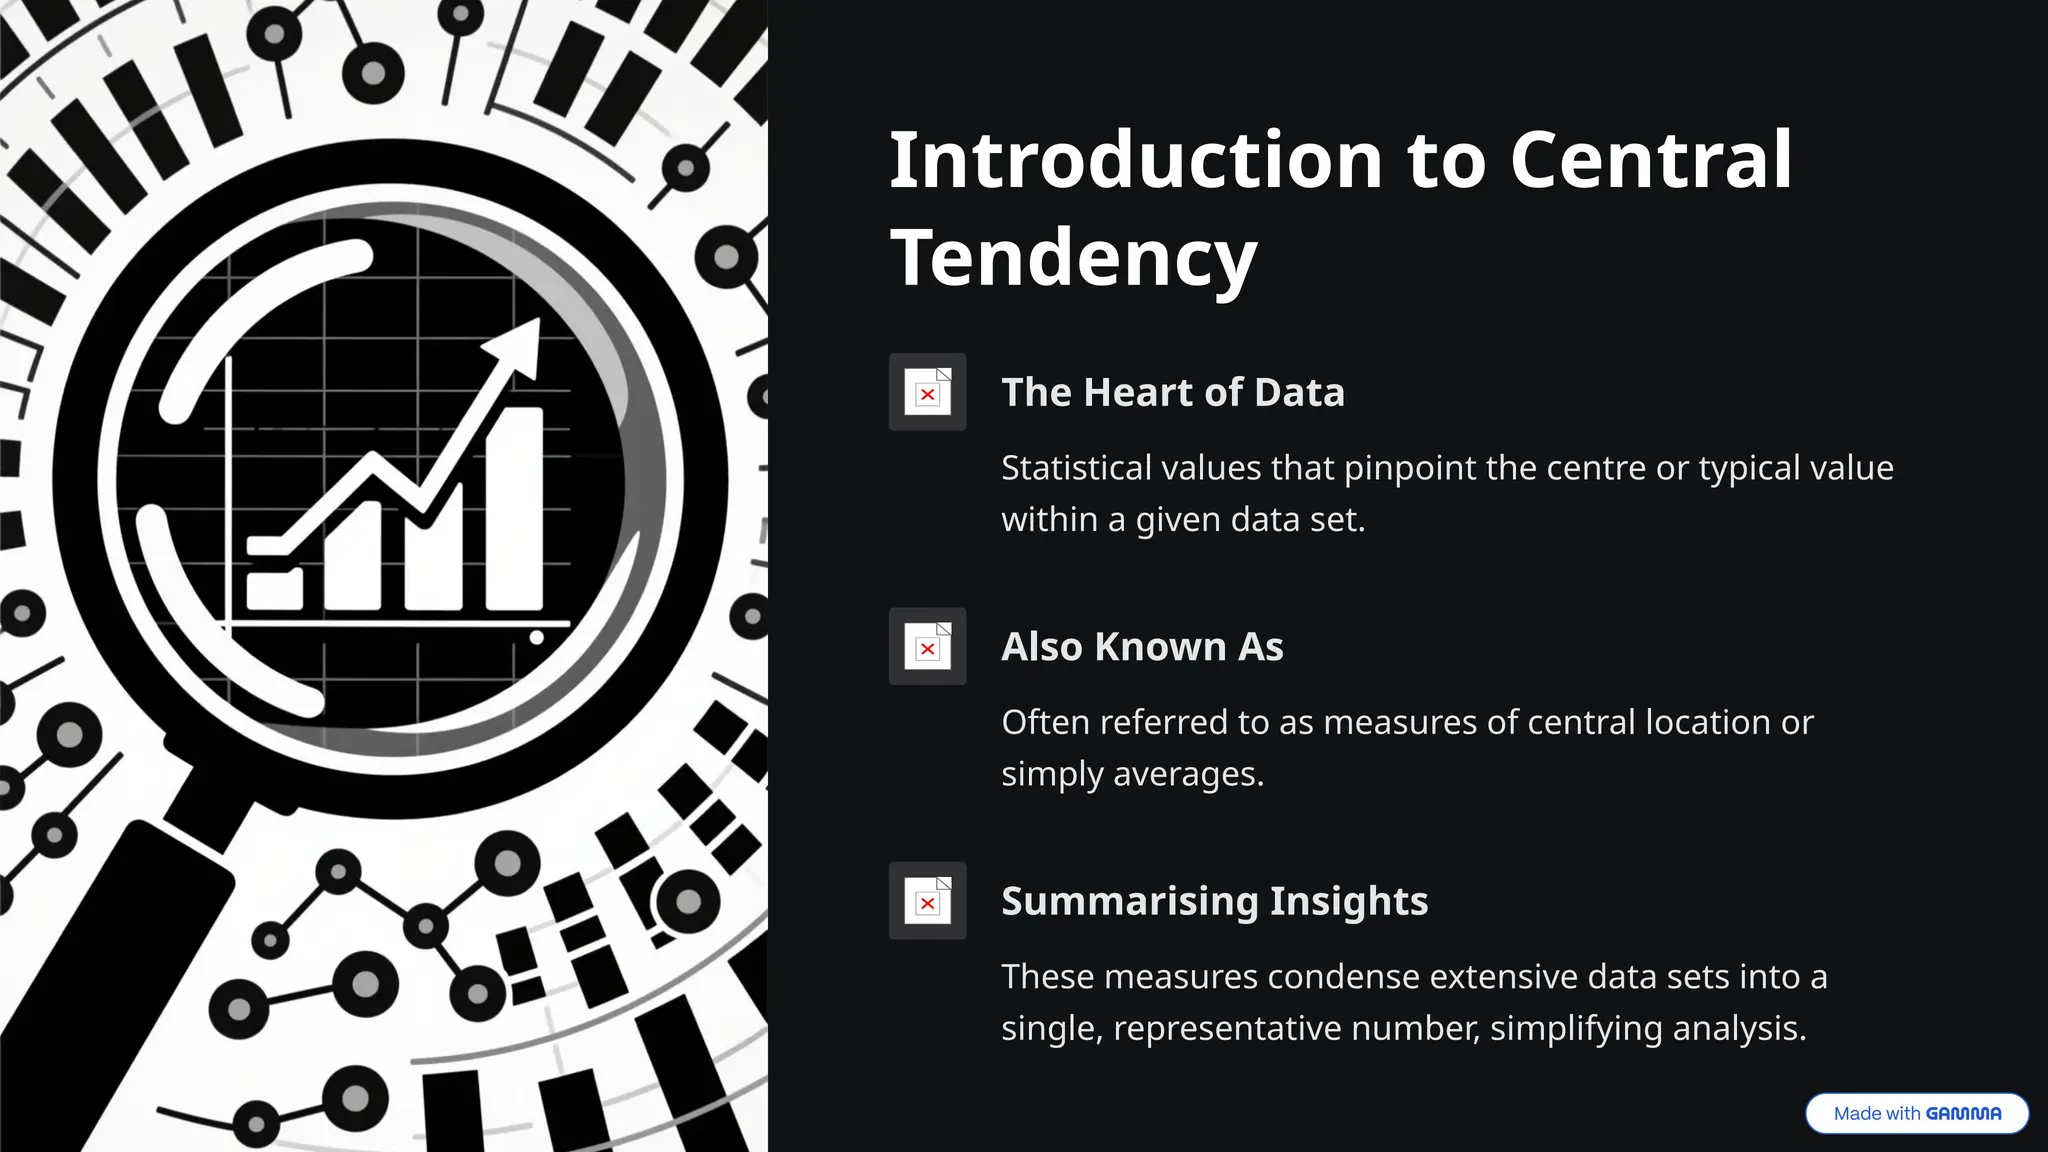
Introduction to Central
Tendency
TheHeart of Data
Statistical values that pinpoint the centre or typical value
within a given data set.
Also Known As
Often referred to as measures of central location or
simply averages.
Summarising Insights
These measures condense extensive data sets into a
single, representative number, simplifying analysis.
3.
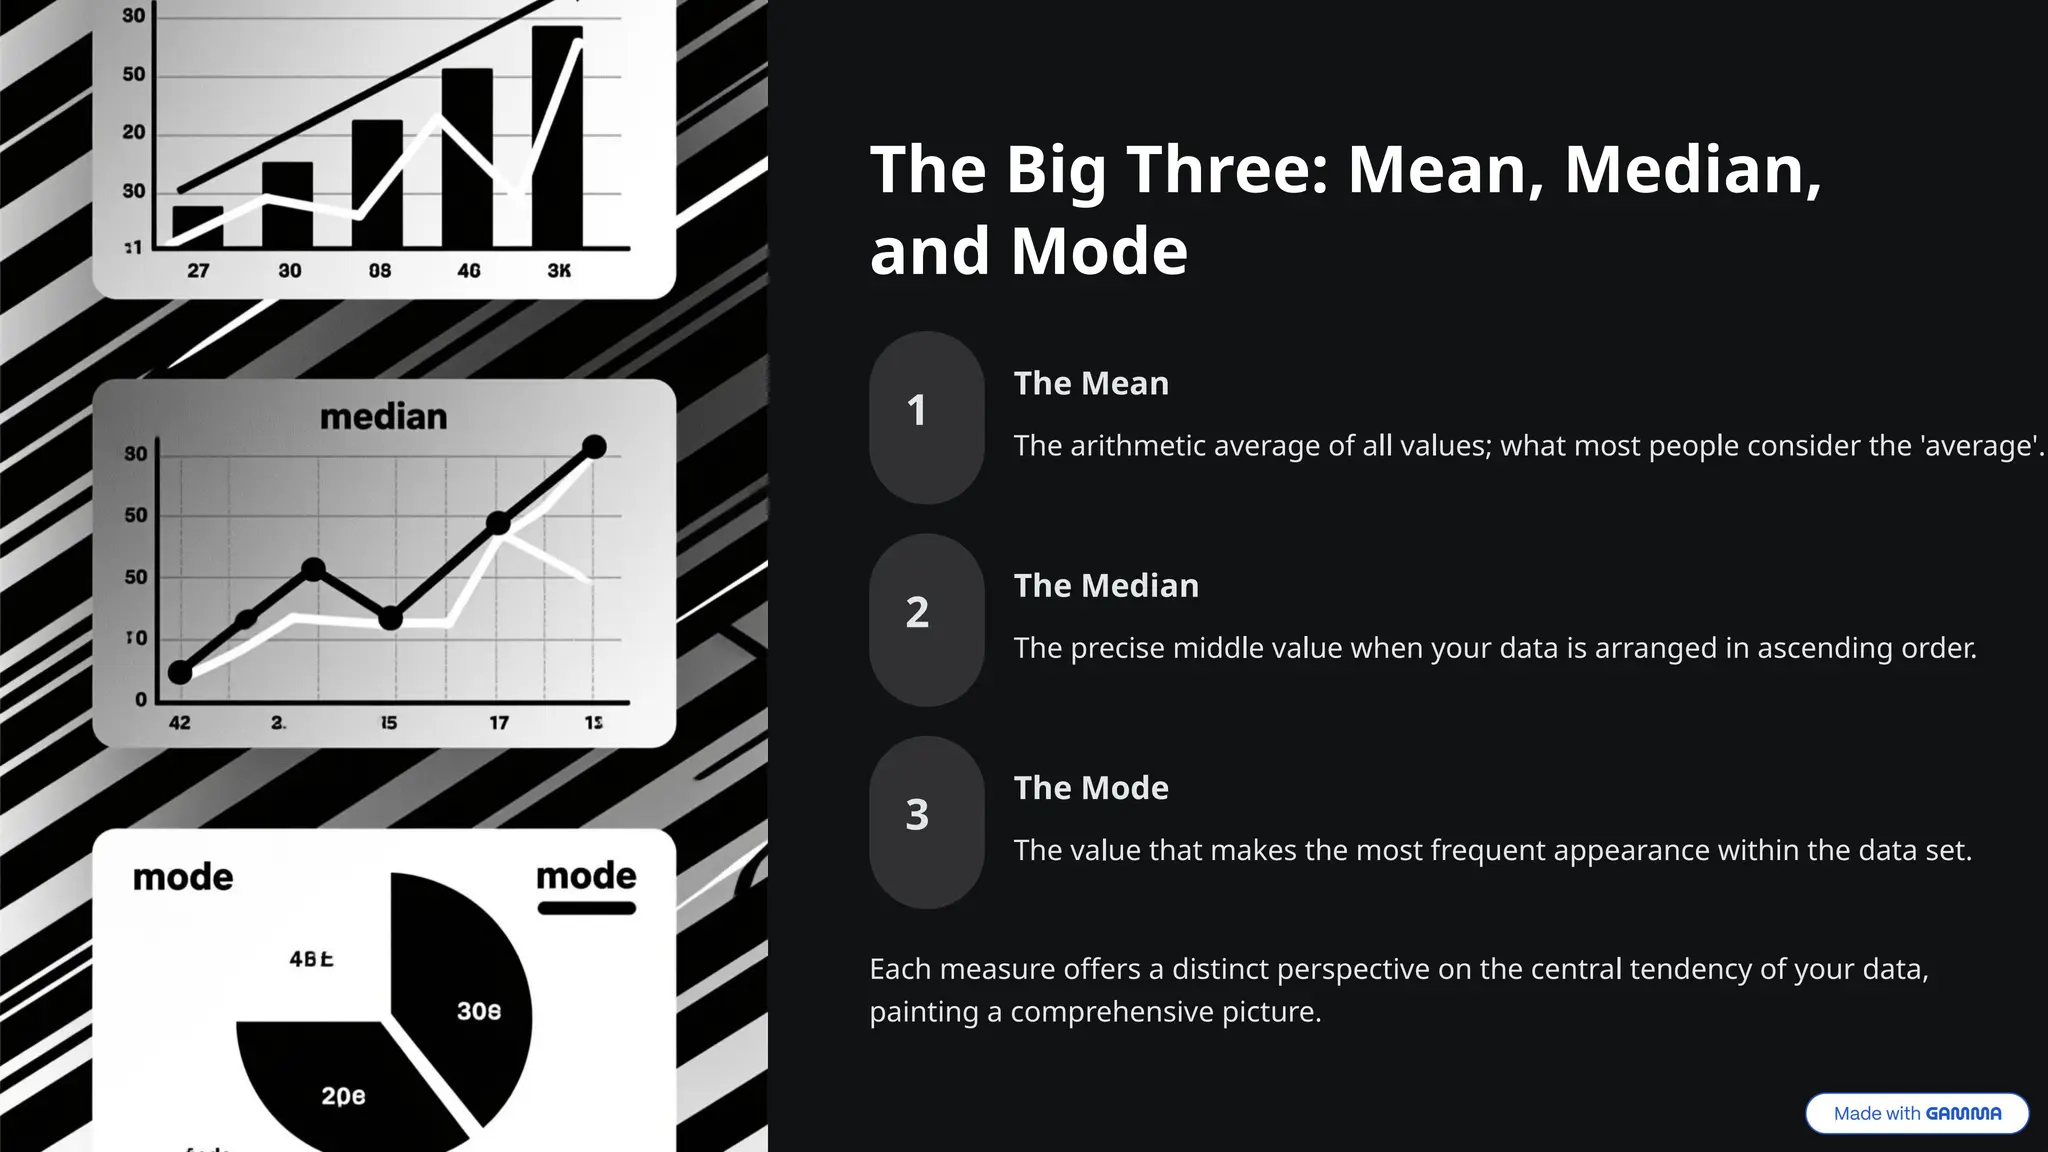
The Big Three:Mean, Median,
and Mode
1
The Mean
The arithmetic average of all values; what most people consider the 'average'.
2
The Median
The precise middle value when your data is arranged in ascending order.
3
The Mode
The value that makes the most frequent appearance within the data set.
Each measure offers a distinct perspective on the central tendency of your data,
painting a comprehensive picture.
4.
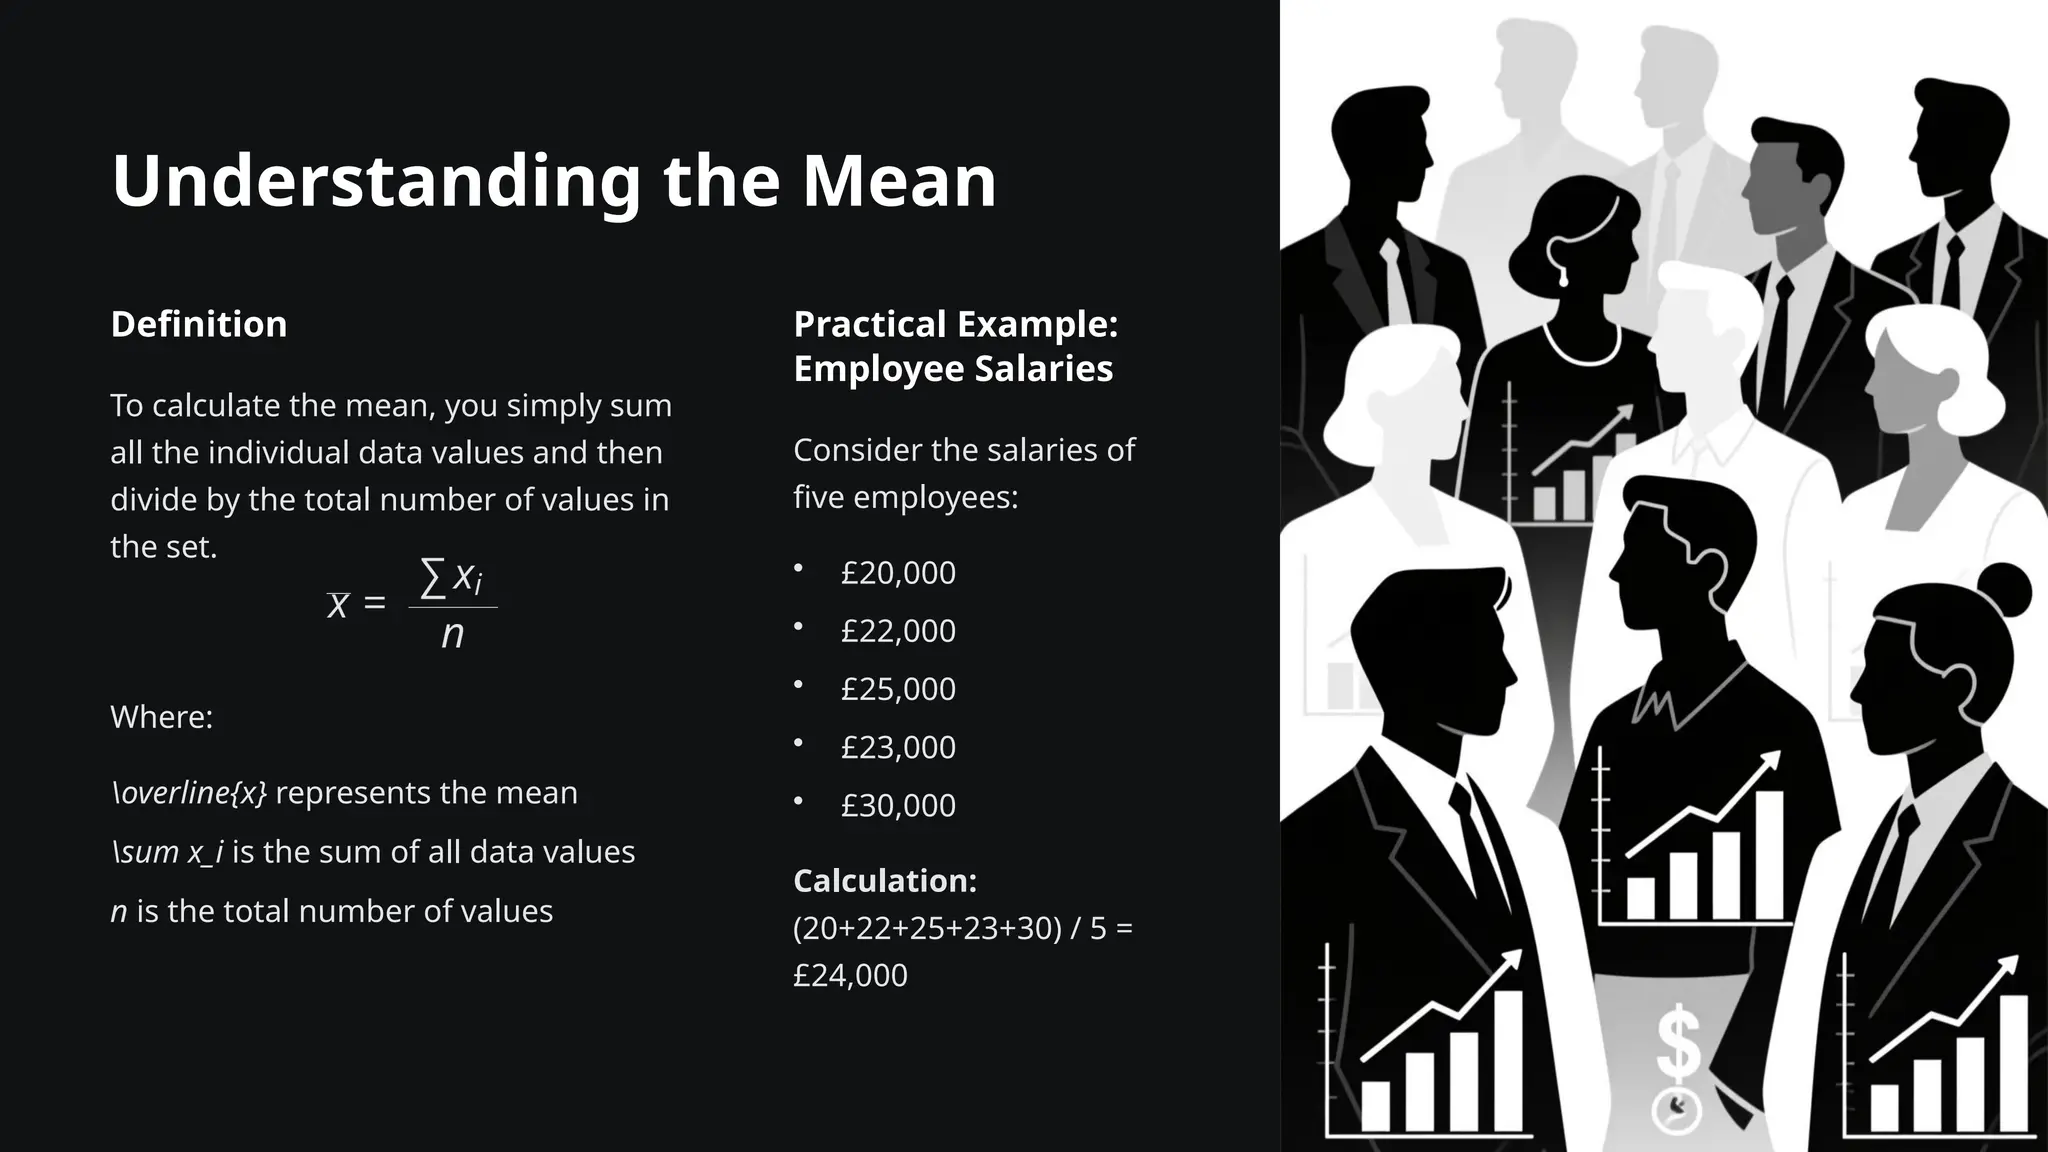
Understanding the Mean
Definition
Tocalculate the mean, you simply sum
all the individual data values and then
divide by the total number of values in
the set.
Where:
overline{x} represents the mean
sum x_i is the sum of all data values
n is the total number of values
Practical Example:
Employee Salaries
Consider the salaries of
five employees:
• £20,000
• £22,000
• £25,000
• £23,000
• £30,000
Calculation:
(20+22+25+23+30) / 5 =
£24,000
5.
The Mean's Sensitivityto Outliers
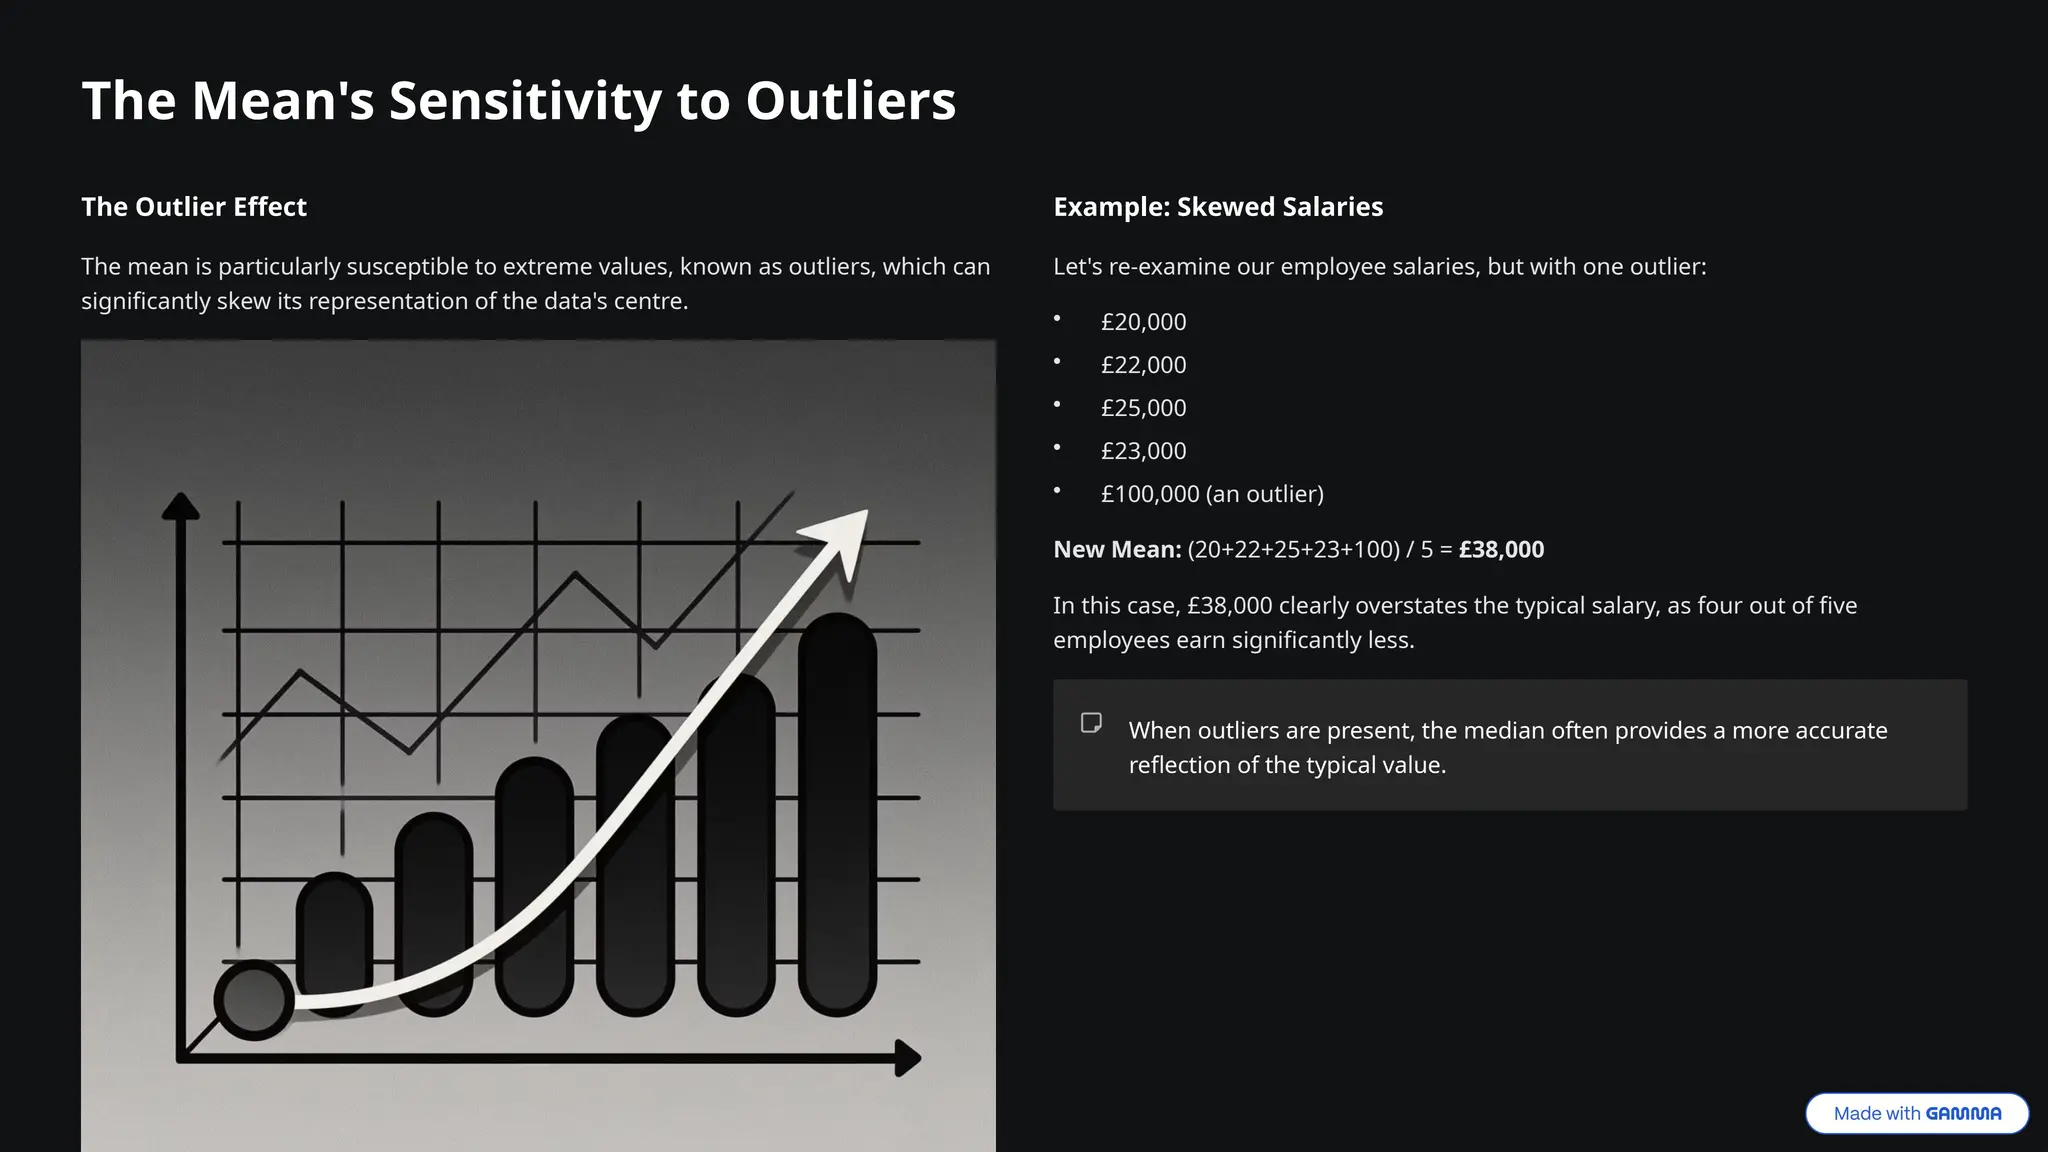
The Outlier Effect
The mean is particularly susceptible to extreme values, known as outliers, which can
significantly skew its representation of the data's centre.
Example: Skewed Salaries
Let's re-examine our employee salaries, but with one outlier:
• £20,000
• £22,000
• £25,000
• £23,000
• £100,000 (an outlier)
New Mean: (20+22+25+23+100) / 5 = £38,000
In this case, £38,000 clearly overstates the typical salary, as four out of five
employees earn significantly less.
When outliers are present, the median often provides a more accurate
reflection of the typical value.
6.
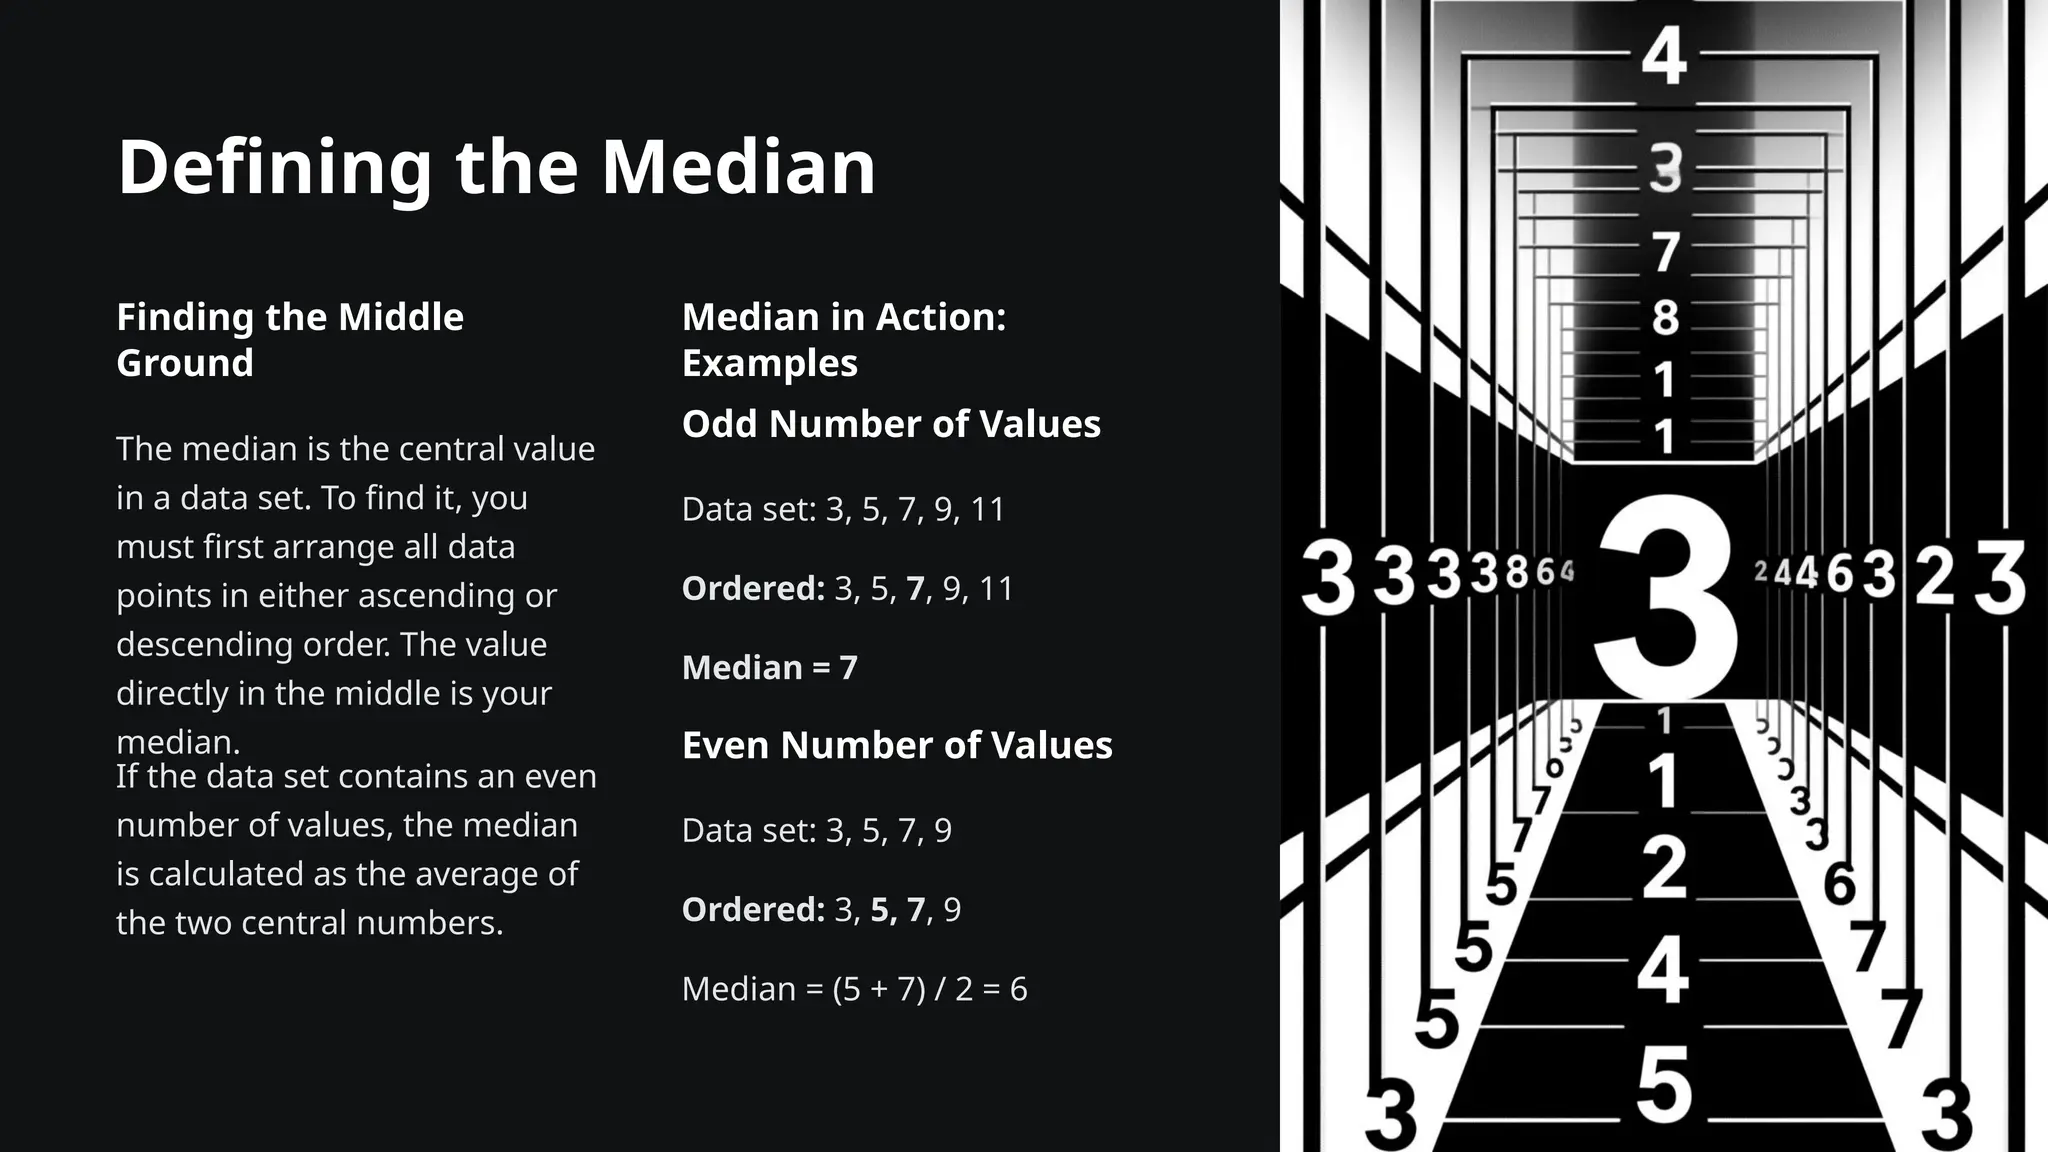
Defining the Median
Findingthe Middle
Ground
The median is the central value
in a data set. To find it, you
must first arrange all data
points in either ascending or
descending order. The value
directly in the middle is your
median.
If the data set contains an even
number of values, the median
is calculated as the average of
the two central numbers.
Median in Action:
Examples
Odd Number of Values
Data set: 3, 5, 7, 9, 11
Ordered: 3, 5, 7, 9, 11
Median = 7
Even Number of Values
Data set: 3, 5, 7, 9
Ordered: 3, 5, 7, 9
Median = (5 + 7) / 2 = 6
7.
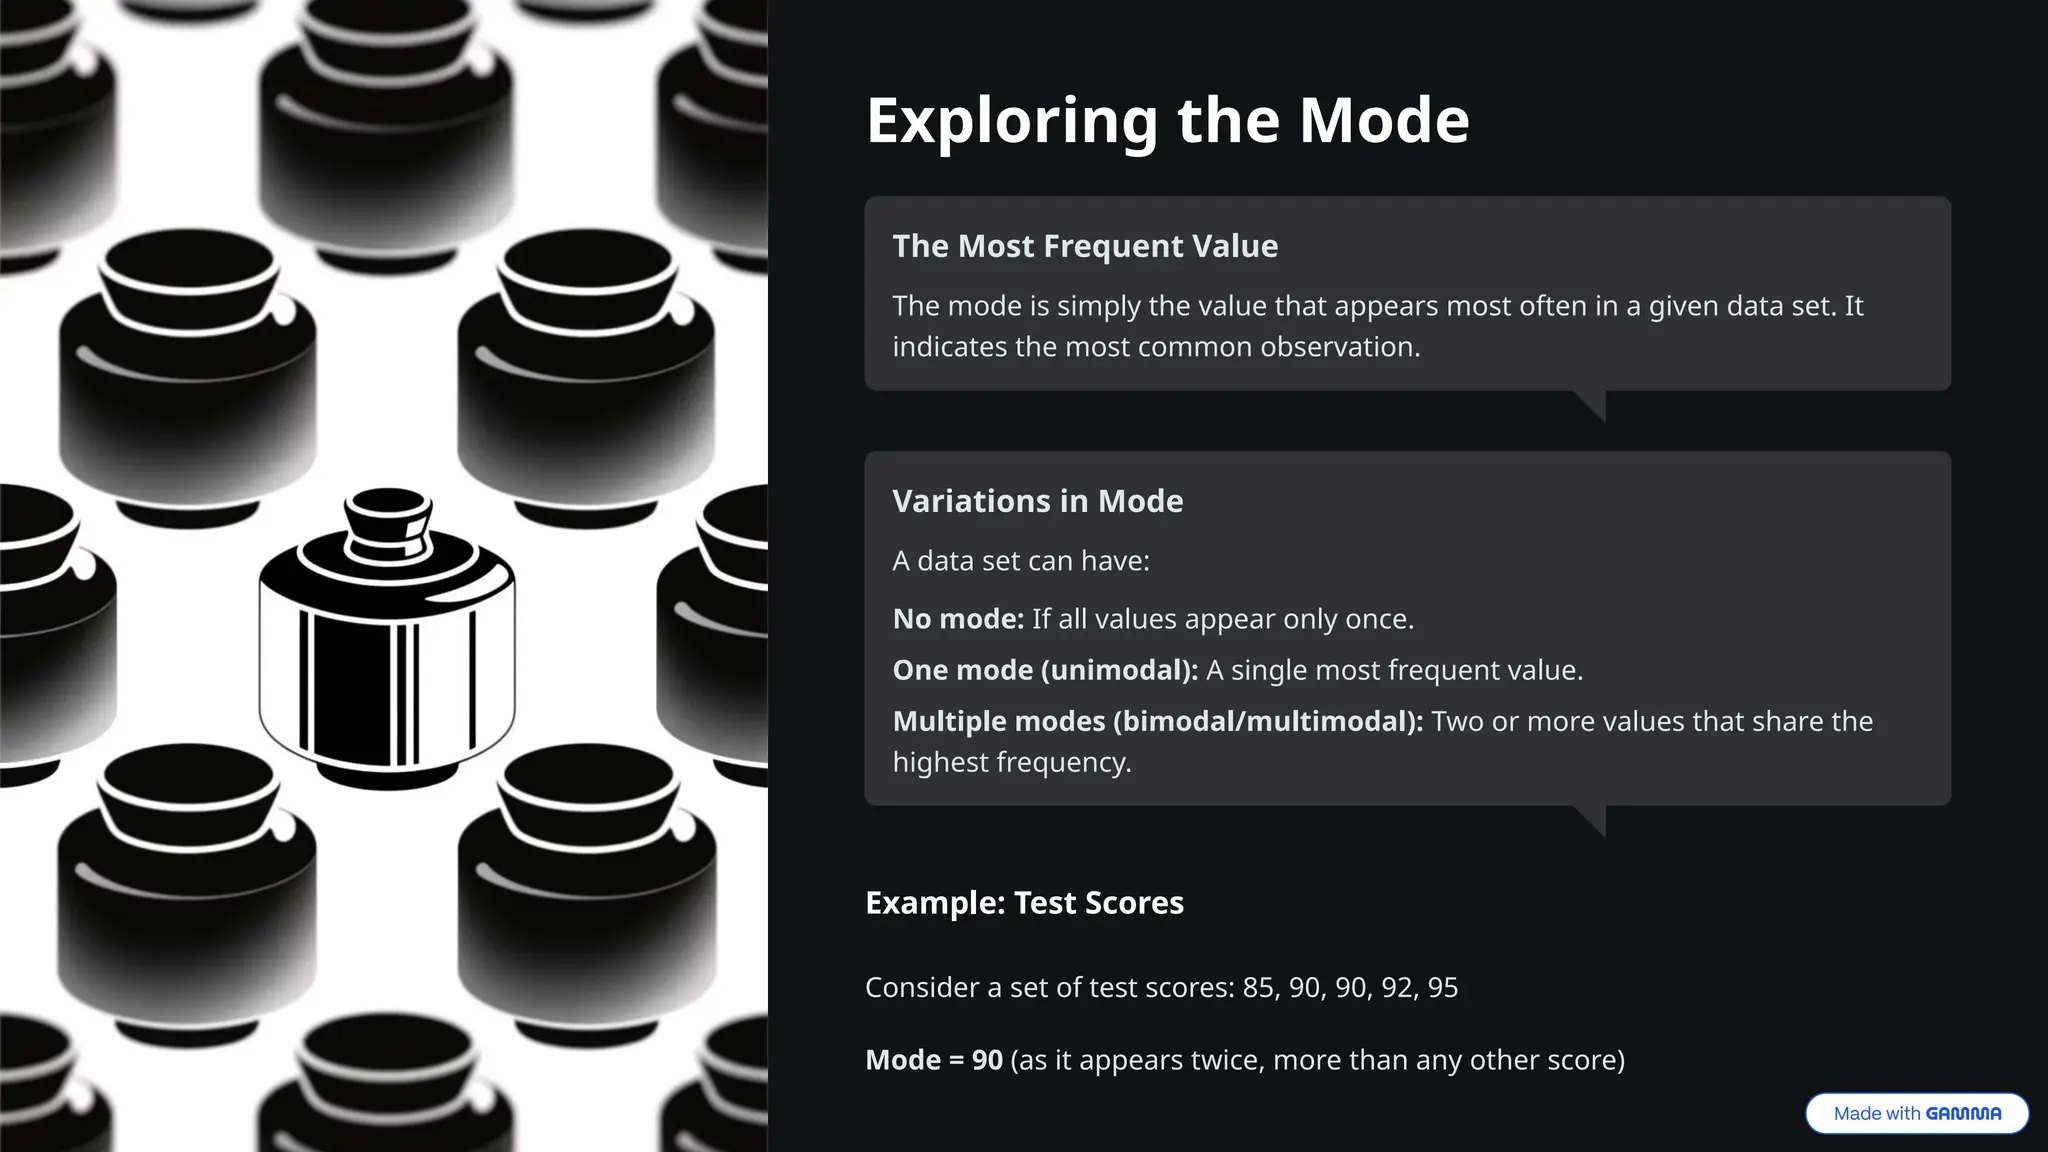
Exploring the Mode
TheMost Frequent Value
The mode is simply the value that appears most often in a given data set. It
indicates the most common observation.
Variations in Mode
A data set can have:
No mode: If all values appear only once.
One mode (unimodal): A single most frequent value.
Multiple modes (bimodal/multimodal): Two or more values that share the
highest frequency.
Example: Test Scores
Consider a set of test scores: 85, 90, 90, 92, 95
Mode = 90 (as it appears twice, more than any other score)
8.
Choosing the RightMeasure
Mean
Ideal for data that exhibits a
symmetric or normal distribution,
especially when there are no
significant outliers.
Median
The preferred choice for
skewed data distributions or
when extreme values (outliers)
might distort the mean.
Mode
Most useful for categorical data
or when you need to identify the
most popular or frequently
occurring items.
Your understanding of the data's inherent shape and characteristics should always guide your selection of the most
appropriate measure of central tendency.
9.
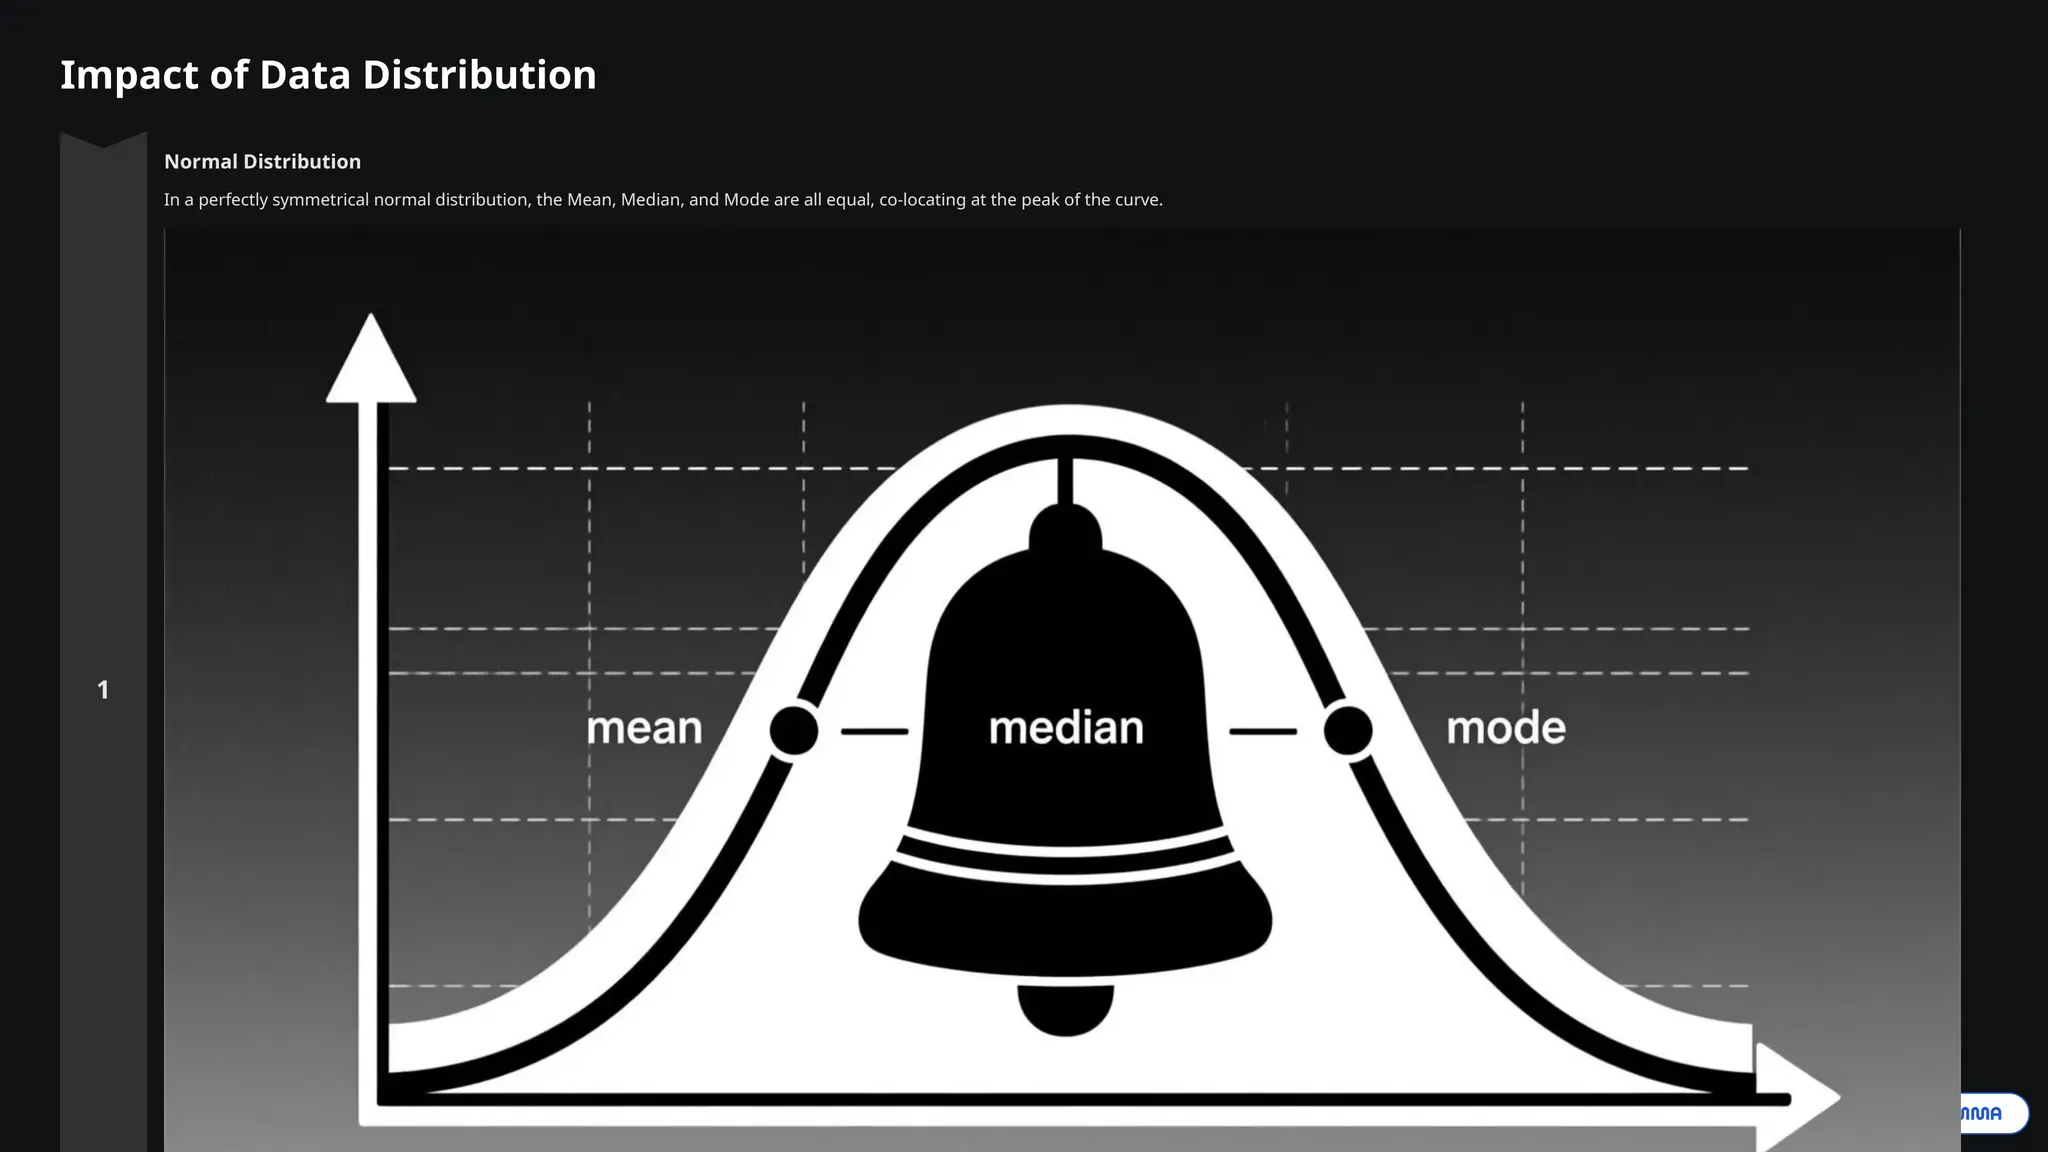
Impact of DataDistribution
Normal Distribution
In a perfectly symmetrical normal distribution, the Mean, Median, and Mode are all equal, co-locating at the peak of the curve.
10.
Conclusion: Mastering Data'sStory
Simplify Complexity
Central tendency measures distil
complex data into easily digestible
and understandable insights.
Enable Comparison
They facilitate effective comparisons
between different groups or data
sets, aiding in informed decision-
making.
Ensure Accuracy
A deep understanding of their
strengths and limitations is crucial
for accurate interpretation of your
findings.
Unlock Data's Narrative
Mastering these fundamental tools
empowers you to uncover the
hidden stories and patterns within
your data.