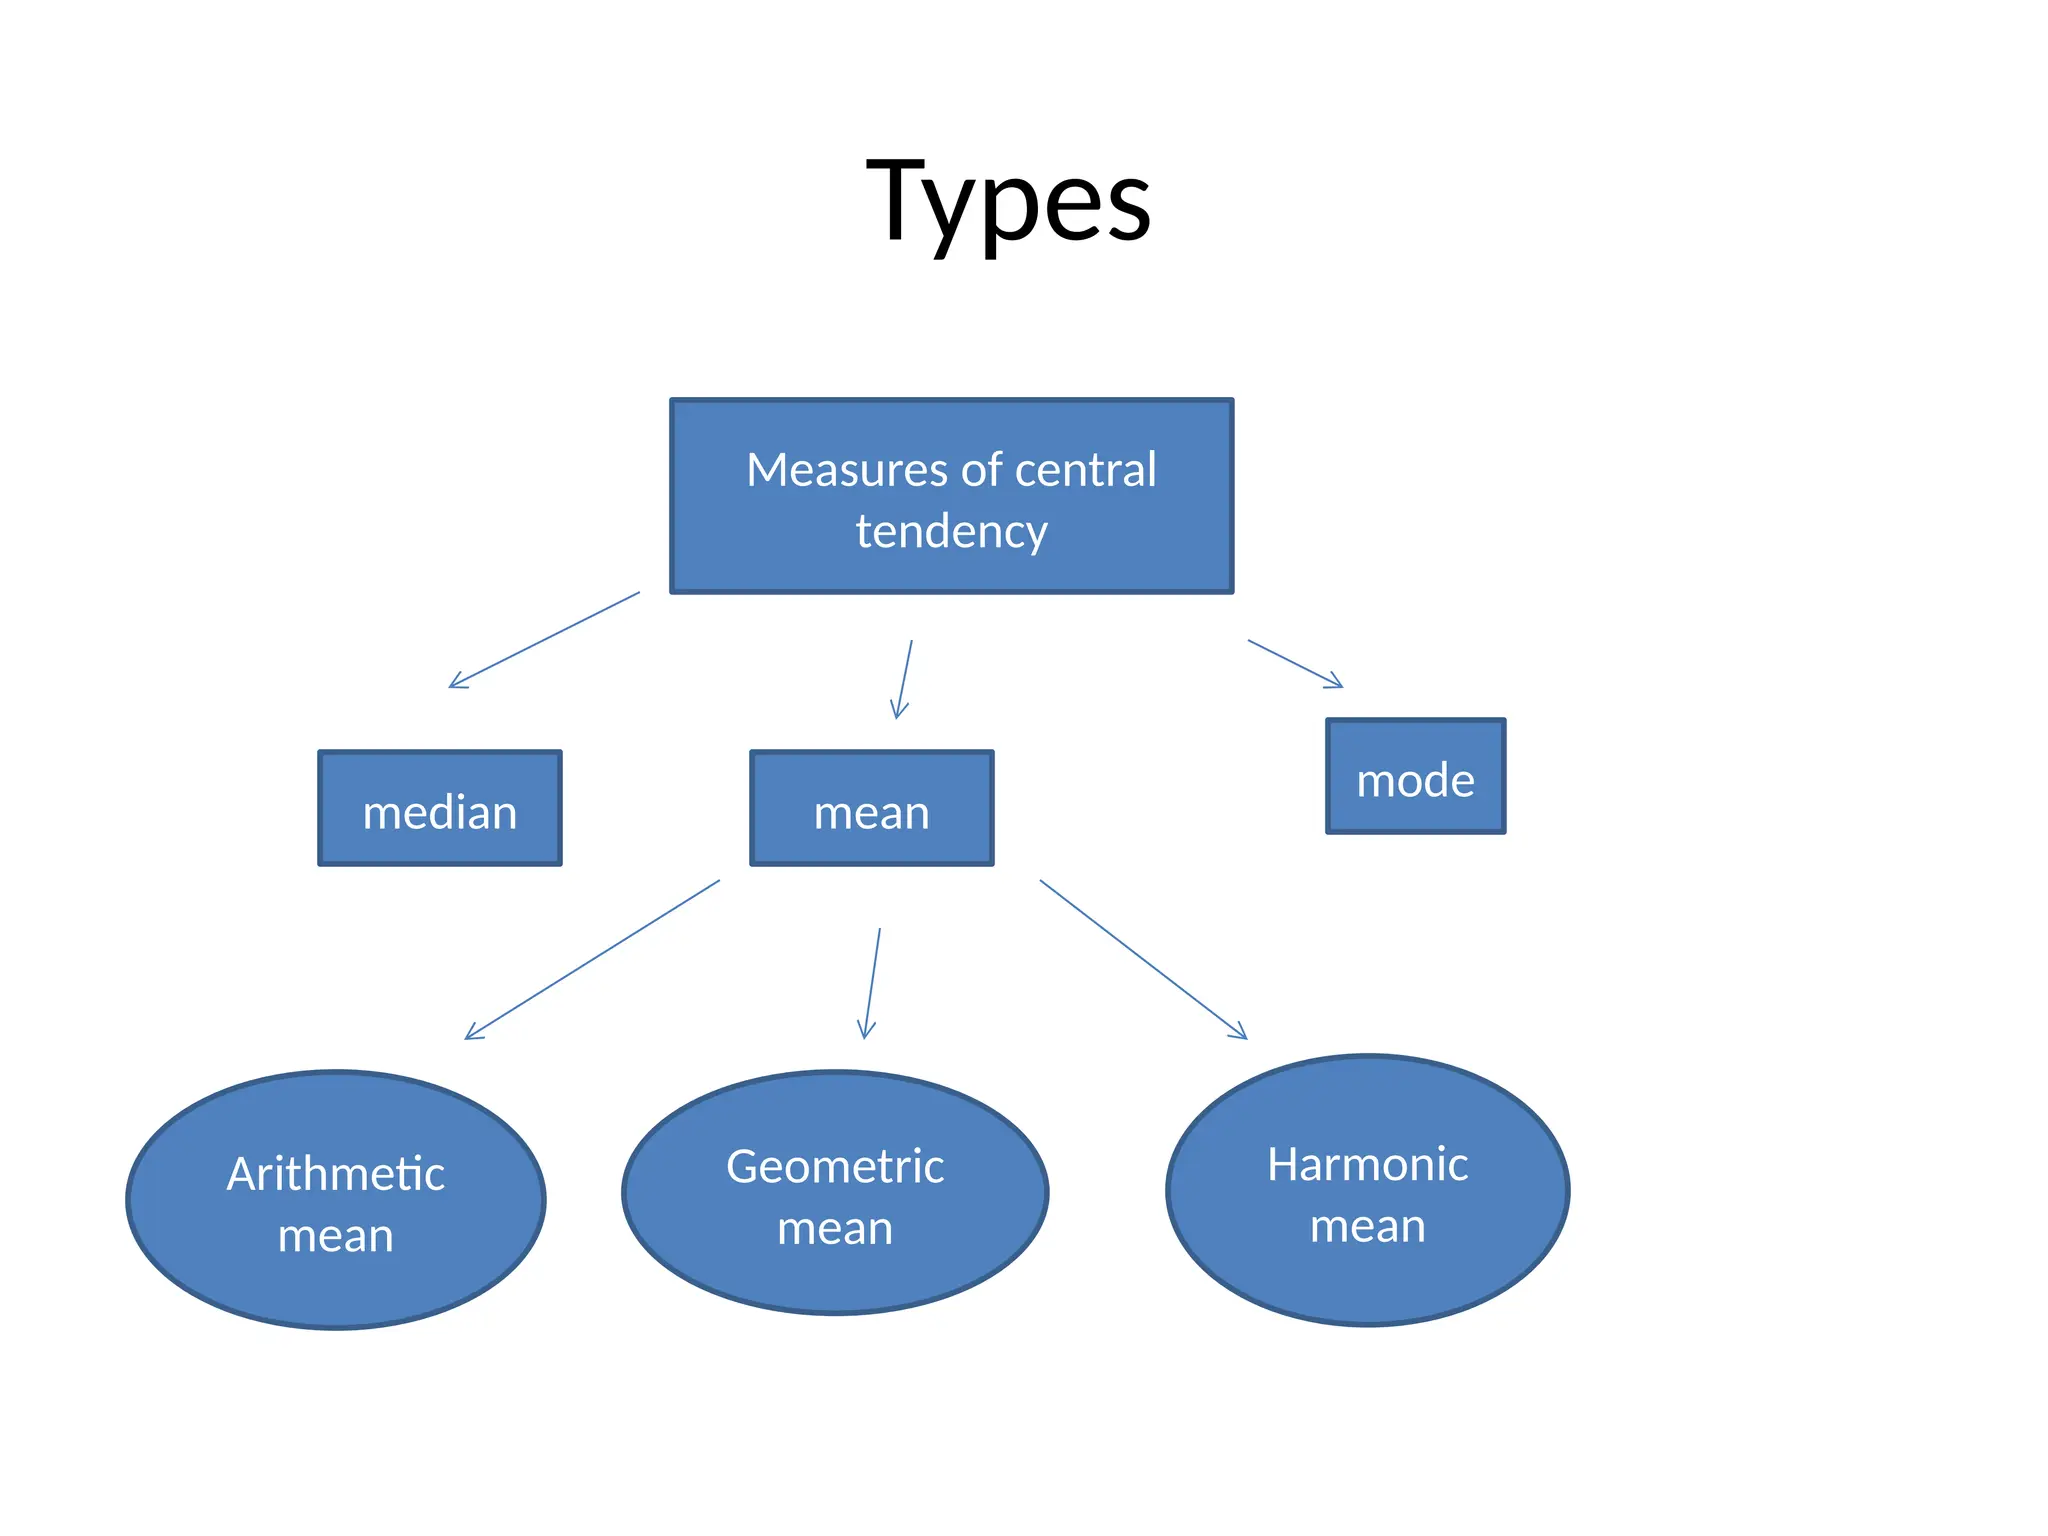
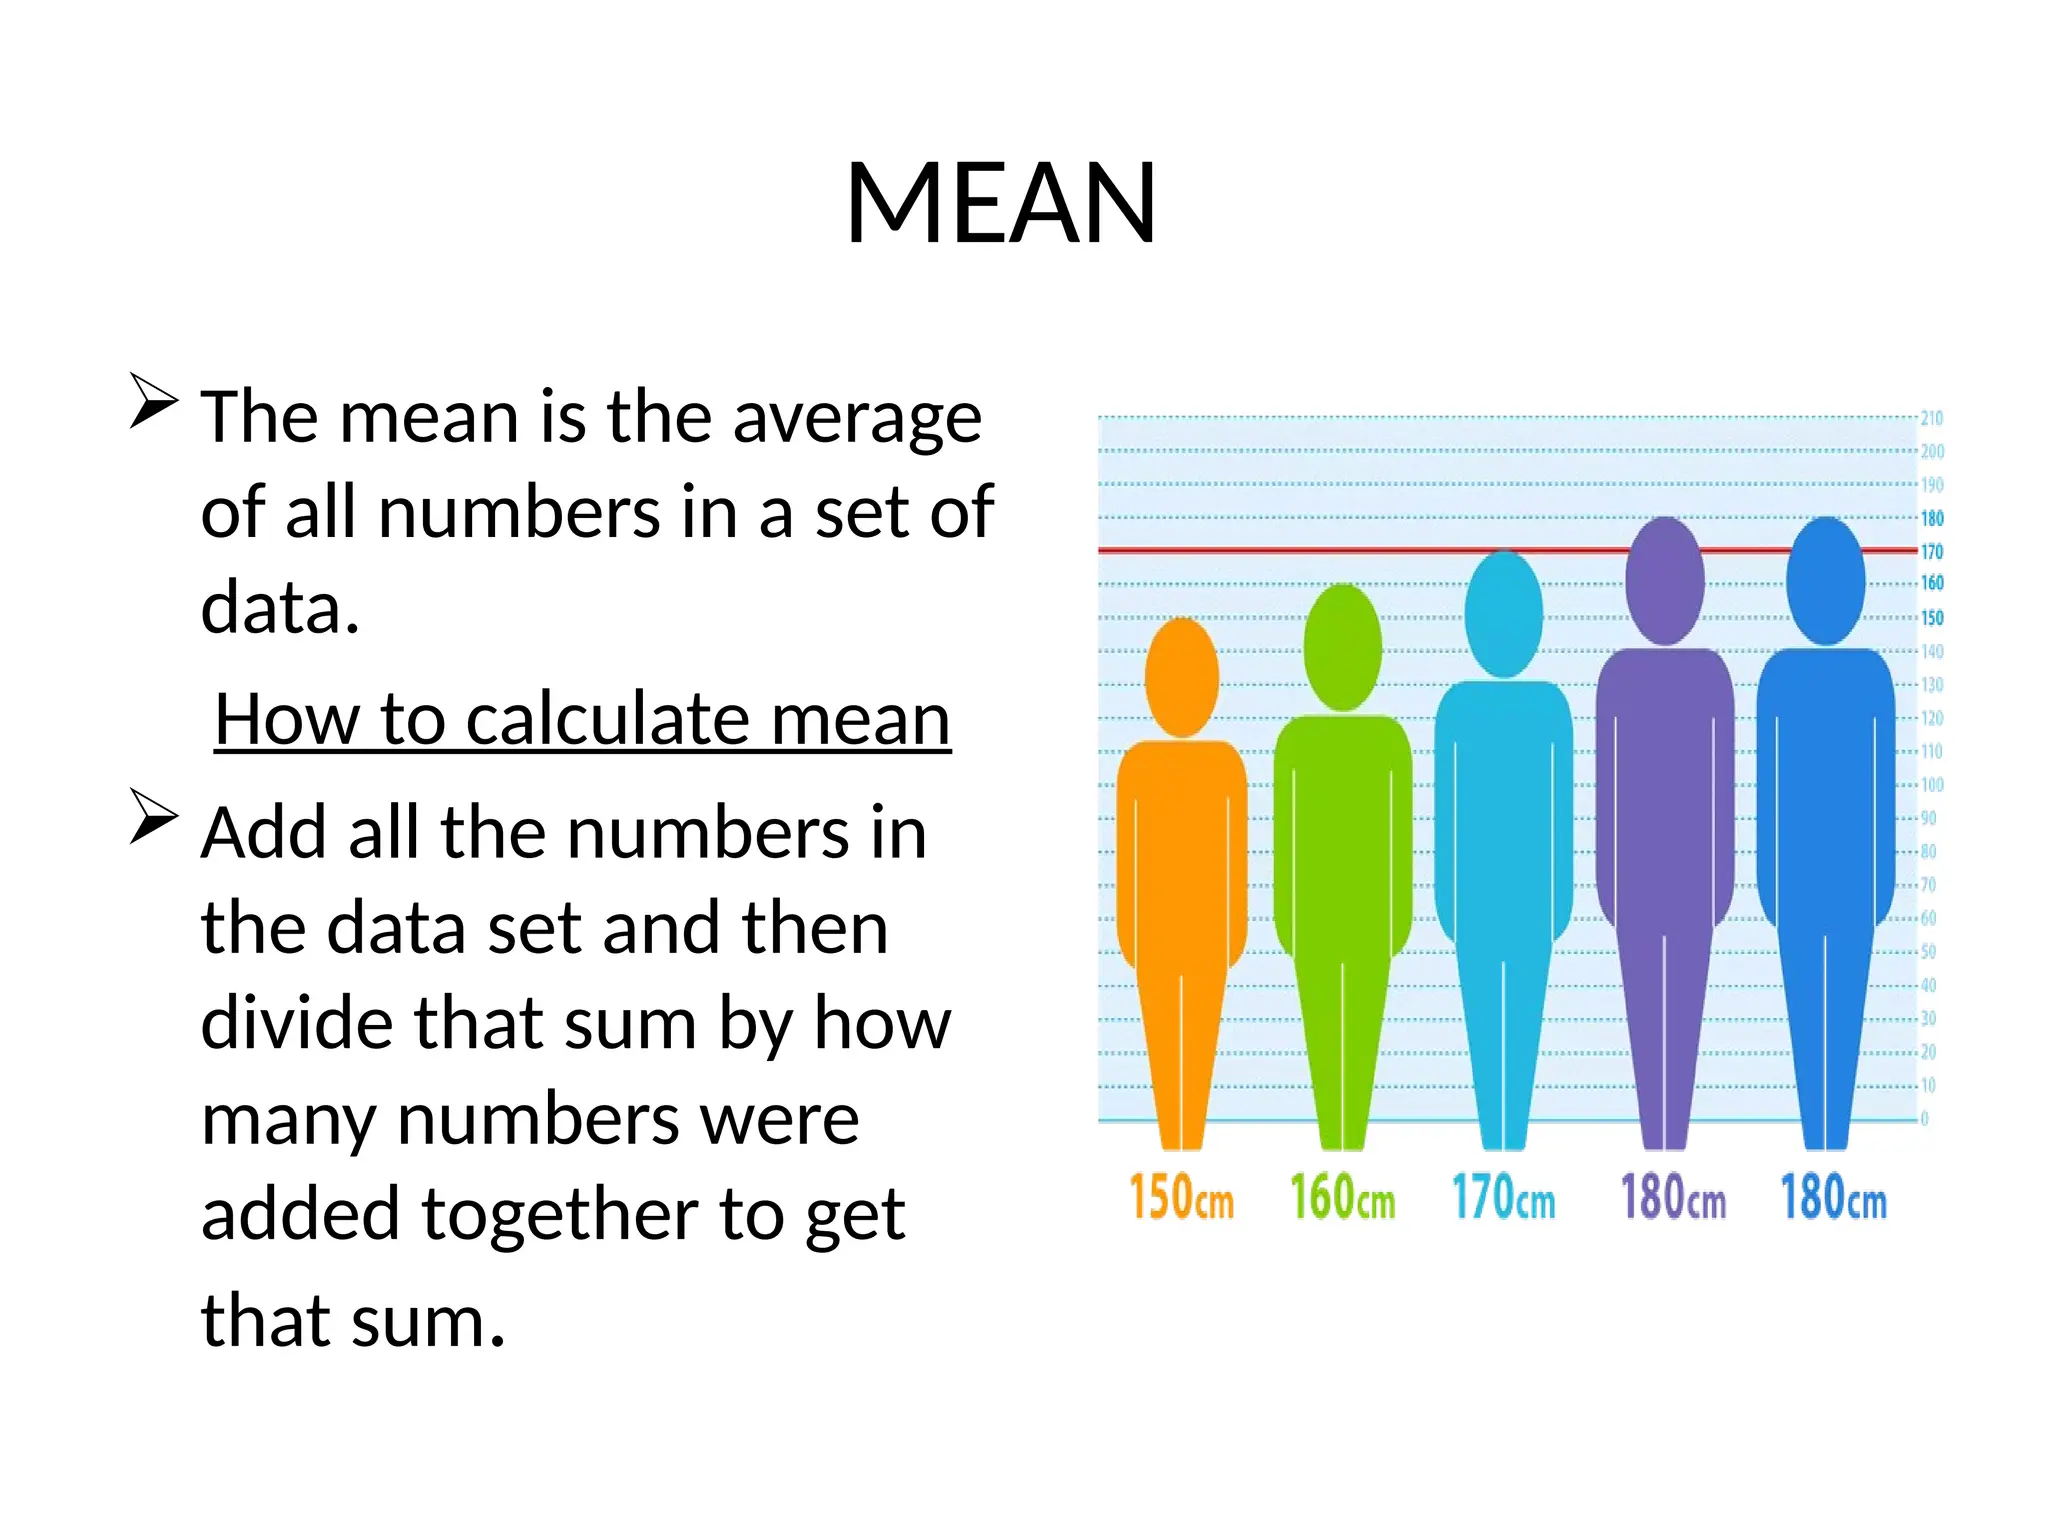
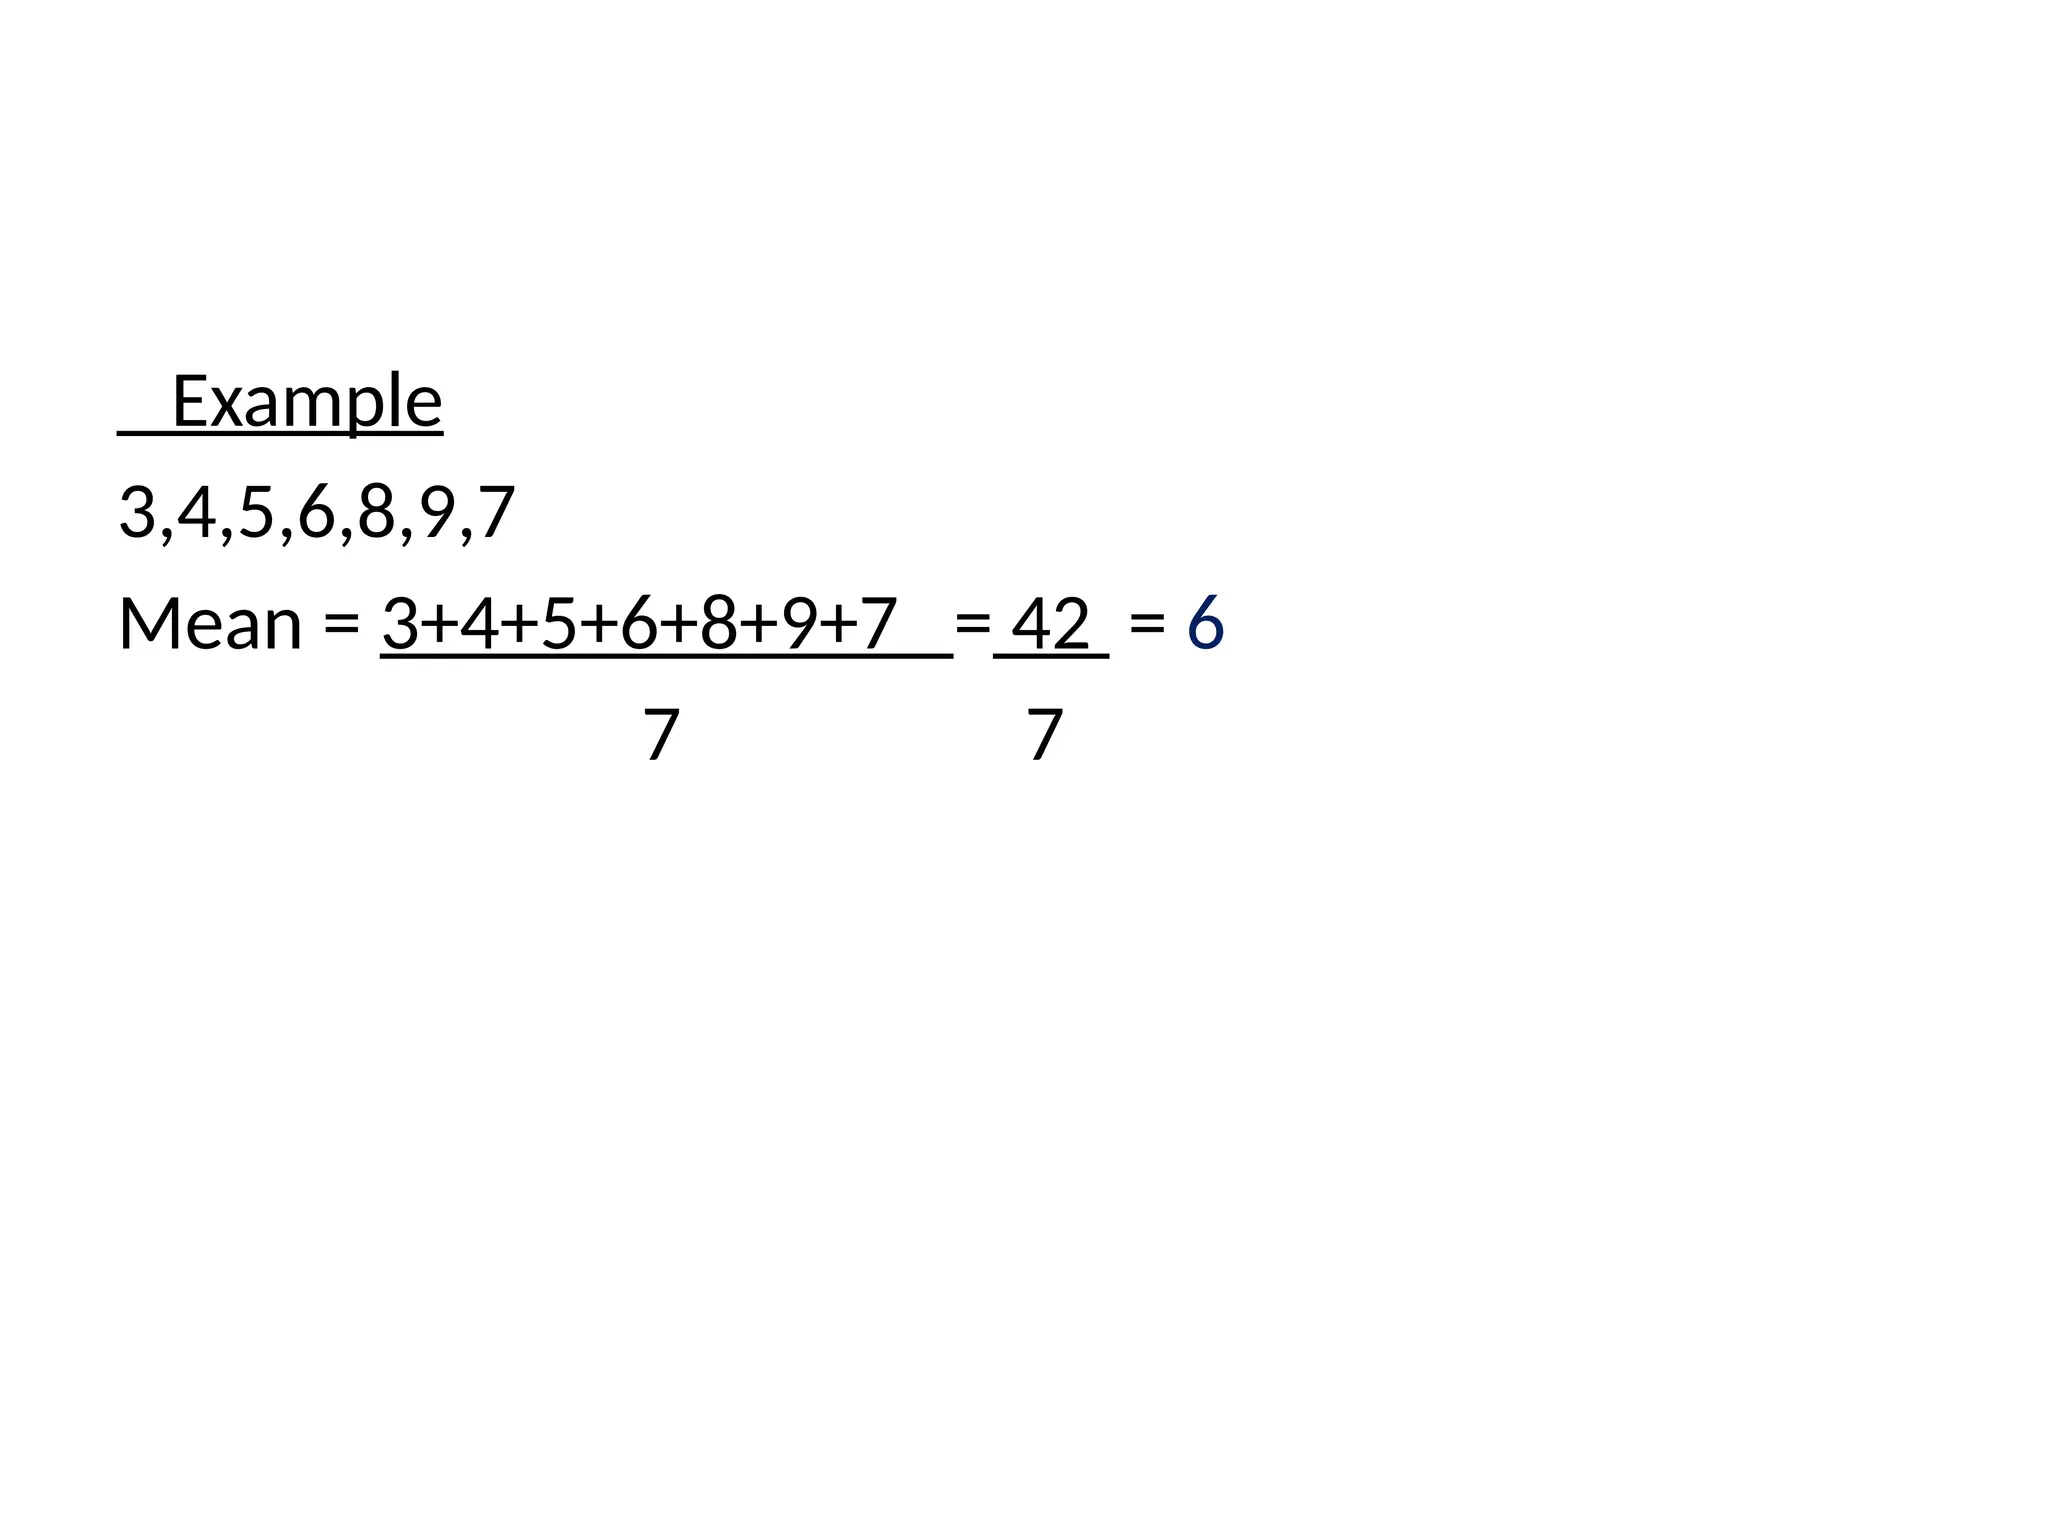
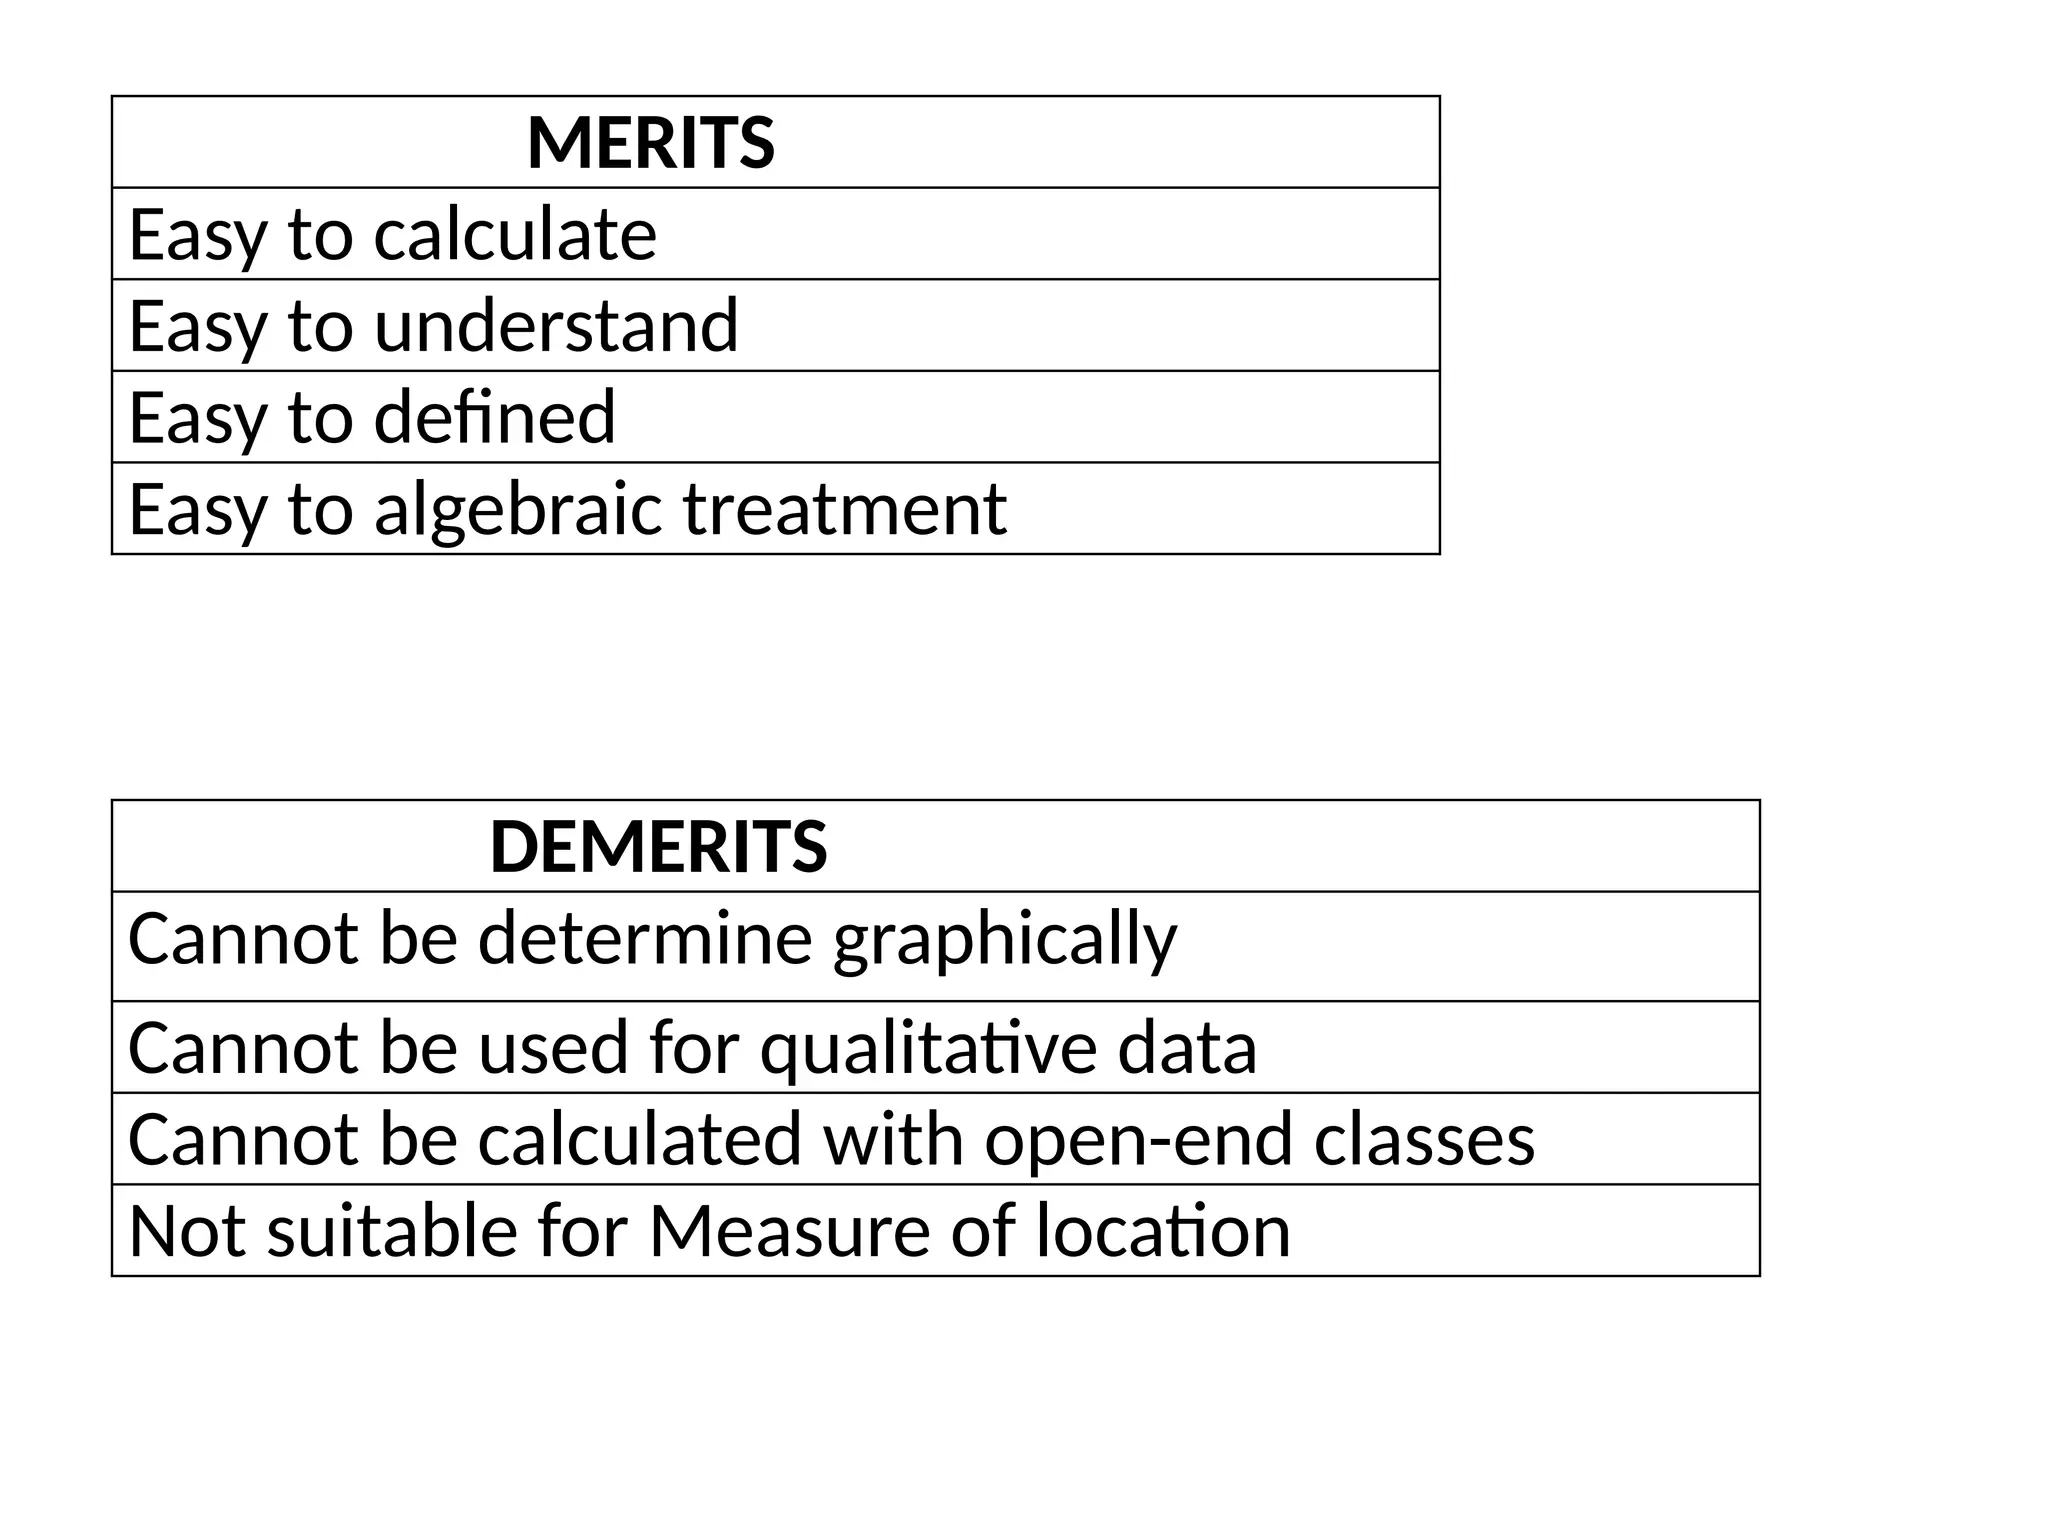
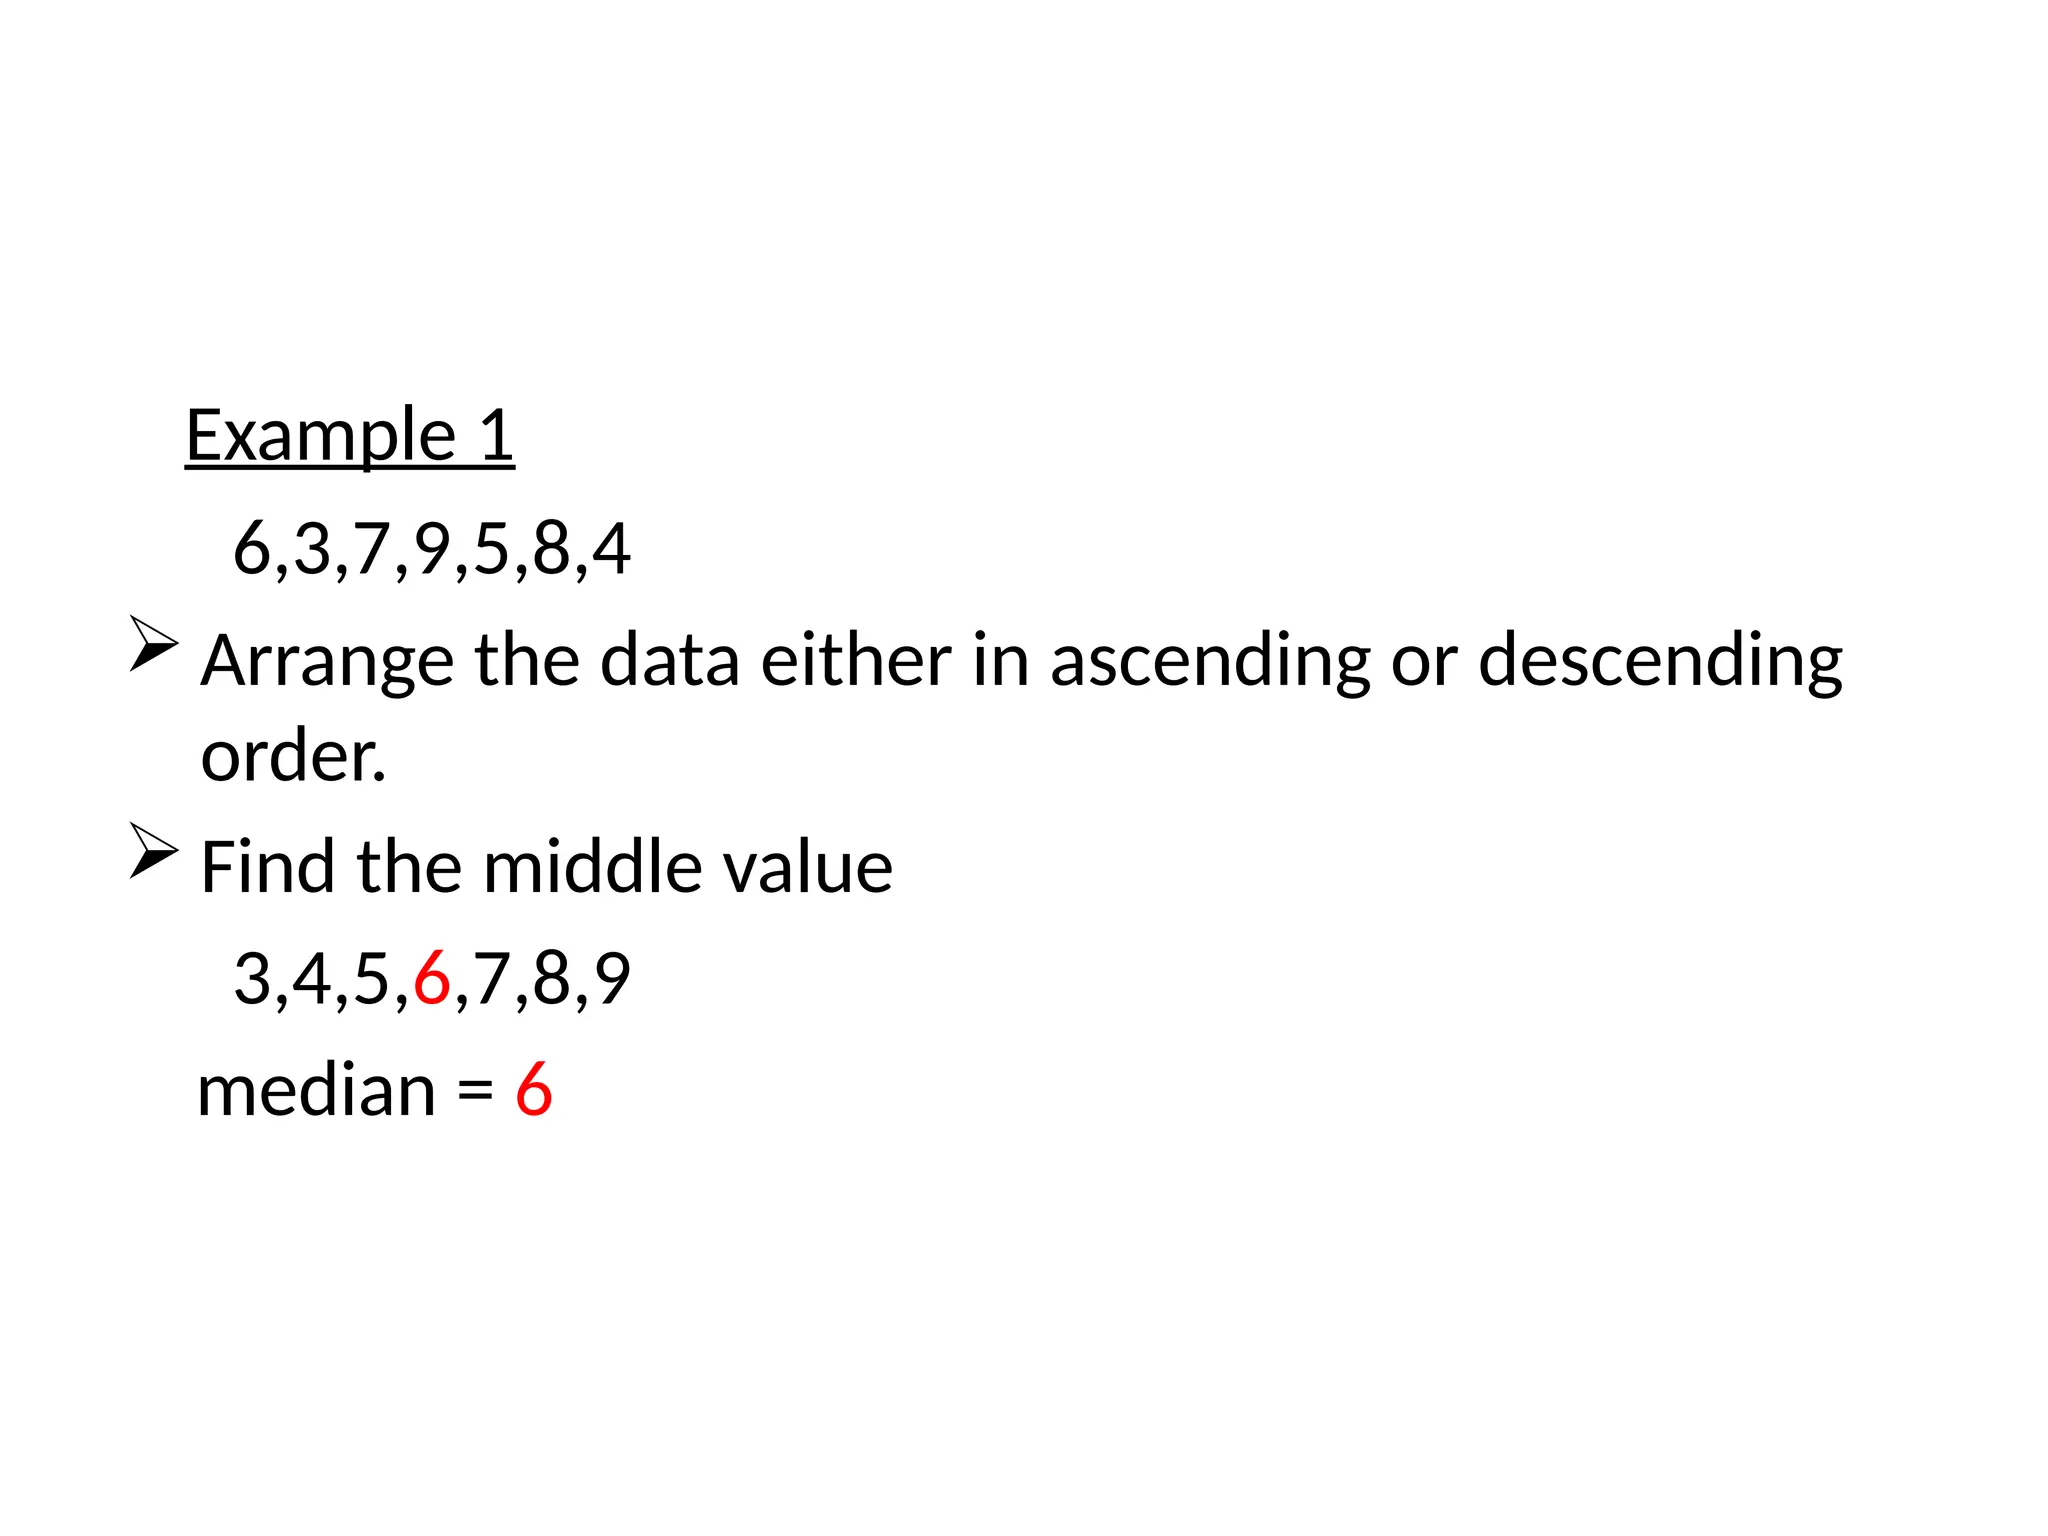
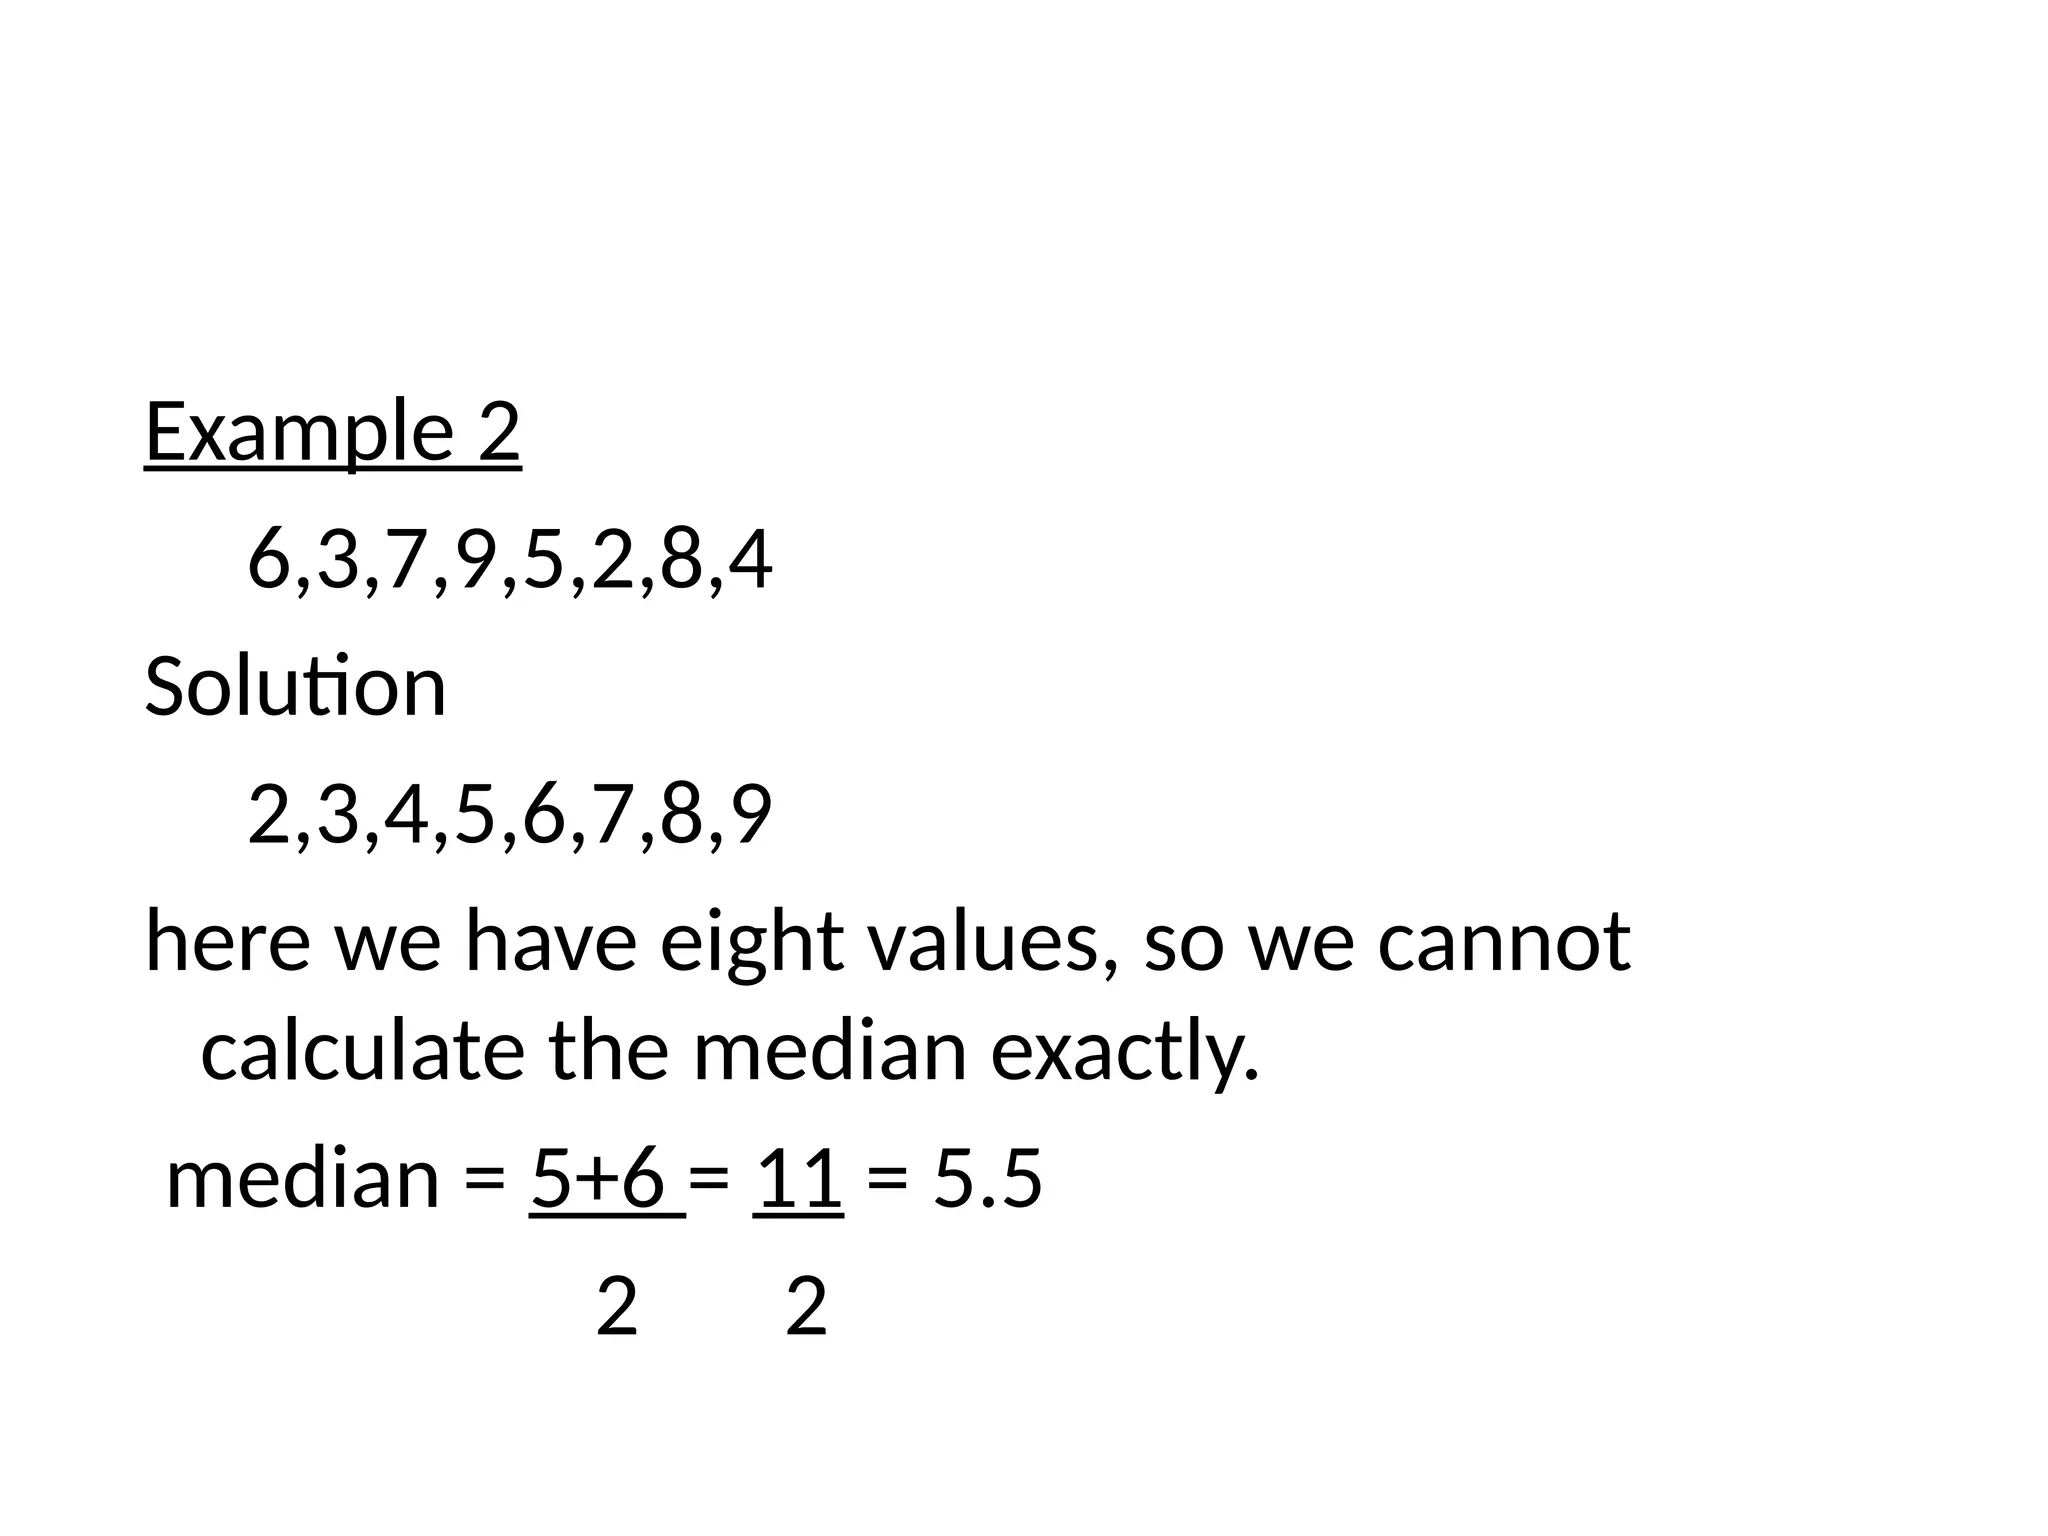
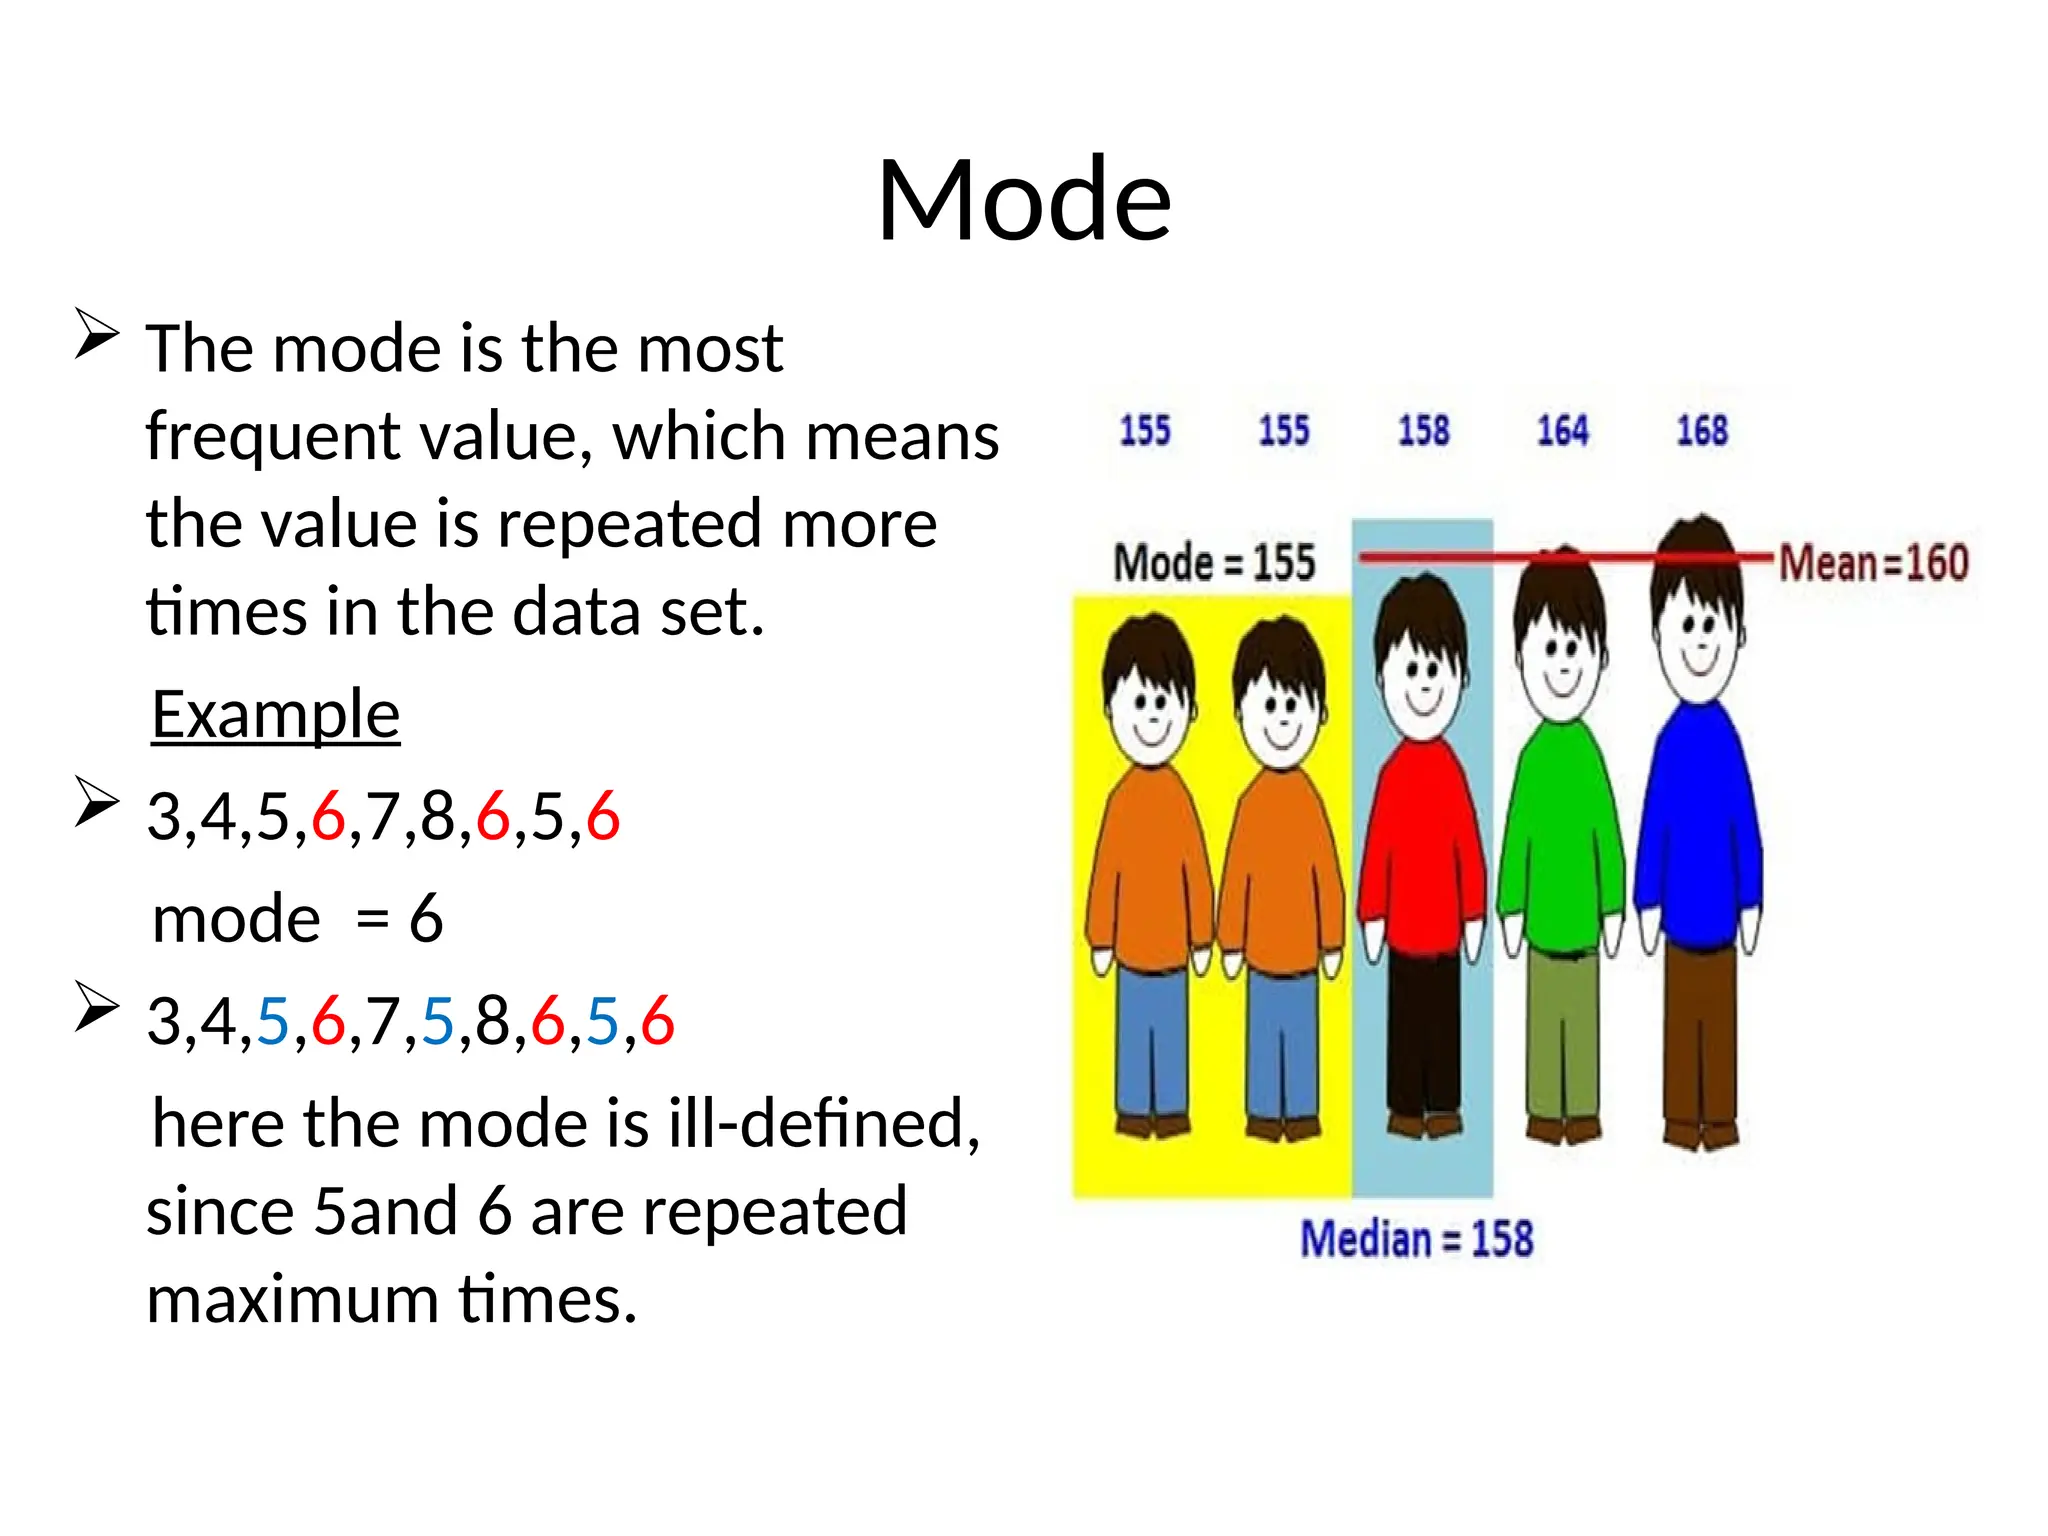
MEASURES OF CENTRAL
TENDENCY
In statistics, a central
tendency is a central value or a
typical value for a set of data.
It is occasionally called an
average or just the center
location / center of the
distribution.
Measures of central
tendency are defined for a
population and sample.
Types
median mean
mode
Measures of central
tendency
Arithmetic
mean
Geometric
mean
Harmonic
mean
MEAN
 The mean is the average
of all numbers in a set of
data.
How to calculate mean
 Add all the numbers in
the data set and then
divide that sum by how
many numbers were
added together to get
that sum.
Example
3,4,5,6,8,9,7
Mean = 3+4+5+6+8+9+7 = 42 = 6
7 7
DEMERITS
Cannot be determine graphically
Cannot be used for qualitative data
Cannot be calculated with open-end classes
Not suitable for Measure of location
MERITS
Easy to calculate
Easy to understand
Easy to defined
Easy to algebraic treatment
Median
 The median is the
middle value in the
ordered data set.
 A value that splits the
data into two halves,
that is one half of the
data is smaller than
that number, the other
half larger.
Example 1
6,3,7,9,5,8,4
 Arrange the data either in ascending or descending
order.
 Find the middle value
3,4,5,6,7,8,9
median = 6
Example 2
6,3,7,9,5,2,8,4
Solution
2,3,4,5,6,7,8,9
here we have eight values, so we cannot
calculate the median exactly.
median = 5+6 = 11 = 5.5
2 2
MERITS
Rigidly defined and Easy to understand
Determined graphically
Not affected by extreme values
Calculated with open-end classes
DEMERITS
In case of even numbers it cannot be determined exactly
Not based on all observations
Not amenable to algebraic treatment
Compared with mean, it is affected much by fluctuations
of sampling
Mode
 The mode is the most
frequent value, which means
the value is repeated more
times in the data set.
Example
 3,4,5,6,7,8,6,5,6
mode = 6
 3,4,5,6,7,5,8,6,5,6
here the mode is ill-defined,
since 5and 6 are repeated
maximum times.
MERITS
Easy to calculate
Not affected by extreme values
Determined in open-end classes
Used to describe qualitative phenomenon
DEMERITS
ill- defined (bimodal)
Not based upon all observations
Not capable of further mathematical treatment
Compared with mean, it is affected to a greater extent
by fluctuations o sampling

MEASURES OF CENTRAL TENDENCY IN RESEARCH METHODOLOGY AND BIOSTATISTICS

  • 1.
    MEASURES OF CENTRAL TENDENCY Instatistics, a central tendency is a central value or a typical value for a set of data. It is occasionally called an average or just the center location / center of the distribution. Measures of central tendency are defined for a population and sample.
  • 2.
    Types median mean mode Measures ofcentral tendency Arithmetic mean Geometric mean Harmonic mean
  • 3.
    MEAN  The meanis the average of all numbers in a set of data. How to calculate mean  Add all the numbers in the data set and then divide that sum by how many numbers were added together to get that sum.
  • 4.
  • 5.
    DEMERITS Cannot be determinegraphically Cannot be used for qualitative data Cannot be calculated with open-end classes Not suitable for Measure of location MERITS Easy to calculate Easy to understand Easy to defined Easy to algebraic treatment
  • 6.
    Median  The medianis the middle value in the ordered data set.  A value that splits the data into two halves, that is one half of the data is smaller than that number, the other half larger.
  • 7.
    Example 1 6,3,7,9,5,8,4  Arrangethe data either in ascending or descending order.  Find the middle value 3,4,5,6,7,8,9 median = 6
  • 8.
    Example 2 6,3,7,9,5,2,8,4 Solution 2,3,4,5,6,7,8,9 here wehave eight values, so we cannot calculate the median exactly. median = 5+6 = 11 = 5.5 2 2
  • 9.
    MERITS Rigidly defined andEasy to understand Determined graphically Not affected by extreme values Calculated with open-end classes DEMERITS In case of even numbers it cannot be determined exactly Not based on all observations Not amenable to algebraic treatment Compared with mean, it is affected much by fluctuations of sampling
  • 10.
    Mode  The modeis the most frequent value, which means the value is repeated more times in the data set. Example  3,4,5,6,7,8,6,5,6 mode = 6  3,4,5,6,7,5,8,6,5,6 here the mode is ill-defined, since 5and 6 are repeated maximum times.
  • 11.
    MERITS Easy to calculate Notaffected by extreme values Determined in open-end classes Used to describe qualitative phenomenon DEMERITS ill- defined (bimodal) Not based upon all observations Not capable of further mathematical treatment Compared with mean, it is affected to a greater extent by fluctuations o sampling