1) The document analyzes the literacy rates and populations of the top 20 countries by population to determine if there is a correlation between higher populations and higher literacy rates.
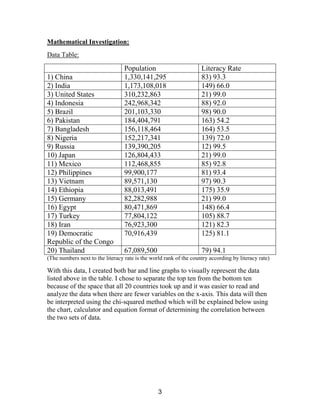
2) Data tables and graphs comparing literacy rates and populations do not show a clear correlation, as literacy rates are scattered and do not follow population trends.
3) The analysis concludes that the hypothesis that higher populations would correlate with higher literacy rates is not proven correct based on the data from the top 20 countries.