Matevosyan_Nepomuceno_Worley_poster.compressed
•
1 like•153 views

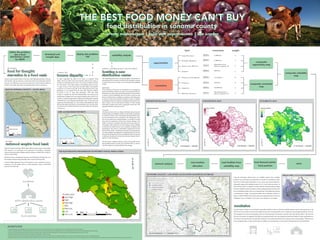
The document analyzes locating a new food distribution center for the Redwood Empire Food Bank in Sonoma County, California. Geographic information systems (GIS) analysis was used to identify suitable locations. Suitability analysis identified opportunities like proximity to food pantries and constraints like existing food banks. Network analysis of three candidate sites found the westernmost site provided the best coverage of surrounding food pantries. This location on the periphery of high poverty areas was recommended as the best site for a new distribution center.

Recommended
More Related Content
Similar to Matevosyan_Nepomuceno_Worley_poster.compressed
Similar to Matevosyan_Nepomuceno_Worley_poster.compressed (8)
Matevosyan_Nepomuceno_Worley_poster.compressed
- 1. (Buffer) (Buffer) (Buffer) (Select) (Buffer) (Buffer) (Select) (Buffer) arami matevosyan | julie ann nepomuceno | ian worley THE BEST FOOD MONEY CAN’T BUYTHE BEST FOOD MONEY CAN’T BUY food distribution in sonoma county arami matevosyan | julie ann nepomuceno | ian worley food distribution in sonoma county define the problem: site a food distribution center for REFB display the problem: TIN suitability analysis composite opportunity map composite suitability map composite constraint map network analysis layer constraints weight download and cr data new location allocation load facilities from suitability map load demand points: food pantries solve opportunities constraints food for thought: starvation in a food oasis food for thought: starvation in a food oasis the problem income disparityincome disparity method: TIN redwood empire food bankredwood empire food bank the client locating a distribution centerlocating a distribution center methods: suitability analysis, network analysis conclusionconclusion FOOD PANTRIE S 5,280 feet 5,280 feet Population less than or equal to 44 300 feet 21,120 feet 528 feet 26,400 feet Housing greater than or equal to 70 FARMERS MARKETS POPULATION DENSITY STREETS 4 3 2 1 -4 -3 -2 -1 EXISTIN G FOOD BANKS STREAMS AIRPORTS HOUSING DENSITY sources locating a distribution centerlocating a distribution center newnew compile Sonoma County markets itself as a food oasis where high quality produce, livestock, and wine flows with ease. However, a closer look reveals income disparities and food insecurity. It is difficult to see its poverty because the rural environment disperses poverty to the fringes rather than concentrating it like its urban counterparts. Redwood Empire Food Bank (REFB) helps address Sonoma’s gaps in food supply. Their mission is, “To end hunger in our community” by providing a community response system that makes adequate nutrition assistance available and accessible to anyone in need of help. REFB does this by collecting food donations and distributing it through their own three hunger initiatives and partnerships with a network of food pantries. Currently, REFB distributes food to food pantries in the community from two warehouse. Our GIS analysis will site a thrid distribution center to help REFB function more efficiently. donations REFB distribution center food pantries To better understand the needs of our client, we examined “Food Desert” data from USDA Food Access Research Atlas for the county, as well data on household poverty. There were strong correlations between the “food deserts” and a high incidence of households living in poverty. A couple of areas in the county had noticeably higher concentrations of poverty, so we chose to map this by first rasterizing the poverty data, generating a set of contours from the raster data using the incidence of poverty as the “z” value, then generating a TIN from these contours to represent the data three-dimensionally. Also noted was the predominance of high poverty areas situated along the north-south US 101 corridor, so a profile was generated to illustrate this relationship. Using the “Interpolate Line” tool, this path was delineated with a 3d line, then used to generate the profile graph. The TIN and the profile graph both clearly illustrate then high concentration of household poverty in the Santa Rosa metropolitan area, and this information was used to inform the next phase of our process. After identifying Santa Rosa as having the highest concentration of household poverty in Sonoma County, the next step phase would be to locate the best area to situate a new food bank using Suitability Analyst. Opportunities It was important to locate the new food bank near to existing food pantries and farmers markets to be able to secure good food that is fresh and easy to obtain with minimal transportation. Close proximity to streets is vital for individuals who do not have a private car and deman on public transit or walking to reach places. By locating close to streets, we make the food bank accessible to citizens. In regards to population density, the selection of ‘population density that is less than or equal to 44’ was made based on patterns of where existing food banks normally locate (which is generally around areas with population densities of less than 44-60). Constraints The distance between the two existing food banks measured out the be about a little over 20,000 feet, which is why the buffer around them is 4 miles (21,120 feet). This is the absolute minimum distance than the new food banks can be in proximity to the existing ones. Since the city has stream lines running through it, we decided to located away from the waterbeds to prevent any moisture damage to the facility or the food. In addition, Santa Rosa also has one airport in its boundary which makes the area surrounding it unfit to establish a food bank for health reasons, such as exposure to pollution and harmful gases. Thus, there is a 5 mile buffer to separate the new food bank from the airport. And lastly, the selection for housing density was made using the same approach for popuation density in that we observed the exsiting trend of where existing food banks were located in relation to housing and we based our selection of ‘greater than or equal to 70’ from this pattern. All these factors combined using the overlay tool provided us with three possible locations to locate a new food bank. Next, we will use Network Analyst to see which yields the best coverage. Using the information obtained from our suitability analysis, three candidate locations were selected that best reflected the new location of a food bank in Santa Rosa. First, to help visualize the problem, we ran a service area network analysis de- lineating the ranges of the candidate locations in 4, 8, 12 and 16 mile increments. To select the best location, we applied a Location-Allocation network analysis, loading the three candidate locations as Facilities, and the existing food pantry locations that the new distribution facility will serve as Demand Points. The problem type selected was “Maximum Coverage, ” choosing one facility with an impedance cutoff of 15 miles (24,140m/79,200ft). Based on this analysis, the optimal location for the new distribution center is candidate 1, the western-most candidate in our analysis. The best location to situate a new food bank in Santa Rosa would be in the area of the first candidate (western-most) on the map shown on the left. This site was not only one of the most suitable locations but it also garnered the most coverage from surrounding food pantries in the city. This site appears to be more on the periphery of the area with the greatest concentration of poverty rather than directly within it. The reason for this lies in the distance we assigned in the buffer for existing food banks. Since the exisitng food banks had a buffer of 4 miles (representative of each other), this meant that any new food bank would have to be located just beyond the area of great poverty, in the periphery. While this may not be completely ideal, it is still a valid location to establish a new food bank due to its proximity to the opportunity factors listed before. NETWORK ANALYST :: LOCATION-ALLOCATION MAXIMUM COVERAGE SERVICE AREA :: 4, 8, 12, & 16 INCREMENTS TIN ILLUSTRATING HOUSEHOLDS IN POVERTY/TOTAL POPULATION LOW ACCESS/HIGH POVERTY MAP OF SONOMA COUNTY :: SANTA ROSA OPPORTUNITIES MAP CONSTRAINTS MAP SUITABILITY MAP + Census tract boundaries and demographic data derived from U.S. Census 2007-2011 American Community Survey 5-year estimates: https://www.census.gov/geo/maps-data/data/tiger-data.html + Sonoma County political boundary information acquired from the County of Sonoma Permit and Resource Management Department GIS Data Download webpage: http://www.sonoma-county.org/prmd/gisdata/data_download.htm + Sonoma County road network data acquired from The University of California, Berkeley College of Environmental Design: http://ced.berkeley.edu/faculty/ratt/downloads/BayAreaStreets/Sonoma_streets.zip + Food Bank and Food Pantry location data acquired from Google Earth® and imported to ArcGIS as kml data. + Food Desert table data acquired from the United States Department of Agriculture Food Access Research Atlas: http://www.ers.usda.gov/datafiles/Food_Access_Research_Atlas/Download_the_Data/Current_Version/DataDownload.xlsx + World Topo Basemap sources: Sources: Esri, HERE, DeLorme, TomTom, Intermap, increment P Corp., GEBCO, USGS, FAO, NPS, NRCAN, GeoBase, IGN, Kadaster NL, Ordnance Survey, Esri Japan, METI, Esri China (Hong Kong), swisstopo, MapmyIndia, © OpenStreetMap contributors, and the GIS User Community