1. Juan Cruz
Environmental Justice
Introduction:
In environmental justice cases, empirical data becomes critical to assess the disproportion
of any kind of exposure. Studies of environmental justice focus on “the inequalities in exposure
to toxic hazards among subpopulations, within the tradition of distributive justice, addressing
equity of outcomes” (Sheppard, Leitner, Mcmaster, & Tian, 1999). The goal of this project is to
evaluate the equity of hazardous exposure to TRI/RCRA sites in Baltimore County. The
measures used in this study will be the exposure in the White and African American population,
household types and income groups taken from census data.
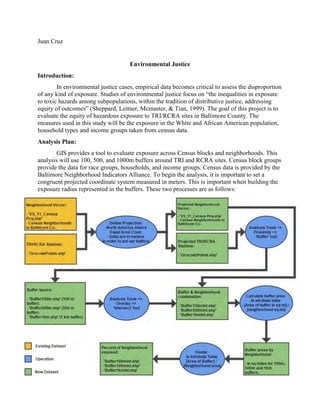
Analysis Plan:
GIS provides a tool to evaluate exposure across Census blocks and neighborhoods. This
analysis will use 100, 500, and 1000m buffers around TRI and RCRA sites. Census block groups
provide the data for race groups, households, and income groups. Census data is provided by the
Baltimore Neighborhood Indicators Alliance. To begin the analysis, it is important to set a
congruent projected coordinate system measured in meters. This is important when building the
exposure radius represented in the buffers. These two processes are as follows:
2. In order to evaluate exposure across neighborhoods, an equal distribution in
neighborhoods is assumed. The total exposure by race is the product of the total population of
Whites and African Americans and the percent area exposed. The number of Whites and African
Americans exposed will increase as the buffer radius increases from 100 to 500 to 1000 meters.
The procedure for this analysis is as follows:
The total number of whites and A.A in the buffer gets added together to obtain the number of
total exposed at every buffer level. The distribution of exposure by race is as follows:
Total
Population
Total White Population Total A.A. Population
Ratio
Wh./A.A.
615,724 173,338.94 388,602.03 0.4461
Buffers
Total Whites
Exposed
Whites Exposed/
Total Whites
Total A.A.
Exposed
A.A. Exposed/
Total A.A.
100 m 26,182.33 15.10% 43,792.25 11.27% 0.5979
500 m 144,009.60 83.08% 322,276.54 82.93% 0.4469
1 km 170,755.36 98.51% 386,664.40 99.50% 0.4416
At a 100 meter buffer 15.10% of the total white population are exposed, compared to
11.27% in African Americans. Whites continue to have the slightly higher percentage of
exposure at 500 meter buffer. However, at 1 km buffer, African Americans percentage goes up to
99.50% compared to Whites at 98.51%. This shows that at a shorter radius, more percentage of
whites are affected than blacks within their total populations. The 1 km buffer covers most of the
Baltimore County area, which may be a reason for the higher percentage exposed of African
Americans over Whites. The following map shows the buffer coverage:
3.
4. The income data of Baltimore neighborhoods expands the study on the TRI/RCRA sites.
Every Neighborhood contains a median household income. What neighborhood has the most
sites? What is the household median income of this neighborhood? In order to answer these
questions, it is important to select the two variables correctly: Household median income and
number of TRI/RCRA sites. The following map shows the intersection of median income and
number of TRI/RCRA sites by Neighborhood:
5. The intersection analysis is as follows:
The intersection of Median Incomes versus Number of sites show that neighborhoods
with a median income of $25,000 - $40,000 have the most number of sites. Neighborhoods
where the median income is below $25,000 do not have large amounts of TRI/RCRA sites.
Median Income
Neighborhoods with these number of sites
1 - 20 21 - 50 51 - 125
< $25,000 5 1 0
$25,001 - $40,000 9 12 6
$40,001 - $75,000 9 5 3
$75,001 - $115,000 3 1 1
Exploring the total number of household income from the census data shows slightly
different results. Households exposed in the < $25,000 income bracket form a higher percentage
over their total population of income. Under all of the three buffers, the < $25,000 income
bracket holds the higher percentage of population compared to the other brackets. This is only a
slight difference across other income brackets. The number of total households inside the buffers
was calculated by multiplying the total number of households and the percent area of buffer
coverage per neighborhood.
6. The following table shows the rest of the findings as follows:
Margins of Error
Some of the margin of errors in this study will come from the geocoding of the
TRI/RCRA sites. The roads module had a matching percent of over 60%, which is appropriate
for our study. The assumption that race and households among neighborhoods is equally
distributed is only taken by the scope of this study. For further analysis a smaller scale would be
necessary to avoid margin of errors in this assumption.
Conclusion
After evaluating the equity of hazardous exposure to TRI/RCRA sites in Baltimore
County. At a shorter radius, more percentage of whites are affected than blacks within their total
populations. This is across buffers of 100 and 500 meters. However over a 1km buffer the higher
exposure is suffered by African Americans over the total population. The 1 km buffer covers
most of the Baltimore County area, which may be a reason for the higher percentage exposed of
African Americans over Whites. The abundance of hazardous sites lay inside the $25,000 to
$40,000 median income neighborhoods. It is the neighborhoods with the most middle class
households that have the higher density of TRI/RCRA sites.
Household
Income
< $25,000 $25,001 - $40,000 $40,001 - $75,000 $75,001 - $115,000
Total Number
of Households
81,804.31 42,592.80 65,066.09 60,405.53
Total No. of
Households
inside buffer
Buffer
total /
Household
totals
Total No. of
Households
inside buffer
Buffer
total /
Household
totals
Total No. of
Households
inside buffer
Buffer
total /
Household
totals
Total No. of
Households
inside buffer
Buffer
total /
Household
totals
100 meter
buffer 11,616.93 14.20% 5,456.97 12.81% 8,354.49 12.84% 8,128.75 13.46%
500 meter
buffer 70,789.69 86.54% 35,397.43 83.11% 53,448.42 82.14% 49,215.57 81.48%
1 kilometer
buffer 81,253.56 99.33% 42,260.85 99.22% 64,514.41 99.15% 59,742.08 98.90%