SlideShare a Scribd company logo
1 of 8
Download to read offline
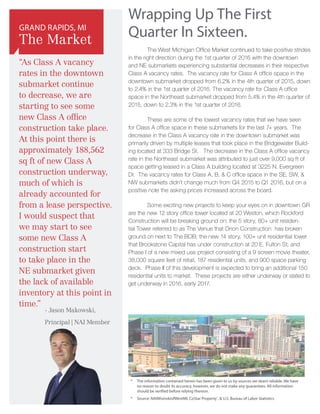
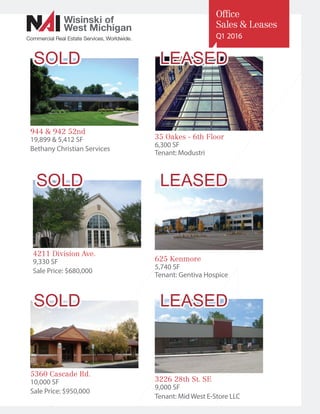
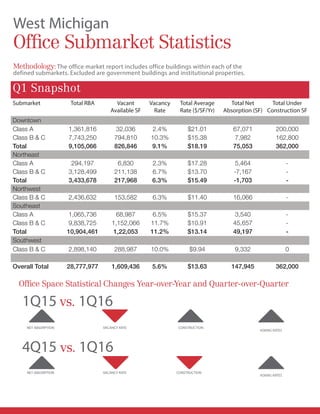
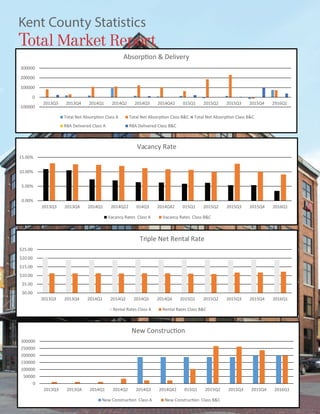
100 Grandville Ave SW Suite 100
Grand Rapids, MI 49503
616. 776. 0100 www.naiwwm.com
Wisinski of
West Michigan
Office • Industrial • Retail • Multi-Family
Office Market Report
West Michigan Q1 2016
*Also serving the Kalamazoo & Southwest
Michigan areas from our Kalamazoo office*
Wrapping Up The First
Quarter In Sixteen.
	 The West Michigan Office Market continued to take positive strides
in the right direction during the 1st quarter of 2016 with the downtown
and NE submarkets experiencing substantial decreases in their respective
Class A vacancy rates. The vacancy rate for Class A office space in the
downtown submarket dropped from 6.2% in the 4th quarter of 2015, down
to 2.4% in the 1st quarter of 2016. The vacancy rate for Class A office
space in the Northeast submarket dropped from 5.4% in the 4th quarter of
2015, down to 2.3% in the 1st quarter of 2016.
	 These are some of the lowest vacancy rates that we have seen
for Class A office space in these submarkets for the last 7+ years. The
decrease in the Class A vacancy rate in the downtown submarket was
primarily driven by multiple leases that took place in the Bridgewater Build-
ing located at 333 Bridge St. The decrease in the Class A office vacancy
rate in the Northeast submarket was attributed to just over 9,000 sq ft of
space getting leased in a Class A building located at 3225 N. Evergreen
Dr. The vacancy rates for Class A, B, & C office space in the SE, SW, &
NW submarkets didn’t change much from Q4 2015 to Q1 2016, but on a
positive note the asking prices increased across the board.
	 Some exciting new projects to keep your eyes on in downtown GR
are the new 12 story office tower located at 20 Weston, which Rockford
Construction will be breaking ground on; the 5 story, 80+ unit residen-
tial Tower referred to as The Venue that Orion Construction has broken
ground on next to The BOB; the new 14 story, 100+ unit residential tower
that Brookstone Capital has under construction at 20 E. Fulton St; and
Phase I of a new mixed use project consisting of a 9 screen movie theater,
38,000 square feet of retail, 187 residential units, and 900 space parking
deck. Phase II of this development is expected to bring an additional 150
residential units to market. These projects are either underway or slated to
get underway in 2016, early 2017.
*	The information contained herein has been given to us by sources we deem reliable. We have
no reason to doubt its accuracy, however, we do not make any guarantees. All information
should be verified before relying thereon.
*	 Source: NAIWisinskiofWestMI, CoStar Property®
,  U.S. Bureau of Labor Statistics
“As Class A vacancy
rates in the downtown
submarket continue
to decrease, we are
starting to see some
new Class A office
construction take place.
At this point there is
approximately 188,562
sq ft of new Class A
construction underway,
much of which is
already accounted for
from a lease perspective.
I would suspect that
we may start to see
some new Class A
construction start
to take place in the
NE submarket given
the lack of available
inventory at this point in
time.”
GRAND RAPIDS, MI
The Market
- Jason Makowski,
Principal | NAI Member
Office
Sales  Leases
Q1 2016
944  942 52nd
19,899  5,412 SF
Bethany Christian Services
SOLD
Commercial Real Estate Services, Worldwide.
Wisinski of
West Michigan
4211 Division Ave.
9,330 SF
Sale Price: $680,000
SOLD
5360 Cascade Rd.
10,000 SF
Sale Price: $950,000
SOLD
35 Oakes - 6th Floor
6,300 SF
Tenant: Modustri
625 Kenmore
5,740 SF
Tenant: Gentiva Hospice
3226 28th St. SE
9,000 SF
Tenant: Mid West E-Store LLC
LEASED
LEASED
LEASED
West Michigan
Office Submarket Statistics
Methodology:The office market report includes office buildings within each of the
defined submarkets. Excluded are government buildings and institutional properties.
Office Space Statistical Changes Year-over-Year and Quarter-over-Quarter
CONSTRUCTION
CONSTRUCTION
ASKING RATES
ASKING RATES
VACANCY RATE
VACANCY RATE
NET ABSORPTION
NET ABSORPTION
1Q15 vs. 1Q16
4Q15 vs. 1Q16
Q1 Snapshot
Submarket Total RBA Vacant
Available SF
Vacancy
Rate
Total Average
Rate ($/SF/Yr)
Total Net
Absorption (SF)
Total Under
Construction SF
Downtown
Class A 1,361,816 32,036 2.4% $21.01 67,071 200,000
Class B  C 7,743,250 794,810 10.3% $15.38 7,982 162,800
Total 9,105,066 826,846 9.1% $18.19 75,053 362,000
Northeast
Class A 294,197 6,830 2.3% $17.28 5,464 -
Class B  C 3,128,499 211,138 6.7% $13.70 -7,167 -
Total 3,433,678 217,968 6.3% $15.49 -1,703 -
Northwest
Class B  C 2,436,632 153,582 6.3% $11.40 16,066 -
Southeast
Class A 1,065,736 68,987 6.5% $15.37 3,540 -
Class B  C 9,838,725 1,152,066 11.7% $10.91 45,657 -
Total 10,904,461 1,22,053 11.2% $13.14 49,197 -
Southwest
Class B  C 2,898,140 288,987 10.0% $9.94 9,332 0
Overall Total 28,777,977 1,609,436 5.6% $13.63 147,945 362,000
Kent County Statistics
Total Market Report
C
0.00%
5.00%
10.00%
15.00%
2013Q3 2013Q4 2014Q1 2014Q22 014Q3 2014Q42 015Q1 2015Q2 2015Q3 2015Q4 2016Q1
Vacancy Rate
Vacancy Rates Class A Vacancy Rates Class BC
$0.00
$5.00
$10.00
$15.00
$20.00
$25.00
2013Q3 2013Q4 2014Q1 2014Q2 2014Q3 2014Q4 2015Q1 2015Q2 2015Q3 2015Q4 2016Q1
Triple Net Rental Rate
Rental Rates Class A Rental Rates Class BC
0
50000
100000
150000
200000
250000
300000
2013Q3 2013Q4 2014Q1 2014Q2 2014Q3 2014Q42 015Q1 2015Q2 2015Q3 2015Q4 2016Q1
-100000
0
100000
200000
300000
2013Q3 2013Q4 2014Q1 2014Q2 2014Q3 2014Q42 015Q1 2015Q2 2015Q3 2015Q4 2916Q1
RBA Delivered Class A RBA Delivered Class BC
Methodology | Definitions | Submarket Map
SF/PSF
Square foot/per square foot, used as a unit of
measurement.
Under Construction
Buildings in a state of construction, up until they
receive their certificate of occupancy. In order for
CoStar to consider a building under construction,
the site must have a concrete foundation in place.
Deliveries
Buildings that have their certificate of occupancy
and are allowed to be moved into by the tenant/
purchaser.
Vacancy Rate
All physically unoccupied lease space, either
direct or sublease.
Absorption (Net)
The change in occupied space in a given
time period.
Available Square Footage
Net rentable area considered available for lease;
excludes sublease space.
Average Asking Rental Rate
Rental rate as quoted from each building’s
owner/management company. For office space,
a full service rate was requested; for retail, a
triple net rate requested; for industrial, a NN
basis.
Building Class
Class A Product is office space of steel and
concrete construction, built after 1980, quality
tenants, excellent amenities  premium rates.
Class B product is office space built after 1980,
fair to good finishes  wide range of tenants.
RBA
Rentable Building Area - Mainly used for office
and industrial.
NortheastNorthwest
SoutheastSouthwest
Downtown
In the spring of 2011, two successful and reputable companies, The Wisinski Group and NAI West Michigan
merged. The merger represents collaboration, rich traditions, innovative technologies, unique cultures and
diversity of skills and specialties which ultimately benefit our clients. We’re going back to our fundamentals,
strengthening our core and becoming stronger in the services we provide our clients. Our focus is simple, build-
ing client relationships for life by offering market appropriate advice and then executing. Our success is a direct
result of its unwavering commitment to providing the best possible service to each and every client. Our Bro-
kers, with their 630 plus years of combined experience (20 years average), possess the knowledge and exper-
tise to manage the most complex transactions in industrial, office, retail, and Multi-Family specialities throughout
West Michigan.
Achieve More.
Doug Taatjes
CCIM, SIOR
616 292 1828
dougt@naiwwm.com
Marc Tourangeau
MBA
269 207 3072
marct@naiwwm.com
Jeremy Veenstra
616 242 1105
jeremyv@naiwwm.com
Kara Schroer
269 459 0435
karas@naiwwm.com
Mary Anne Wisinski-Rosely
CCIM, SIOR
616 575 7047
mawr@naiwwm.com
Stanley J. Wisinski, III
CCIM, SIOR
616 575 7015
sjw@naiwwm.com
Russ Bono
616 242 1115
russb@naiwwm.com
Dick Jasinski
616 575 7003
dickj@naiwwm.com
Meet Our Team
Office Specialists
Rod Alderink
616 242 1104
roda@naiwwm.com
Jason Makowski
616 575 7034
jasonm@naiwwm.com
Hillary Taatjes Woznick
616 242 1113
hillary@naiwwm.com
Local Knowledge. Global Reach.
Through our affiliation with NAI Global, we can also assist you with your commercial real estate needs
throughout the US  globally right here from West Michigan.
Doug Taatjes
CCIM, SIOR
616 292 1828
dougt@naiwwm.com
Marc Tourangeau
MBA
269 207 3072
marct@naiwwm.com
Jeremy Veenstra
616 242 1105
jeremyv@naiwwm.com
Kara Schroer
269 459 0435
karas@naiwwm.com
Mary Anne Wisinski-Rosely
CCIM, SIOR
616 575 7047
mawr@naiwwm.com
Stanley J. Wisinski, III
CCIM, SIOR
616 575 7015
sjw@naiwwm.com
Russ Bono
616 242 1115
russb@naiwwm.com
Dick Jasinski
616 575 7003
dickj@naiwwm.com
Office Specialists
Rod Alderink
616 242 1104
roda@naiwwm.com
Jason Makowski
616 575 7034
jasonm@naiwwm.com
Hillary Taatjes Woznick
616 242 1113
hillary@naiwwm.com
Cameron Timmer
616 485 4131
cameront@naiwwm.com
100 Grandville Ave SW Suite 100
Grand Rapids, MI 49503
616. 776. 0100 www.naiwwm.com
facebook.com/naiwwm
@naiwwm
nai-wisinski-of-west-michigan
Wisinski of
West Michigan
Office • Industrial • Retail • Multi-Family

More Related Content

Similar to Market Report Q1 2016 Office

Market Report Q4 2015 office
Market Report Q4 2015 officeMarket Report Q4 2015 office
Market Report Q4 2015 officeAllison Seeley
 
Market Report 2016 Q1 Industrial Final
Market Report 2016 Q1 Industrial FinalMarket Report 2016 Q1 Industrial Final
Market Report 2016 Q1 Industrial FinalAllison Seeley
 
Market Report 2015 Office Q3
Market Report 2015 Office Q3Market Report 2015 Office Q3
Market Report 2015 Office Q3Allison Seeley
 
Target in Raleigh, NC
Target in Raleigh, NCTarget in Raleigh, NC
Target in Raleigh, NCKevin Boeve
 
Market Report 2016-Retail Q2 Final AS
Market Report 2016-Retail Q2 Final ASMarket Report 2016-Retail Q2 Final AS
Market Report 2016-Retail Q2 Final ASAllison Seeley
 
Market Report 2015-Retail Q3
Market Report 2015-Retail Q3Market Report 2015-Retail Q3
Market Report 2015-Retail Q3Allison Seeley
 
Future of Downtown Bellevue -email
Future of Downtown Bellevue -emailFuture of Downtown Bellevue -email
Future of Downtown Bellevue -emailBobby Shanahan
 
SVN Live 3.11.24 Weekly Property Broadcast
SVN Live 3.11.24 Weekly Property BroadcastSVN Live 3.11.24 Weekly Property Broadcast
SVN Live 3.11.24 Weekly Property BroadcastSVN International Corp.
 
JLL Cleveland Office Outlook: Q1 2017
JLL Cleveland Office Outlook: Q1 2017JLL Cleveland Office Outlook: Q1 2017
JLL Cleveland Office Outlook: Q1 2017Andrew Batson
 
JLL Cleveland Office Outlook: Q3 2017
JLL Cleveland Office Outlook: Q3 2017JLL Cleveland Office Outlook: Q3 2017
JLL Cleveland Office Outlook: Q3 2017Andrew Batson
 
Market Report 2015-Retail Q4
Market Report 2015-Retail Q4Market Report 2015-Retail Q4
Market Report 2015-Retail Q4Allison Seeley
 
Q4-Kzoo Overall Market Report
Q4-Kzoo Overall Market ReportQ4-Kzoo Overall Market Report
Q4-Kzoo Overall Market ReportAllison Seeley
 
SVN Live 08.01.22 Weekly Property Broadcast
SVN Live 08.01.22 Weekly Property BroadcastSVN Live 08.01.22 Weekly Property Broadcast
SVN Live 08.01.22 Weekly Property BroadcastSVN International Corp.
 
JLL Louisville Office Outlook - Q2 2018
JLL Louisville Office Outlook - Q2 2018JLL Louisville Office Outlook - Q2 2018
JLL Louisville Office Outlook - Q2 2018Alex Westcott
 
Broward County Office Outlook - Q4 2018
Broward County Office Outlook - Q4 2018Broward County Office Outlook - Q4 2018
Broward County Office Outlook - Q4 2018JLL Florida
 

Similar to Market Report Q1 2016 Office (20)

FINAL Q4 Office
FINAL Q4 OfficeFINAL Q4 Office
FINAL Q4 Office
 
Market Report Q4 2015 office
Market Report Q4 2015 officeMarket Report Q4 2015 office
Market Report Q4 2015 office
 
Market Report 2016 Q1 Industrial Final
Market Report 2016 Q1 Industrial FinalMarket Report 2016 Q1 Industrial Final
Market Report 2016 Q1 Industrial Final
 
Market Report 2015 Office Q3
Market Report 2015 Office Q3Market Report 2015 Office Q3
Market Report 2015 Office Q3
 
Target in Raleigh, NC
Target in Raleigh, NCTarget in Raleigh, NC
Target in Raleigh, NC
 
Market Report 2016-Retail Q2 Final AS
Market Report 2016-Retail Q2 Final ASMarket Report 2016-Retail Q2 Final AS
Market Report 2016-Retail Q2 Final AS
 
Q2 2020 | E Fort Bend Commercial Real Estate Trends
Q2 2020 | E Fort Bend Commercial Real Estate TrendsQ2 2020 | E Fort Bend Commercial Real Estate Trends
Q2 2020 | E Fort Bend Commercial Real Estate Trends
 
Q2 2016 Fort Bend Submarket Snapshot
Q2 2016 Fort Bend Submarket SnapshotQ2 2016 Fort Bend Submarket Snapshot
Q2 2016 Fort Bend Submarket Snapshot
 
Market Report 2015-Retail Q3
Market Report 2015-Retail Q3Market Report 2015-Retail Q3
Market Report 2015-Retail Q3
 
Savills Indonesia - CBD Office Market Update
Savills Indonesia - CBD Office Market UpdateSavills Indonesia - CBD Office Market Update
Savills Indonesia - CBD Office Market Update
 
Future of Downtown Bellevue -email
Future of Downtown Bellevue -emailFuture of Downtown Bellevue -email
Future of Downtown Bellevue -email
 
SVN Live 3.11.24 Weekly Property Broadcast
SVN Live 3.11.24 Weekly Property BroadcastSVN Live 3.11.24 Weekly Property Broadcast
SVN Live 3.11.24 Weekly Property Broadcast
 
Q3 2020 | Fort Bend | Submarket Snapshot
Q3 2020 | Fort Bend | Submarket SnapshotQ3 2020 | Fort Bend | Submarket Snapshot
Q3 2020 | Fort Bend | Submarket Snapshot
 
JLL Cleveland Office Outlook: Q1 2017
JLL Cleveland Office Outlook: Q1 2017JLL Cleveland Office Outlook: Q1 2017
JLL Cleveland Office Outlook: Q1 2017
 
JLL Cleveland Office Outlook: Q3 2017
JLL Cleveland Office Outlook: Q3 2017JLL Cleveland Office Outlook: Q3 2017
JLL Cleveland Office Outlook: Q3 2017
 
Market Report 2015-Retail Q4
Market Report 2015-Retail Q4Market Report 2015-Retail Q4
Market Report 2015-Retail Q4
 
Q4-Kzoo Overall Market Report
Q4-Kzoo Overall Market ReportQ4-Kzoo Overall Market Report
Q4-Kzoo Overall Market Report
 
SVN Live 08.01.22 Weekly Property Broadcast
SVN Live 08.01.22 Weekly Property BroadcastSVN Live 08.01.22 Weekly Property Broadcast
SVN Live 08.01.22 Weekly Property Broadcast
 
JLL Louisville Office Outlook - Q2 2018
JLL Louisville Office Outlook - Q2 2018JLL Louisville Office Outlook - Q2 2018
JLL Louisville Office Outlook - Q2 2018
 
Broward County Office Outlook - Q4 2018
Broward County Office Outlook - Q4 2018Broward County Office Outlook - Q4 2018
Broward County Office Outlook - Q4 2018
 

More from Allison Seeley

Market Report Comprehensive Q4-Year End
Market Report Comprehensive Q4-Year EndMarket Report Comprehensive Q4-Year End
Market Report Comprehensive Q4-Year EndAllison Seeley
 
Market Report 2016 Q4 Industrial FINAL
Market Report 2016 Q4 Industrial FINALMarket Report 2016 Q4 Industrial FINAL
Market Report 2016 Q4 Industrial FINALAllison Seeley
 
Corporate Overview- 2016 AS
Corporate Overview- 2016 ASCorporate Overview- 2016 AS
Corporate Overview- 2016 ASAllison Seeley
 
NAI Case Study Option1_1col 2
NAI Case Study Option1_1col 2NAI Case Study Option1_1col 2
NAI Case Study Option1_1col 2Allison Seeley
 
Industrial Spotlight 2016 FINAL 10.13.16
Industrial Spotlight 2016 FINAL 10.13.16Industrial Spotlight 2016 FINAL 10.13.16
Industrial Spotlight 2016 FINAL 10.13.16Allison Seeley
 
Market Report 2016 Q3 Industrial
Market Report 2016 Q3 IndustrialMarket Report 2016 Q3 Industrial
Market Report 2016 Q3 IndustrialAllison Seeley
 
Market Report 2016-Retail Q3
Market Report 2016-Retail Q3Market Report 2016-Retail Q3
Market Report 2016-Retail Q3Allison Seeley
 
Market Report 2016 Q2 Industrial FINAL AS
Market Report 2016 Q2 Industrial FINAL ASMarket Report 2016 Q2 Industrial FINAL AS
Market Report 2016 Q2 Industrial FINAL ASAllison Seeley
 
Market Report 2016-Retail Q1
Market Report 2016-Retail Q1Market Report 2016-Retail Q1
Market Report 2016-Retail Q1Allison Seeley
 
Market Report 2015-Industrial Q4
Market Report 2015-Industrial Q4Market Report 2015-Industrial Q4
Market Report 2015-Industrial Q4Allison Seeley
 
Market Report 2015-Industrial Q3
Market Report 2015-Industrial Q3Market Report 2015-Industrial Q3
Market Report 2015-Industrial Q3Allison Seeley
 

More from Allison Seeley (16)

Market Report Comprehensive Q4-Year End
Market Report Comprehensive Q4-Year EndMarket Report Comprehensive Q4-Year End
Market Report Comprehensive Q4-Year End
 
FINALQ4Retail 2016
FINALQ4Retail 2016FINALQ4Retail 2016
FINALQ4Retail 2016
 
Market Report 2016 Q4 Industrial FINAL
Market Report 2016 Q4 Industrial FINALMarket Report 2016 Q4 Industrial FINAL
Market Report 2016 Q4 Industrial FINAL
 
GRBJHoliday Ad
GRBJHoliday AdGRBJHoliday Ad
GRBJHoliday Ad
 
SMP16
SMP16SMP16
SMP16
 
Corporate Overview- 2016 AS
Corporate Overview- 2016 ASCorporate Overview- 2016 AS
Corporate Overview- 2016 AS
 
NAI Case Study Option1_1col 2
NAI Case Study Option1_1col 2NAI Case Study Option1_1col 2
NAI Case Study Option1_1col 2
 
Industrial Spotlight 2016 FINAL 10.13.16
Industrial Spotlight 2016 FINAL 10.13.16Industrial Spotlight 2016 FINAL 10.13.16
Industrial Spotlight 2016 FINAL 10.13.16
 
GRBJ October Ad
GRBJ October AdGRBJ October Ad
GRBJ October Ad
 
Market Report 2016 Q3 Industrial
Market Report 2016 Q3 IndustrialMarket Report 2016 Q3 Industrial
Market Report 2016 Q3 Industrial
 
Market Report 2016-Retail Q3
Market Report 2016-Retail Q3Market Report 2016-Retail Q3
Market Report 2016-Retail Q3
 
Market Report 2016 Q2 Industrial FINAL AS
Market Report 2016 Q2 Industrial FINAL ASMarket Report 2016 Q2 Industrial FINAL AS
Market Report 2016 Q2 Industrial FINAL AS
 
Market Report 2016-Retail Q1
Market Report 2016-Retail Q1Market Report 2016-Retail Q1
Market Report 2016-Retail Q1
 
Office Spotlight 2016
Office Spotlight 2016Office Spotlight 2016
Office Spotlight 2016
 
Market Report 2015-Industrial Q4
Market Report 2015-Industrial Q4Market Report 2015-Industrial Q4
Market Report 2015-Industrial Q4
 
Market Report 2015-Industrial Q3
Market Report 2015-Industrial Q3Market Report 2015-Industrial Q3
Market Report 2015-Industrial Q3
 

Market Report Q1 2016 Office

  • 1. 100 Grandville Ave SW Suite 100 Grand Rapids, MI 49503 616. 776. 0100 www.naiwwm.com Wisinski of West Michigan Office • Industrial • Retail • Multi-Family Office Market Report West Michigan Q1 2016 *Also serving the Kalamazoo & Southwest Michigan areas from our Kalamazoo office*
  • 2. Wrapping Up The First Quarter In Sixteen. The West Michigan Office Market continued to take positive strides in the right direction during the 1st quarter of 2016 with the downtown and NE submarkets experiencing substantial decreases in their respective Class A vacancy rates. The vacancy rate for Class A office space in the downtown submarket dropped from 6.2% in the 4th quarter of 2015, down to 2.4% in the 1st quarter of 2016. The vacancy rate for Class A office space in the Northeast submarket dropped from 5.4% in the 4th quarter of 2015, down to 2.3% in the 1st quarter of 2016. These are some of the lowest vacancy rates that we have seen for Class A office space in these submarkets for the last 7+ years. The decrease in the Class A vacancy rate in the downtown submarket was primarily driven by multiple leases that took place in the Bridgewater Build- ing located at 333 Bridge St. The decrease in the Class A office vacancy rate in the Northeast submarket was attributed to just over 9,000 sq ft of space getting leased in a Class A building located at 3225 N. Evergreen Dr. The vacancy rates for Class A, B, & C office space in the SE, SW, & NW submarkets didn’t change much from Q4 2015 to Q1 2016, but on a positive note the asking prices increased across the board. Some exciting new projects to keep your eyes on in downtown GR are the new 12 story office tower located at 20 Weston, which Rockford Construction will be breaking ground on; the 5 story, 80+ unit residen- tial Tower referred to as The Venue that Orion Construction has broken ground on next to The BOB; the new 14 story, 100+ unit residential tower that Brookstone Capital has under construction at 20 E. Fulton St; and Phase I of a new mixed use project consisting of a 9 screen movie theater, 38,000 square feet of retail, 187 residential units, and 900 space parking deck. Phase II of this development is expected to bring an additional 150 residential units to market. These projects are either underway or slated to get underway in 2016, early 2017. * The information contained herein has been given to us by sources we deem reliable. We have no reason to doubt its accuracy, however, we do not make any guarantees. All information should be verified before relying thereon. * Source: NAIWisinskiofWestMI, CoStar Property® , U.S. Bureau of Labor Statistics “As Class A vacancy rates in the downtown submarket continue to decrease, we are starting to see some new Class A office construction take place. At this point there is approximately 188,562 sq ft of new Class A construction underway, much of which is already accounted for from a lease perspective. I would suspect that we may start to see some new Class A construction start to take place in the NE submarket given the lack of available inventory at this point in time.” GRAND RAPIDS, MI The Market - Jason Makowski, Principal | NAI Member
  • 3. Office Sales Leases Q1 2016 944 942 52nd 19,899 5,412 SF Bethany Christian Services SOLD Commercial Real Estate Services, Worldwide. Wisinski of West Michigan 4211 Division Ave. 9,330 SF Sale Price: $680,000 SOLD 5360 Cascade Rd. 10,000 SF Sale Price: $950,000 SOLD 35 Oakes - 6th Floor 6,300 SF Tenant: Modustri 625 Kenmore 5,740 SF Tenant: Gentiva Hospice 3226 28th St. SE 9,000 SF Tenant: Mid West E-Store LLC LEASED LEASED LEASED
  • 4. West Michigan Office Submarket Statistics Methodology:The office market report includes office buildings within each of the defined submarkets. Excluded are government buildings and institutional properties. Office Space Statistical Changes Year-over-Year and Quarter-over-Quarter CONSTRUCTION CONSTRUCTION ASKING RATES ASKING RATES VACANCY RATE VACANCY RATE NET ABSORPTION NET ABSORPTION 1Q15 vs. 1Q16 4Q15 vs. 1Q16 Q1 Snapshot Submarket Total RBA Vacant Available SF Vacancy Rate Total Average Rate ($/SF/Yr) Total Net Absorption (SF) Total Under Construction SF Downtown Class A 1,361,816 32,036 2.4% $21.01 67,071 200,000 Class B C 7,743,250 794,810 10.3% $15.38 7,982 162,800 Total 9,105,066 826,846 9.1% $18.19 75,053 362,000 Northeast Class A 294,197 6,830 2.3% $17.28 5,464 - Class B C 3,128,499 211,138 6.7% $13.70 -7,167 - Total 3,433,678 217,968 6.3% $15.49 -1,703 - Northwest Class B C 2,436,632 153,582 6.3% $11.40 16,066 - Southeast Class A 1,065,736 68,987 6.5% $15.37 3,540 - Class B C 9,838,725 1,152,066 11.7% $10.91 45,657 - Total 10,904,461 1,22,053 11.2% $13.14 49,197 - Southwest Class B C 2,898,140 288,987 10.0% $9.94 9,332 0 Overall Total 28,777,977 1,609,436 5.6% $13.63 147,945 362,000
  • 5. Kent County Statistics Total Market Report C 0.00% 5.00% 10.00% 15.00% 2013Q3 2013Q4 2014Q1 2014Q22 014Q3 2014Q42 015Q1 2015Q2 2015Q3 2015Q4 2016Q1 Vacancy Rate Vacancy Rates Class A Vacancy Rates Class BC $0.00 $5.00 $10.00 $15.00 $20.00 $25.00 2013Q3 2013Q4 2014Q1 2014Q2 2014Q3 2014Q4 2015Q1 2015Q2 2015Q3 2015Q4 2016Q1 Triple Net Rental Rate Rental Rates Class A Rental Rates Class BC 0 50000 100000 150000 200000 250000 300000 2013Q3 2013Q4 2014Q1 2014Q2 2014Q3 2014Q42 015Q1 2015Q2 2015Q3 2015Q4 2016Q1 -100000 0 100000 200000 300000 2013Q3 2013Q4 2014Q1 2014Q2 2014Q3 2014Q42 015Q1 2015Q2 2015Q3 2015Q4 2916Q1 RBA Delivered Class A RBA Delivered Class BC
  • 6. Methodology | Definitions | Submarket Map SF/PSF Square foot/per square foot, used as a unit of measurement. Under Construction Buildings in a state of construction, up until they receive their certificate of occupancy. In order for CoStar to consider a building under construction, the site must have a concrete foundation in place. Deliveries Buildings that have their certificate of occupancy and are allowed to be moved into by the tenant/ purchaser. Vacancy Rate All physically unoccupied lease space, either direct or sublease. Absorption (Net) The change in occupied space in a given time period. Available Square Footage Net rentable area considered available for lease; excludes sublease space. Average Asking Rental Rate Rental rate as quoted from each building’s owner/management company. For office space, a full service rate was requested; for retail, a triple net rate requested; for industrial, a NN basis. Building Class Class A Product is office space of steel and concrete construction, built after 1980, quality tenants, excellent amenities premium rates. Class B product is office space built after 1980, fair to good finishes wide range of tenants. RBA Rentable Building Area - Mainly used for office and industrial. NortheastNorthwest SoutheastSouthwest Downtown
  • 7. In the spring of 2011, two successful and reputable companies, The Wisinski Group and NAI West Michigan merged. The merger represents collaboration, rich traditions, innovative technologies, unique cultures and diversity of skills and specialties which ultimately benefit our clients. We’re going back to our fundamentals, strengthening our core and becoming stronger in the services we provide our clients. Our focus is simple, build- ing client relationships for life by offering market appropriate advice and then executing. Our success is a direct result of its unwavering commitment to providing the best possible service to each and every client. Our Bro- kers, with their 630 plus years of combined experience (20 years average), possess the knowledge and exper- tise to manage the most complex transactions in industrial, office, retail, and Multi-Family specialities throughout West Michigan. Achieve More. Doug Taatjes CCIM, SIOR 616 292 1828 dougt@naiwwm.com Marc Tourangeau MBA 269 207 3072 marct@naiwwm.com Jeremy Veenstra 616 242 1105 jeremyv@naiwwm.com Kara Schroer 269 459 0435 karas@naiwwm.com Mary Anne Wisinski-Rosely CCIM, SIOR 616 575 7047 mawr@naiwwm.com Stanley J. Wisinski, III CCIM, SIOR 616 575 7015 sjw@naiwwm.com Russ Bono 616 242 1115 russb@naiwwm.com Dick Jasinski 616 575 7003 dickj@naiwwm.com Meet Our Team Office Specialists Rod Alderink 616 242 1104 roda@naiwwm.com Jason Makowski 616 575 7034 jasonm@naiwwm.com Hillary Taatjes Woznick 616 242 1113 hillary@naiwwm.com Local Knowledge. Global Reach. Through our affiliation with NAI Global, we can also assist you with your commercial real estate needs throughout the US globally right here from West Michigan. Doug Taatjes CCIM, SIOR 616 292 1828 dougt@naiwwm.com Marc Tourangeau MBA 269 207 3072 marct@naiwwm.com Jeremy Veenstra 616 242 1105 jeremyv@naiwwm.com Kara Schroer 269 459 0435 karas@naiwwm.com Mary Anne Wisinski-Rosely CCIM, SIOR 616 575 7047 mawr@naiwwm.com Stanley J. Wisinski, III CCIM, SIOR 616 575 7015 sjw@naiwwm.com Russ Bono 616 242 1115 russb@naiwwm.com Dick Jasinski 616 575 7003 dickj@naiwwm.com Office Specialists Rod Alderink 616 242 1104 roda@naiwwm.com Jason Makowski 616 575 7034 jasonm@naiwwm.com Hillary Taatjes Woznick 616 242 1113 hillary@naiwwm.com Cameron Timmer 616 485 4131 cameront@naiwwm.com
  • 8. 100 Grandville Ave SW Suite 100 Grand Rapids, MI 49503 616. 776. 0100 www.naiwwm.com facebook.com/naiwwm @naiwwm nai-wisinski-of-west-michigan Wisinski of West Michigan Office • Industrial • Retail • Multi-Family