
Download to read offline
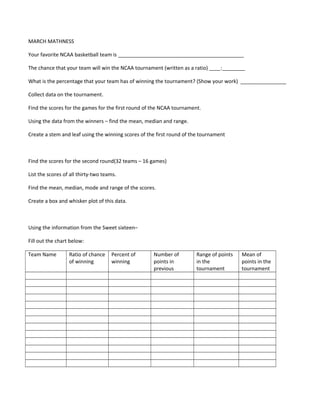
The document provides instructions for collecting and analyzing score data from the first two rounds of the NCAA men's basketball tournament. It asks the reader to find scores and calculate statistics like mean, median, range, and mode for the first round games, and then do the same for the second round games, creating a box and whisker plot. It also includes a chart to fill out using team name, chance of winning, percentage of winning, points scored, and point ranges and means.


