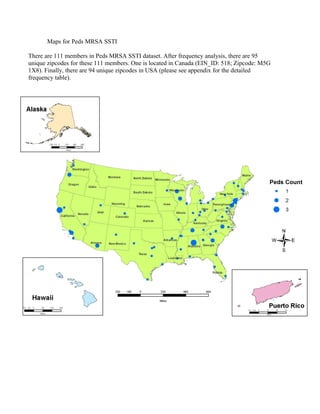
Maps for Peds MRSA SSTI
•Download as DOC, PDF•
0 likes•155 views

There are 111 members in a dataset on pediatric MRSA skin and soft tissue infections. Ninety-five unique zip codes are represented, with 94 in the US and 1 in Canada. Two questions were asked about changes in MRSA infections over different time periods, with answer choices weighted and categorized to create maps showing response trends by zip code.

Recommended
More Related Content
Similar to Maps for Peds MRSA SSTI
Similar to Maps for Peds MRSA SSTI (12)
More from Chen Zunqiu
More from Chen Zunqiu (15)
Maps for Peds MRSA SSTI
- 1. Maps for Peds MRSA SSTI There are 111 members in Peds MRSA SSTI dataset. After frequency analysis, there are 95 unique zipcodes for these 111 members. One is located in Canada (EIN_ID: 518; Zipcode: M5G 1X8). Finally, there are 94 unique zipcodes in USA (please see appendix for the detailed frequency table).
- 2. Peds MRSALASTYR Data Analysis Q1: Are you seeing more MRSA SSTI in the past 12 months compared with the previous year? In question 1, there are five multiple answer choices. In this dataset, four answer choices selected by these hospital members are: Somewhat fewer, About the same, Somewhat more, and Many more. Different weighting indicators have been adopted to these four choices because some zipcodes have more than one hospital member. It shows as following: Answer Weight Somewhat fewer 1 About the same 2 Somewhat more 3 Many more 4 An equation has also been adopted to calculate final weight for each zipcode. 1 Final Weight= n i i i X W n = ×∑ iX : The hospital i at corresponding zipcode iW : The weight of hospital i at corresponding zipcode n: The number of hospitals at corresponding zipcode Final Weight Categories 1 1 2-2.5 2 2.6-3.5 3 3.6-4 4 The final map looks like following:
- 3. Q2: Are you seeing more MRSA SSTI in the past 12 months compared with 2003? In question 1, there are five multiple answer choices. In this dataset, four answer choices selected by these hospital members are: Somewhat fewer, About the same, Somewhat more, and Many more. Different weighting indicators have been adopted to these four choices because some zipcodes have more than one hospital member. It shows as following: Answer Weight Somewhat fewer 1 About the same 2 Somewhat more 3 Many more 4 An equation has also been adopted to calculate final weight for each zipcode.
- 4. 1 Final Weight= n i i i X W n = ×∑ iX : The hospital i at corresponding zipcode iW : The weight of hospital i at corresponding zipcode n: The number of hospitals at corresponding zipcode Final Weight Categories 1 1 2-2.5 2 2.6-3.5 3 3.6-4 4 The final map looks like following:
- 5. zip1 zip1 Frequency 02139 1 02144 1 02903 1 03060 1 03756 1 03766 1 05405 1 06904 1 07046 1 07601 2 07740 1 08628 1 08903 1 10032 2 10304 1 10451 1 10457 1 11021 1 11201 1 14850 1 16502 1 19104 2 19341 1 20010 1 21120 1
- 6. zip1 zip1 Frequency 22908 1 26506 1 27599 1 27704 1 27710 2 27834 1 28232 1 28269 1 29615 1 30322 1 30342 1 30912 2 32207 1 32209 1 33176 1 33606 1 35233 3 36604 1 37232 2 37901 1 38018 1 38103 1 38105 1 39216 1 40202 1 43205 1 43614 1 44195 1 45229 1 45404 1 46202 1
- 7. zip1 zip1 Frequency 48108 1 53792 2 54449 2 55102 1 60612 1 60657 1 63104 1 70805 1 72202 1 75240 1 76104 1 76508 1 77555 1 78503 1 79430 1 80207 1 80218 1 84132 1 85724 2 87131 1 89102 1 90034 1 90048 1 90095 1 90740 1 90801 1 92123 1 92134 1 92620 1 92706 1 92868 2
- 8. zip1 zip1 Frequency 94143 3 94401 1 95817 1 97201 1 97227 2 97239 1 98105 1 M5G 1X8 1