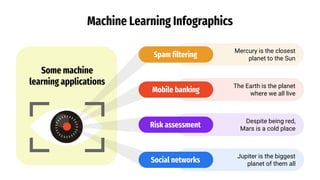
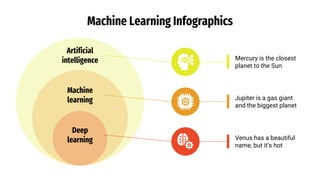
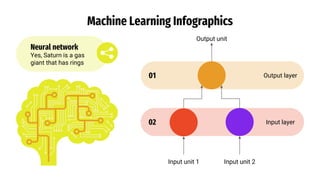
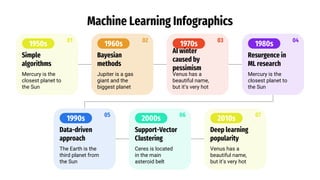
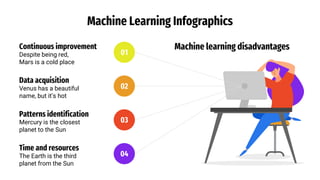
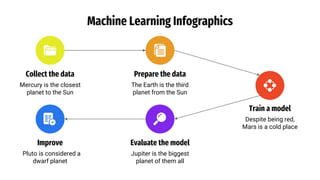
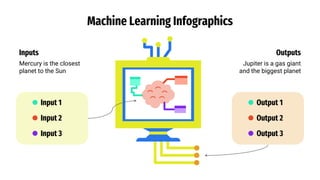
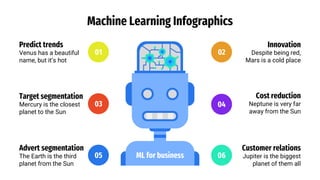
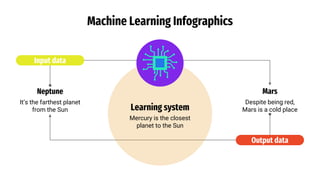
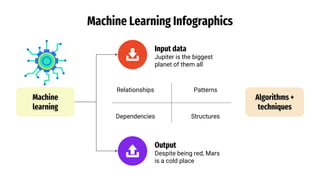
Mercury is the closest planet to the Sun. The document contains numerous infographics and descriptions about machine learning concepts including artificial intelligence, machine learning applications, neural networks, algorithms and more. It also provides details about the planets in our solar system within the infographics. The document aims to educate about machine learning through visually engaging infographics.
Machine Learning Infographics by Slidesgo.pptxKhoiHoang27
The document discusses machine learning and its applications. It provides examples of common machine learning applications including spam filtering, risk assessment, mobile banking, and social networks. It also discusses different machine learning techniques such as supervised learning, unsupervised learning, and reinforcement learning. Finally, it lists some advantages and disadvantages of machine learning.
Machine Learning Infographics by Slidesgo.pptxDitaPutri68
The document discusses machine learning infographics related to planets. It includes infographics about planets like Mercury, Venus, Earth, Mars, Jupiter, and Neptune. The infographics cover topics such as the order of planets from the Sun, their names and characteristics, as well as concepts in machine learning including algorithms, neural networks, applications, and the machine learning process.
Mercury is the closest planet to the Sun. Jupiter is the largest planet. The document provides information about machine learning through a series of infographics that discuss topics like artificial intelligence, machine learning applications, neural networks, and the history and process of machine learning. The infographics use planets and space-related references as visual aids.
Corporate Value Proposition Infographics.pptxNavneet105648
The document provides information about various planets in our solar system through infographics and text. It discusses key facts about planets such as Mercury, Venus, Earth, Mars, Jupiter, Saturn, Uranus, and Neptune. The document outlines elements of an effective corporate value proposition, including that it should be differentiated, substantiated, and valuable to customers. It also provides guidance on creating, implementing, and measuring the goals and progress of a corporate value proposition.
Corporate Value Proposition Infographics by Slidesgo.pptxBinhNguyenHuu5
This document provides information about various planets in our solar system. It includes facts about Mercury, Venus, Earth, Mars, Jupiter, Saturn, Uranus, Neptune and Pluto. Some key points mentioned are:
- Mercury is the smallest planet and closest to the Sun.
- Venus is the second planet from the Sun and is very hot.
- Earth is the third planet and the only known to harbor life.
- Mars is actually cold despite its red color.
- Jupiter is the largest planet and is a gas giant.
- Saturn is a gas giant with prominent rings.
- Uranus is the seventh planet from the Sun.
- Neptune is the farthest planet
Graph Paper Style Thesis Infographics by Slidesgo.pptxRahulPatil229507
This document provides instructions for using infographic elements from a graph paper style thesis template. It explains that premium users can use the template without attribution, while free users must credit Slidesgo. It describes how to copy, paste, ungroup, edit colors and sizes, and regroup infographic elements to integrate them into a presentation while maintaining the template's design. Users are directed to FAQs and a blog for more help on editing slides.
The document contains information about planets in the solar system presented through various infographics. It provides details about the planets Mercury, Venus, Earth, Mars, Jupiter, and Saturn. Key facts included are that Mercury is the closest planet to the sun and smallest planet, Earth is the third planet from the sun, Mars is cold despite being red, Jupiter is a gas giant and the largest planet, and Saturn is composed of hydrogen and helium. The document presents this information through multiple infographics with images and short descriptions of each planet.
Goals Strategy Infographics by Slidego.pptxWiameChokhman
This document provides an overview of strategic project planning for an IT project. It includes sections on the objectives of planning, principles of planning, applying planning, and a conclusion. The document discusses that planning is the process of organizing a sequence of actions or events to achieve a particular goal or objective. Strategic planning is done to achieve a predefined series of goals. It also discusses strategy as the art of directing and coordinating actions to achieve an objective.
Sales Process Infographics by Slidesgo.pptxKarenHoyos14
Sales Process Infographics by Slidesgo.pptx PLANTILLA DE DIAPOSITIVAS PARA UTILIZAR
Agile Project Management Infographics by Slidesgo.pptxDzohaDzoha
This document provides information about planets in our solar system using an agile project management framework. It includes infographics describing each planet with attributes like size, composition, and distance from the sun. The infographics demonstrate agile concepts like sprints, kanban boards, and the agile process from conception through deployment.
The document contains multiple infographics about planets in the solar system. It provides various facts and statistics about planets such as Mercury, Mars, Jupiter, Saturn, Venus, and Neptune. The infographics present information on each planet's distance from the sun, composition, size, temperature, and other characteristics. They also compare the planets and include percentages to illustrate certain facts about the planets.
Community Management Infographics by Slidesgo.pptxMarlanDowner
The document is a collection of infographics about community management and planets in the solar system. It includes infographics about the roles and responsibilities of a community manager, the main social media platforms, metrics and key performance indicators, strategies and tools used in community management, and facts about planets like Venus, Mars, Mercury, and Jupiter. The infographics provide visual comparisons of the planets and explain concepts like the functions of a community manager, the steps in a marketing plan, and mistakes to avoid for a community manager.
This document provides information about agile project management through a series of infographics related to planets in our solar system. It includes infographics on agile concepts like sprints, kanban boards, backlogs, and more. Each infographic uses examples from planets (e.g. Mercury is the smallest planet) to illustrate different aspects of agile project management techniques and processes.
Agile Project Management Infographics by Slidesgo (1).pptxSteveRogerJr
This document provides an overview of agile project management concepts through infographics. It includes infographics explaining agile principles and methodologies like sprints, kanban boards, and scrum. The infographics cover topics like agile vs traditional project management, the agile development cycle, planning tools and metrics, and more. They also use examples from space to explain concepts - depicting planets to illustrate tasks in different stages of a sprint or project. Overall, the document uses infographics as a visual aid to concisely explain key elements of agile project management.
This document contains a series of infographics about planets in the solar system. The infographics provide various facts about planets such as Mercury being the closest planet to the sun, Mars appearing red but actually being cold, and Jupiter being the largest planet. The infographics present this planetary data using charts, diagrams, percentages and comparisons. They also address big data topics like the five V's of big data as they relate to different planets.
This document contains a series of infographics about planets in the solar system. The infographics provide various facts and statistics about planets such as Mercury, Mars, Jupiter, Saturn, Venus, and Earth. They discuss attributes like each planet's composition, distance from the sun, size, temperature, and other characteristics. The infographics use charts, diagrams, and percentages to visually convey this planetary information and data in an engaging format.
This document contains multiple infographics about planets in the solar system. It provides facts about planets like Mercury, Mars, Jupiter, Saturn, and others. The infographics discuss planets' distances from the sun, their compositions, temperatures, and other characteristics. They also explore big data concepts like the five V's of big data as they relate to different planets.
The document provides information about planets in our solar system through a series of infographics. It discusses the key facts about each planet such as their distance from the sun, composition, and other attributes. The infographics also cover digital literacy skills and how they can be applied to understand, evaluate, analyze, and create knowledge based on the information presented.
This document introduces basic concepts about information and communication technologies (TIC). It discusses how computers and the internet have become ubiquitous in workplaces and education. It states that a basic understanding of how computers work and ability to perform simple tasks is important for participation in the workforce and society. The document then defines TIC as the set of knowledge, practices and tools related to information transmission and consumption, which are constantly evolving due to technological advancement. It previews the topics that will be covered in the introduction to TIC course, including computer use, good usage practices, and the operating system.
This document provides a summary of infographic templates that can be inserted into an AI Tech Agency presentation. The templates cover a variety of topics related to planets in our solar system, including their names, locations from the sun, physical characteristics, and percentages of key attributes. The document instructs the user to select templates, copy and paste them into slides, then modify the templates by copying elements and pasting them into other slides to create customized infographics for the presentation.
Big Data Infographics template slide.pptxsasongko3
This document contains multiple infographics about planets in the solar system. It provides facts about Mercury, Venus, Earth, Mars, Jupiter, Saturn, Uranus, and Neptune such as their composition, size, distance from the sun, and surface conditions. The infographics explore different aspects of each planet through charts, diagrams, and statistics. They also discuss big data concepts like the five V's of big data as they relate to different planetary properties.
Goals Strategy Infographics by Slidego.pptxNAVDEEPTANWAR2
The document provides information about planets in our solar system through a series of infographics. It discusses the following key details about planets:
- Mercury is the closest planet to the sun and the smallest planet.
- Despite being red, Mars is actually a very cold place full of iron oxide dust.
- Neptune is the farthest planet from the sun and also the fourth largest planet.
DEEP LEARNING FOR SMART GRID INTRUSION DETECTION: A HYBRID CNN-LSTM-BASED MODELgerogepatton
As digital technology becomes more deeply embedded in power systems, protecting the communication
networks of Smart Grids (SG) has emerged as a critical concern. Distributed Network Protocol 3 (DNP3)
represents a multi-tiered application layer protocol extensively utilized in Supervisory Control and Data
Acquisition (SCADA)-based smart grids to facilitate real-time data gathering and control functionalities.
Robust Intrusion Detection Systems (IDS) are necessary for early threat detection and mitigation because
of the interconnection of these networks, which makes them vulnerable to a variety of cyberattacks. To
solve this issue, this paper develops a hybrid Deep Learning (DL) model specifically designed for intrusion
detection in smart grids. The proposed approach is a combination of the Convolutional Neural Network
(CNN) and the Long-Short-Term Memory algorithms (LSTM). We employed a recent intrusion detection
dataset (DNP3), which focuses on unauthorized commands and Denial of Service (DoS) cyberattacks, to
train and test our model. The results of our experiments show that our CNN-LSTM method is much better
at finding smart grid intrusions than other deep learning algorithms used for classification. In addition,
our proposed approach improves accuracy, precision, recall, and F1 score, achieving a high detection
accuracy rate of 99.50%.
The document contains information about planets in the solar system presented through various infographics. It provides details about the planets Mercury, Venus, Earth, Mars, Jupiter, and Saturn. Key facts included are that Mercury is the closest planet to the sun and smallest planet, Earth is the third planet from the sun, Mars is cold despite being red, Jupiter is a gas giant and the largest planet, and Saturn is composed of hydrogen and helium. The document presents this information through multiple infographics with images and short descriptions of each planet.
Goals Strategy Infographics by Slidego.pptxWiameChokhman
This document provides an overview of strategic project planning for an IT project. It includes sections on the objectives of planning, principles of planning, applying planning, and a conclusion. The document discusses that planning is the process of organizing a sequence of actions or events to achieve a particular goal or objective. Strategic planning is done to achieve a predefined series of goals. It also discusses strategy as the art of directing and coordinating actions to achieve an objective.
Sales Process Infographics by Slidesgo.pptxKarenHoyos14
Sales Process Infographics by Slidesgo.pptx PLANTILLA DE DIAPOSITIVAS PARA UTILIZAR
Agile Project Management Infographics by Slidesgo.pptxDzohaDzoha
This document provides information about planets in our solar system using an agile project management framework. It includes infographics describing each planet with attributes like size, composition, and distance from the sun. The infographics demonstrate agile concepts like sprints, kanban boards, and the agile process from conception through deployment.
The document contains multiple infographics about planets in the solar system. It provides various facts and statistics about planets such as Mercury, Mars, Jupiter, Saturn, Venus, and Neptune. The infographics present information on each planet's distance from the sun, composition, size, temperature, and other characteristics. They also compare the planets and include percentages to illustrate certain facts about the planets.
Community Management Infographics by Slidesgo.pptxMarlanDowner
The document is a collection of infographics about community management and planets in the solar system. It includes infographics about the roles and responsibilities of a community manager, the main social media platforms, metrics and key performance indicators, strategies and tools used in community management, and facts about planets like Venus, Mars, Mercury, and Jupiter. The infographics provide visual comparisons of the planets and explain concepts like the functions of a community manager, the steps in a marketing plan, and mistakes to avoid for a community manager.
This document provides information about agile project management through a series of infographics related to planets in our solar system. It includes infographics on agile concepts like sprints, kanban boards, backlogs, and more. Each infographic uses examples from planets (e.g. Mercury is the smallest planet) to illustrate different aspects of agile project management techniques and processes.
Agile Project Management Infographics by Slidesgo (1).pptxSteveRogerJr
This document provides an overview of agile project management concepts through infographics. It includes infographics explaining agile principles and methodologies like sprints, kanban boards, and scrum. The infographics cover topics like agile vs traditional project management, the agile development cycle, planning tools and metrics, and more. They also use examples from space to explain concepts - depicting planets to illustrate tasks in different stages of a sprint or project. Overall, the document uses infographics as a visual aid to concisely explain key elements of agile project management.
This document contains a series of infographics about planets in the solar system. The infographics provide various facts about planets such as Mercury being the closest planet to the sun, Mars appearing red but actually being cold, and Jupiter being the largest planet. The infographics present this planetary data using charts, diagrams, percentages and comparisons. They also address big data topics like the five V's of big data as they relate to different planets.
This document contains a series of infographics about planets in the solar system. The infographics provide various facts and statistics about planets such as Mercury, Mars, Jupiter, Saturn, Venus, and Earth. They discuss attributes like each planet's composition, distance from the sun, size, temperature, and other characteristics. The infographics use charts, diagrams, and percentages to visually convey this planetary information and data in an engaging format.
This document contains multiple infographics about planets in the solar system. It provides facts about planets like Mercury, Mars, Jupiter, Saturn, and others. The infographics discuss planets' distances from the sun, their compositions, temperatures, and other characteristics. They also explore big data concepts like the five V's of big data as they relate to different planets.
The document provides information about planets in our solar system through a series of infographics. It discusses the key facts about each planet such as their distance from the sun, composition, and other attributes. The infographics also cover digital literacy skills and how they can be applied to understand, evaluate, analyze, and create knowledge based on the information presented.
This document introduces basic concepts about information and communication technologies (TIC). It discusses how computers and the internet have become ubiquitous in workplaces and education. It states that a basic understanding of how computers work and ability to perform simple tasks is important for participation in the workforce and society. The document then defines TIC as the set of knowledge, practices and tools related to information transmission and consumption, which are constantly evolving due to technological advancement. It previews the topics that will be covered in the introduction to TIC course, including computer use, good usage practices, and the operating system.
This document provides a summary of infographic templates that can be inserted into an AI Tech Agency presentation. The templates cover a variety of topics related to planets in our solar system, including their names, locations from the sun, physical characteristics, and percentages of key attributes. The document instructs the user to select templates, copy and paste them into slides, then modify the templates by copying elements and pasting them into other slides to create customized infographics for the presentation.
Big Data Infographics template slide.pptxsasongko3
This document contains multiple infographics about planets in the solar system. It provides facts about Mercury, Venus, Earth, Mars, Jupiter, Saturn, Uranus, and Neptune such as their composition, size, distance from the sun, and surface conditions. The infographics explore different aspects of each planet through charts, diagrams, and statistics. They also discuss big data concepts like the five V's of big data as they relate to different planetary properties.
Goals Strategy Infographics by Slidego.pptxNAVDEEPTANWAR2
The document provides information about planets in our solar system through a series of infographics. It discusses the following key details about planets:
- Mercury is the closest planet to the sun and the smallest planet.
- Despite being red, Mars is actually a very cold place full of iron oxide dust.
- Neptune is the farthest planet from the sun and also the fourth largest planet.
Similar to Machine Learning Infographics by Slidesgo.pptx (20)
DEEP LEARNING FOR SMART GRID INTRUSION DETECTION: A HYBRID CNN-LSTM-BASED MODELgerogepatton
As digital technology becomes more deeply embedded in power systems, protecting the communication
networks of Smart Grids (SG) has emerged as a critical concern. Distributed Network Protocol 3 (DNP3)
represents a multi-tiered application layer protocol extensively utilized in Supervisory Control and Data
Acquisition (SCADA)-based smart grids to facilitate real-time data gathering and control functionalities.
Robust Intrusion Detection Systems (IDS) are necessary for early threat detection and mitigation because
of the interconnection of these networks, which makes them vulnerable to a variety of cyberattacks. To
solve this issue, this paper develops a hybrid Deep Learning (DL) model specifically designed for intrusion
detection in smart grids. The proposed approach is a combination of the Convolutional Neural Network
(CNN) and the Long-Short-Term Memory algorithms (LSTM). We employed a recent intrusion detection
dataset (DNP3), which focuses on unauthorized commands and Denial of Service (DoS) cyberattacks, to
train and test our model. The results of our experiments show that our CNN-LSTM method is much better
at finding smart grid intrusions than other deep learning algorithms used for classification. In addition,
our proposed approach improves accuracy, precision, recall, and F1 score, achieving a high detection
accuracy rate of 99.50%.
Introduction- e - waste – definition - sources of e-waste– hazardous substances in e-waste - effects of e-waste on environment and human health- need for e-waste management– e-waste handling rules - waste minimization techniques for managing e-waste – recycling of e-waste - disposal treatment methods of e- waste – mechanism of extraction of precious metal from leaching solution-global Scenario of E-waste – E-waste in India- case studies.
Adaptive synchronous sliding control for a robot manipulator based on neural ...IJECEIAES
Robot manipulators have become important equipment in production lines, medical fields, and transportation. Improving the quality of trajectory tracking for
robot hands is always an attractive topic in the research community. This is a
challenging problem because robot manipulators are complex nonlinear systems
and are often subject to fluctuations in loads and external disturbances. This
article proposes an adaptive synchronous sliding control scheme to improve trajectory tracking performance for a robot manipulator. The proposed controller
ensures that the positions of the joints track the desired trajectory, synchronize
the errors, and significantly reduces chattering. First, the synchronous tracking
errors and synchronous sliding surfaces are presented. Second, the synchronous
tracking error dynamics are determined. Third, a robust adaptive control law is
designed,the unknown components of the model are estimated online by the neural network, and the parameters of the switching elements are selected by fuzzy
logic. The built algorithm ensures that the tracking and approximation errors
are ultimately uniformly bounded (UUB). Finally, the effectiveness of the constructed algorithm is demonstrated through simulation and experimental results.
Simulation and experimental results show that the proposed controller is effective with small synchronous tracking errors, and the chattering phenomenon is
significantly reduced.
Understanding Inductive Bias in Machine LearningSUTEJAS
This presentation explores the concept of inductive bias in machine learning. It explains how algorithms come with built-in assumptions and preferences that guide the learning process. You'll learn about the different types of inductive bias and how they can impact the performance and generalizability of machine learning models.
The presentation also covers the positive and negative aspects of inductive bias, along with strategies for mitigating potential drawbacks. We'll explore examples of how bias manifests in algorithms like neural networks and decision trees.
By understanding inductive bias, you can gain valuable insights into how machine learning models work and make informed decisions when building and deploying them.
A review on techniques and modelling methodologies used for checking electrom...nooriasukmaningtyas
The proper function of the integrated circuit (IC) in an inhibiting electromagnetic environment has always been a serious concern throughout the decades of revolution in the world of electronics, from disjunct devices to today’s integrated circuit technology, where billions of transistors are combined on a single chip. The automotive industry and smart vehicles in particular, are confronting design issues such as being prone to electromagnetic interference (EMI). Electronic control devices calculate incorrect outputs because of EMI and sensors give misleading values which can prove fatal in case of automotives. In this paper, the authors have non exhaustively tried to review research work concerned with the investigation of EMI in ICs and prediction of this EMI using various modelling methodologies and measurement setups.
Literature Review Basics and Understanding Reference Management.pptxDr Ramhari Poudyal
Three-day training on academic research focuses on analytical tools at United Technical College, supported by the University Grant Commission, Nepal. 24-26 May 2024
CHINA’S GEO-ECONOMIC OUTREACH IN CENTRAL ASIAN COUNTRIES AND FUTURE PROSPECTjpsjournal1
The rivalry between prominent international actors for dominance over Central Asia's hydrocarbon
reserves and the ancient silk trade route, along with China's diplomatic endeavours in the area, has been
referred to as the "New Great Game." This research centres on the power struggle, considering
geopolitical, geostrategic, and geoeconomic variables. Topics including trade, political hegemony, oil
politics, and conventional and nontraditional security are all explored and explained by the researcher.
Using Mackinder's Heartland, Spykman Rimland, and Hegemonic Stability theories, examines China's role
in Central Asia. This study adheres to the empirical epistemological method and has taken care of
objectivity. This study analyze primary and secondary research documents critically to elaborate role of
china’s geo economic outreach in central Asian countries and its future prospect. China is thriving in trade,
pipeline politics, and winning states, according to this study, thanks to important instruments like the
Shanghai Cooperation Organisation and the Belt and Road Economic Initiative. According to this study,
China is seeing significant success in commerce, pipeline politics, and gaining influence on other
governments. This success may be attributed to the effective utilisation of key tools such as the Shanghai
Cooperation Organisation and the Belt and Road Economic Initiative.
6th International Conference on Machine Learning & Applications (CMLA 2024)ClaraZara1
6th International Conference on Machine Learning & Applications (CMLA 2024) will provide an excellent international forum for sharing knowledge and results in theory, methodology and applications of on Machine Learning & Applications.
Low power architecture of logic gates using adiabatic techniquesnooriasukmaningtyas
The growing significance of portable systems to limit power consumption in ultra-large-scale-integration chips of very high density, has recently led to rapid and inventive progresses in low-power design. The most effective technique is adiabatic logic circuit design in energy-efficient hardware. This paper presents two adiabatic approaches for the design of low power circuits, modified positive feedback adiabatic logic (modified PFAL) and the other is direct current diode based positive feedback adiabatic logic (DC-DB PFAL). Logic gates are the preliminary components in any digital circuit design. By improving the performance of basic gates, one can improvise the whole system performance. In this paper proposed circuit design of the low power architecture of OR/NOR, AND/NAND, and XOR/XNOR gates are presented using the said approaches and their results are analyzed for powerdissipation, delay, power-delay-product and rise time and compared with the other adiabatic techniques along with the conventional complementary metal oxide semiconductor (CMOS) designs reported in the literature. It has been found that the designs with DC-DB PFAL technique outperform with the percentage improvement of 65% for NOR gate and 7% for NAND gate and 34% for XNOR gate over the modified PFAL techniques at 10 MHz respectively.
2. Machine Learning Infographics
01
AI software
Venus has a beautiful
name, but it’s hot
Compact the model
Despite being red,
Mars is a cold place
04
Framework
Mercury is the closest
planet to the Sun
02
Train the model
The Earth is the third
planet from the Sun
03
Convert the model
Saturn is the only
planet with rings
05
Integrate the model
Jupiter is the biggest
planet of them all
06
3. Machine Learning Infographics
Artificial Intelligence
● Computers act on their own
● They act according to environment
● Systems display cognitive ability
● Computers make decisions
Machine learning
● It’s an application of AI
● Computers observe and analyze
● Predict based on previous patterns
● Pre-programmed algorithms
Vs
4. Some machine
learning applications
Machine Learning Infographics
Mercury is the closest
planet to the Sun
Spam filtering
Despite being red,
Mars is a cold place
Risk assessment
The Earth is the planet
where we all live
Mobile banking
Jupiter is the biggest
planet of them all
Social networks
6. Machine Learning Infographics
Machine learning
Yes, Saturn is a
gas giant that
has several rings
04
Mars
Despite being
red, Mars is a
cold place
02
Venus
Venus has a
beautiful name,
but it’s hot
01
Mercury
Mercury is the
closest planet to
the Sun
03
Earth
The Earth is the
third planet from
the Sun
7. Machine Learning Infographics
04
Mars
Despite being red,
Mars is a cold place
03
Venus
Venus has a beautiful
name, but it’s hot
02
Mercury
Mercury is the closest
planet to the Sun
01
Earth
The Earth is the third
planet from the Sun
Machine learning
Saturn is the gas giant
that has rings
8. Machine Learning Infographics
AI
System configuration
Power
Mercury is the closest
planet to the Sun
01
Security
Venus has a beautiful
name, but it’s hot
05
Memory
Jupiter is a gas giant
and the biggest planet
03
MCU
The Earth is the third
planet from the Sun
07
Memory
Neptune is the farthest
planet from the Sun
02
FPGA
Pluto is considered a
dwarf planet
06
Mars
Despite being red, Mars
is a cold place
04
Wireless
Ceres is located in the
main asteroid belt
08
10. Machine Learning Infographics
Input unit 1 Input unit 2
Output unit
Neural network
Yes, Saturn is a gas
giant that has rings
Output layer
01
Input layer
02
11. Machine Learning Infographics
1950s
Simple
algorithms
Mercury is the
closest planet to
the Sun
01
1960s
Bayesian
methods
Jupiter is a gas
giant and the
biggest planet
02
1970s
AI winter
caused by
pessimism
Venus has a
beautiful name,
but it’s very hot
03
1980s
Resurgence in
ML research
Mercury is the
closest planet to
the Sun
04
1990s
Data-driven
approach
The Earth is the
third planet from
the Sun
05
2000s
Support-Vector
Clustering
Ceres is located
in the main
asteroid belt
06
2010s
Deep learning
popularity
Venus has a
beautiful name,
but it’s very hot
07
12. Machine Learning Infographics
01
Continuous improvement
Despite being red,
Mars is a cold place
02
Data acquisition
Venus has a beautiful
name, but it’s hot
03
Patterns identification
Mercury is the closest
planet to the Sun
04
Time and resources
The Earth is the third
planet from the Sun
Machine learning disadvantages
13. Machine Learning Infographics
Opportunities of
machine learning
Image recognition
The Earth is the planet
where we live
01
Voice recognition
Venus has a beautiful
name, but it’s hot
03
Optical recognition
Mercury is the closest
planet to the Sun
05
Customization
Despite being red,
Mars is a cold place
02
Data analysis
The Earth is the third
planet from the Sun
04
Memory data
Pluto is considered a
dwarf planet
06
14. Machine Learning Infographics
The model
Despite being red,
Mars is a cold place
Machine learning
Venus has a beautiful
name, but it’s hot
Input 2
Mercury is the closest
planet to the Sun
Input 1
The Earth is the third
planet from the Sun
15. Machine Learning Infographics
01 Supervised learning
Venus has a beautiful name, but it’s hot
02 Unsupervised learning
Despite being red, Mars is a cold place
03 Semi-supervised learning
The Earth is the third planet from the Sun
04 Reinforcement learning
Mercury is the closest planet to the Sun
05 Dimensionality reduction
Pluto is considered a dwarf planet
16. Machine Learning Infographics
Active learning
Mercury is the closest
planet to the Sun
01 Maturation
Jupiter is a gas giant
and the biggest planet
02
Motor synergies
The Earth is the
planet where we live
03 Imitation
Despite being red,
Mars is a cold place
04
17. Machine Learning Infographics
Follow the link in the graph to modify its data and then paste the new one here. For more info, click here
Intrusion detection
Mercury is the
closest planet
to the Sun
20%
Data mining
The Earth is
the third planet
from the Sun
45%
Continuous production
Despite being
red, Mars is a
very cold place
35%
19. Machine Learning Infographics
Follow the link in the graph to modify its data and then paste the new one here. For more info, click here
Active learning
Mercury is the closest
planet to the Sun
01
Maturation
Jupiter is a gas giant
and the biggest planet
02
Motor synergies
Neptune is very far
away from the Sun
03
100% 50% 25%
20. Machine Learning Infographics
Models
Artificial neural networks The Earth is the planet we live on
Decision trees Mercury is the smallest planet
Support-vector machines Despite being red, Mars is a cold place
Regression analysis Jupiter is the biggest planet of them all
Bayesian networks Venus has a beautiful name
Genetic algorithms Pluto is considered a dwarf planet
21. Machine Learning Infographics
Collect the data
Mercury is the closest
planet to the Sun
Prepare the data
The Earth is the third
planet from the Sun
Train a model
Despite being red,
Mars is a cold place
Improve
Pluto is considered a
dwarf planet
Evaluate the model
Jupiter is the biggest
planet of them all
22. Machine Learning Infographics
Inputs
Mercury is the closest
planet to the Sun
Outputs
Jupiter is a gas giant
and the biggest planet
Input 1
Input 2
Input 3
Output 1
Output 2
Output 3
24. Machine Learning Infographics
01
Predict trends
Venus has a beautiful
name, but it’s hot
Innovation
Despite being red,
Mars is a cold place
02
Target segmentation
Mercury is the closest
planet to the Sun
03
Advert segmentation
The Earth is the third
planet from the Sun
05
Cost reduction
Neptune is very far
away from the Sun
04
Customer relations
Jupiter is the biggest
planet of them all
06
ML for business
25. Machine Learning Infographics
Machine learning application example
04
Output
Despite being red,
Mars is a cold place
02
Feature
engineering
Venus has a beautiful
name, but it’s hot
01
Tweet
Mercury is the closest
planet to the Sun
03
Classification
The Earth is the third
planet from the Sun
Polite
Offensive
26. Machine Learning Infographics
Follow the link in the graph to modify its data and then paste the new one here. For more info, click here
Mercury
Mercury is the closest
planet to the Sun
10%
Jupiter
Jupiter is a gas giant
and the biggest planet
30%
Neptune
It’s the farthest planet
from the Sun
20%
Mars
Despite being red,
Mars is a cold place
40%
27. Machine Learning Infographics
Disease diagnosis
Venus has a beautiful
name, but it’s hot
Biochemical analysis
Mercury is the closest
planet to the Sun
Drug discovery
The Earth is the third
planet from the Sun
28. Machine Learning Infographics
Common Uses for Machine Learning
01 Chatbot systems Venus has a beautiful name, but it’s hot
02 Decision support Mercury is the closest planet to the Sun
03 Customer recommendation engines The Earth is the third planet from the Sun
04 Customer churn modeling Despite being red, Mars is a cold place
05 Pricing strategies Neptune is the farthest planet from the Sun
06 Customer segmentation Jupiter is the biggest planet of them all
07 Image classification Pluto is now considered a dwarf planet
29. Machine Learning Infographics
Learning system
Mercury is the closest
planet to the Sun
Neptune
It’s the farthest planet
from the Sun
Mars
Despite being red,
Mars is a cold place
Input data
Output data
30. Machine Learning Infographics
Advantages
● Efficiency data managing
● Continuous improvement
● Lots of applications
● Trend identification
● Pattern identification
Disadvantages
● Data acquisition
● Time and space
● Time-consuming
● High error possibilities
● Algorithm selection
Machine learning advantages vs disadvantages
31. Machine Learning Infographics
03
Analytical model
Despite being red, Mars
is a cold place
02
Choose algorithm
Mercury is the closest
planet to the Sun
Identify data
Venus has a beautiful
name, but it’s hot
01
05
Run the model
Neptune is very far
away from the Sun
Train the model
Jupiter is the biggest
planet of them all
04
32. Machine Learning Infographics
Machine
learning
Input data
Jupiter is the biggest
planet of them all
Output
Despite being red, Mars
is a cold place
Algorithms +
techniques
Relationships Patterns
Dependencies Structures
33. In order to use this template, you must credit Slidesgo in your final presentation.
You are allowed to:
- Modify this template.
- Use it for both personal and commercial projects.
You are not allowed to:
- Sublicense, sell or rent any of Slidesgo Content (or a modified version of Slidesgo Content).
- Distribute Slidesgo Content unless it has been expressly authorized by Slidesgo.
- Include Slidesgo Content in an online or offline database or file.
- Offer Slidesgo templates (or modified versions of Slidesgo templates) for download.
- Acquire the copyright of Slidesgo Content.
Instructions for use
For more information about editing slides, please read our FAQs or visit Slidesgo School:
https://slidesgo.com/faqs and https://slidesgo.com/slidesgo-school
34. Instructions for use (premium users)
In order to use this template, you must be a Premium user on Slidesgo.
You are allowed to:
● Modify this template.
● Use it for both personal and commercial purposes.
● Hide or delete the “Thanks” slide and the mention to Slidesgo in the credits.
● Share this template in an editable format with people who are not part of your team.
You are not allowed to:
● Sublicense, sell or rent this Slidesgo Template (or a modified version of this Slidesgo Template).
● Distribute this Slidesgo Template (or a modified version of this Slidesgo Template) or include it in a database or in
any other product or service that offers downloadable images, icons or presentations that may be subject to
distribution or resale.
● Use any of the elements that are part of this Slidesgo Template in an isolated and separated way from this
Template.
● Register any of the elements that are part of this template as a trademark or logo, or register it as a work in an
intellectual property registry or similar.
For more information about editing slides, please read our FAQs or visit Slidesgo School:
https://slidesgo.com/faqs and https://slidesgo.com/slidesgo-school
35. Infographics
You can add and edit some infographics to your presentation to present your data in a visual way.
● Choose your favourite infographic and insert it in your presentation using Ctrl C
+ Ctrl V or Cmd C + Cmd V in Mac.
● Select one of the parts and ungroup it by right-clicking and choosing
“Ungroup”.
● Change the color by clicking on the paint bucket.
● Then resize the element by clicking and dragging one of the square-shaped
points of its bounding box (the cursor should look like a double-headed arrow).
Remember to hold Shift while dragging to keep the proportions.
● Group the elements again by selecting them, right-clicking and choosing
“Group”.
● Repeat the steps above with the other parts and when you’re done editing, copy
the end result and paste it into your presentation.
● Remember to choose the “Keep source formatting” option so that it keeps the
design. For more info, please visit Slidesgo School.