Lindmoor Woods Neighborhood Watch Statistics from 10JULY11 to 31JULY13
•Download as PPTX, PDF•
1 like•389 views

Presentation delivered to residents of the 400+ Lindmoor Woods subdivision homes when serving as Lead Coordinator. This presentation depicts the reduction in crime metrics since the Watch's establishment in August 2011. Elected public servants such as Interim DeKalb County CEO Lee May and Assistant DeKalb County Police Chief Dale Homes were in attendance. <br> <br> NOTE: Presentation NOTES are not, regrettably, viewable in this edition.

Recommended
Recommended
More Related Content
Viewers also liked
Viewers also liked (16)
Recently uploaded
Recently uploaded (20)
Lindmoor Woods Neighborhood Watch Statistics from 10JULY11 to 31JULY13
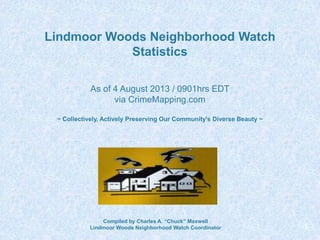
- 1. Lindmoor Woods Neighborhood Watch Statistics As of 4 August 2013 / 0901hrs EDT via CrimeMapping.com ~ Collectively, Actively Preserving Our Community's Diverse Beauty ~ 1 Compiled by Charles A. “Chuck” Maxwell Lindmoor Woods Neighborhood Watch Coordinator
- 2. 0 50 2 1 1 1 1 3 3 4 0 2 5 2 25 Crime Frequency by Street 01 JAN - 31DEC 2012 0 10 20 1 1 2 2 1 0 1 1 1 6 16 Crime Frequency by Street 01JAN - 31JUL 2013 C 0 20 1 2 4 2 5 1 2 1 18 Crime Frequency by Street As of 4 August 2013 / 0901hrs EDT 2 A B
- 3. 2 3 3 5 4 1 250 304 317 257 273 314 10JUL- 31DEC 2011 Radius LW 5 6 5 0 2 2 1 0 1 0 1 2 234 231 239 210 271 254 144 284 227 252 221 271 01JAN – 31DEC 2012 1-Mile Radius LW 2 3 2 5 2 2 0 276 210 284 264 252 279 280 24 01JAN – 04AUG 2013 1-Mile Radius LW Criminal Incidents by Month 1-Mile Radius of Lindmoor Woods As of 4 August 2013 / 0901hrs EDT 3 A B C
- 4. Lindmoor Woods 1-Mile Radius As of 4 August 2013 / 0901hrs EDT 4 A B C
- 5. Lindmoor Woods Neighborhood Watch Success • ZERO reported criminal events to CrimeMapping.com occurred in: - April, August and October 2012 - July 2013 • Linkwood Lane reduced reported criminal acts from 5 in 2011 to ZERO for ALL of 2012! • Let us ALL NOT become complacent given positive outcomes. • YOUR community is watching-out and caring for one another. However, more Block Captains are needed. • Lindmoor Woods has a closer, productive relationship with law enforcement • We are having MORE FUN! 5
Editor's Notes
- Data for this Report was compiled from regular, daily email alerts via CrimeMapping.com. YOUR Watch keeps this data within its LindmoorWoodsWatch@gmail.com account. Regretfully, CrimeMapping.com does not archive its data within its own domain. Your Coordinator researched, investigated and presents this information after reviewing each day, type of crime and location from 10JULY11 to 4AUGUST13/0901hrs EDT.These statistics were presented during the 6AUG13 Lindmoor Woods Cookout/National Night Out.
- This slide illustrates the Frequency of crime by Street in Lindmoor Woods. From A-to-C, the date ranges show:A – The first six (6) months since Lindmoor Woods’ Watch was established as of 1 August 2011.B – The first full year as an organized Watch of 2012.C – The first seven (7) months of the Watch in 2013.Section A - Linkwood Lane was the most frequent location for reported crime, followed by Francine Drive. These streets are two of the five primary entrance / exit points of Lindmoor Woods. Thus, quick crimes of opportunity seeping into Lindmoor Woods from highly travelled Lawrenceville Hwy and/or McLendon Drive. A total of eighteen (18) incidents were reported within Lindmoor Woods.Section B – Rehoboth Drive was the most frequent location for reported crime, followed by Lindmoor Drive. Rehoboth, too, is a main entry / exit point of Lindmoor Woods, which intersects with McLendon Drive (as street that borders the subdivision. A total of twenty-five (25) incidents were reported within Lindmoor Woods. NOTE: Linkwood Lane reported NO crime in this 2012 Section, whereas it reported five (5) incidents in the last part of 2011.Section C – Sanden Ferry Drive was the most frequent location for reported crime. This spike of six (6) incidents, compared to an average of two (2) in previous timeframes. The increase is due to two (2) “Motor Vehicle Theft” crimes and an increase in “Assault” crimes related to Domestic incidents. Again, the increase in “Motor Vehicle Theft” within LW seems to be a new, growing and concerning trend. Thus far, there are sixteen (16) incidents reported for 2013. NOTE: Lindmoor Lane dropped to ZERO reported incidents for the first seven (7) months of 2013, whereas Lindmoor Lane reported four (4) incidents for all of 2012.
- This slide depicts a numerical line graph of crimes within a 1-mile radius of Lindmoor Woods (Top line set) and crimes within Lindmoor Woods proper (Bottom line set).From A-to-C, the date ranges show:A – The first six (6) months since Lindmoor Woods’ Watch was established as of 1 August 2011.B – The first full year as an organized Watch of 2012.C – The first seven (7) months of the Watch in 2013.Section A – Reported crime for the specific time frame.Section B – The July 1-mile Radius data point is highlighted because this writer feels it is an incorrect anomaly in CrimeMapping.com reporting. The first quarter of 2012 (January-March) shows relatively high incident rates. However, the community came together to hold down criminal incidents. Notably, there were NO reported criminal incidents in Lindmoor Woods for April, August and October of 2012. Also notable is the number of 1-mile radius crimes were held down below a 300-per-month rate seen in Section A. This can be attributed to DeKalb County Police Department (DKPD) active policing. Section C – Depicted here are the figures/trends for the first half of 2013. Thus far, again, the number of 1-mile radius crimes are held below 300 per month. July shows NO crime reported in Lindmoor Woods.
- This slide depicts the Average Amount of Criminal Acts, for the time period noted, within Lindmoor Woods (the bluepie portion) versus crime reported within a 1-mile radius of Lindmoor Woods (the red pie portion).From A-to-C, the date ranges show:A – The first six (6) months since Lindmoor Woods’ Watch was established as of 1 August 2011.B – The first full year as an organized Watch of 2012.C – The first seven (7) months of the Watch in 2013.Section A – Depicts an average of 285.83 criminal incidents per Month in the 1-mile radius surrounding Lindmoor Woods. Lindmoor Woods averaged three (3) criminal incidents per Month.Section B – Depicts an average that fell to 236.50 (includes the July 2012 anomaly noted in the previous slide) criminal incidents per Month within a 1-Mile radius. Lindmoor Woods averaged 2.08 criminal incidents per Month.Section C – Depicts a current 7-Month trend average of 267 criminal incidents, per Month, within a 1-Mile radius of Lindmoor Woods. Lindmoor Woods is currently averaging 2.29 incidents per month, thus far. Continued and active community involvement is required to keep a safer neighborhood.