LinkedIn Stats on Updates by Augustine Fou
•
0 likes•407 views

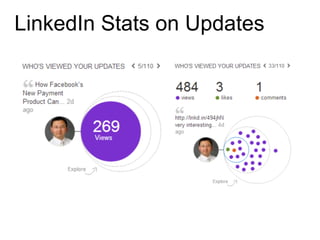
Linkedin adding some cool and useful features -- this one is the stats on each update and how many people viewed, liked, or commented on it.
Report
Share
Report
Share
Recommended
YouTube, Blog & LinkedIn 101 - GHAC
This document provides guidance on using YouTube, blogging, and LinkedIn for marketing purposes. It discusses creating how-to, behind-the-scenes, and professional videos for a YouTube channel. It also recommends customizing the channel, adding playlists and engaging with other users. For blogging, it suggests topics related to HVAC and employees and maintaining consistency. Finally, it outlines building a complete LinkedIn profile by filling out sections, adding connections, and getting recommendations.
LinkedIn Stats: www.LinkedSecrets.com/blog
Why does your business want to master LinkedIn?
Check out our blog for businesses on LinkedIn at www.LinkedSecrets.com/blog
Forensic Auditing of Digital Media.pdf
This document discusses forensic auditing of digital media using FouAnalytics. It describes analyzing discrepancies between bids won, ads served, and ads displayed. Drop-offs between these metrics indicate issues. The document also discusses evaluating accuracy of ad delivery in terms of location targeting, ad sizes, and frequency caps. Additionally, it covers analyzing when and where ads are served, including dayparting and reach across sites. Finally, the document examines ad quality factors like context, exposure to humans vs bots, and viewability.
Q1 2022 Update on ad fraud for AMM
This document provides a summary of digital ad fraud trends in Q1 2022. It discusses how ad fraud goes beyond just bots (IVT) to include other forms of fraud by sites and apps that are underreported. While industry associations only report on IVT rates around 1-3%, the document argues overall fraud rates are much higher. It also discusses the negative impacts of ad fraud on publishers, consumers, and advertisers. For publishers, it leads to lower revenues and CPMs. It also discusses how ad fraud has harmed local news organizations. For advertisers, it discusses examples like P&G and Chase cutting digital ad spend with no impact on performance. The document provides recommendations for publishers to sell direct inventory,
Ad blocking benchmarks q4 2021
Desktop ad blocking rates on business sites range from 9-16% of traffic share, which is 50-70% of total traffic. Mobile business site ad blocking is much lower at 1-2% of their 30-50% traffic share. For consumer sites, desktop ad blocking is 3-10% of their 15-30% traffic, while mobile consumer site ad blocking is even lower at 0.8-1% with mobile traffic being 70-85% of total consumer traffic.
Digital ad dollars trickle down chart
how the money flows from the advertisers through the ad tech intermediaries to longtail, fraud, and fake sites, with the help of botnets and traffic sellers
Still nothing but ad fraud 2021 dr augustine fou
In 2021 some marketers are still asking whether ad fraud is real and whether it is pervasive. This serves as a simple reminder of some of the evidence collected over the years.
Bad guys optimize ad fraud efficiency
bad guys started with fake websites, then moved to loading ads only to save time and bandwidth; now they are simply faking bid requests and flooding exchanges
Alternative to ANA's end to end supply chain transparency study v final
Alternative to ANA's end to end supply chain transparency study v finalDr. Augustine Fou - Independent Ad Fraud Researcher
The ANA RFP for an update to the supply chain transparency study from the ISBA in 2020 is not even asking the right questions; here's my view. Impact of Loss of 3P Cookies on Publishers' Ad Revenue
Impact of Loss of 3P Cookies on Publishers' Ad RevenueDr. Augustine Fou - Independent Ad Fraud Researcher
Previous studies that addressed the impact of losing third party (“3P”) cookies on ad revenue did not clearly differentiate between the impact on ad tech intermediaries versus on publishers. Instead of “advertiser CPMs” (what advertisers pay) this study uses “media CPMs” (what the publishers get) to better isolate the impact of tracking vs no tracking on publishers.Entire ecosystem supporting ad fraud 2018
“In addition to the ad fraud itself, bad guys make money by selling the “picks and shovels” too – e.g. bots, traffic, clicks, malware, fake apps, etc. They have an entire ecosystem to extract value. What follows are just a few examples, scratching the surface.”
Digital Media Trust Collaborative
The original idea of the digital media trust collaborative is was sharing threat intelligence to more quickly remove fraudulent domains and apps from media buys.
Programmatic reach analysis 2021
most buyers who buy in programmatic channels think they are getting enormous "reach" -- i.e. their ads are shown on many sites; but this data shows the exact opposite is true. Their ads are being shown on a small number of sites (less than 1,000); the buyers might as well have bought more direct from good publishers.
2021 update on ad fraud brand safety privacy
digital ad fraud is as rampant as ever; new ripples caused by privacy regulations are starting to affect the market. and more BS from trade associations pretending to be doing something
Browser and OS Share Jan 2021
U.S. smartphone browser share mirrors the mobile operating system market share, with Android users predominantly using Chrome and iOS users using Safari exclusively. On desktop computers, which are mostly Windows-based, Windows users primarily browse with Chrome. The majority of iOS device users have iOS 13 and Safari 13 installed, with only 6% using browsers other than Safari.
Checking abnormal referrer traffic in google analytics
Checking abnormal referrer traffic in google analyticsDr. Augustine Fou - Independent Ad Fraud Researcher
Using Google Analytics to find abnormal traffic and fraud; this is a how-to, to get hourly charts instead of daily rolled-up or averaged data, which hides the fraud. History and Impact of Digital Ad Fraud
This document provides an overview of the history and global impact of digital ad fraud. It discusses how fraudsters are able to generate infinite fake ad impressions through virtual ads rather than real billboards. The document outlines how major brands like Chase and P&G cut digital ad spending significantly without negative effects after removing fraudulent sites. It also examines how ad fraud has contributed to the decline of local journalism and thousands of newspaper closures. Throughout, it encourages analyzing your own analytics and reports to identify abnormal patterns that may indicate fraud.
Digital Fraud Viewability Benchmarks Q4 2020
digital ad fraud, viewability, ad blocking benchmarks for Q 2020; directly measured across a wide variety of campaigns and sites
What CFEs can do about digital ad fraud
certified fraud examiners can apply their investigative techniques to help identify and root out ad fraud too; no specialized tech is required.
Four types of digital ad spend updated august 2020
Four types of digital ad spend updated august 2020Dr. Augustine Fou - Independent Ad Fraud Researcher
from the IAB FY 2019 advertising revenue report, we show that CPM and CPC ads represent 92% of all digital spend; these are the favorite targets of fraudtersHow to Use FouAnalytics For Marketers
FouAnalytics is an alternative to Google Analytics, but with fraud and bot detection baked in. Marketers can use FouAnalytics to look at their own campaigns, find the domains and apps that are eating up their budgets fraudulently, and turn them off, while the campaign is still running. How does that compare to your blackbox fraud detection that just gives you a percent IVT number?
FouAnalytics DIY site media analytics fraud detection baked in
FouAnalytics DIY site media analytics fraud detection baked inDr. Augustine Fou - Independent Ad Fraud Researcher
FouAnalytics - site analytics and media analytics for practitioners to detect fraud and take action themselves - on-site tags and in-ad tags measure sites and ad impressions, respectivelyInvestigating digital ad fraud spi virtual meeting
Investigating digital ad fraud spi virtual meetingDr. Augustine Fou - Independent Ad Fraud Researcher
digital ad fraud is what form of crime? counterfeit goods, computer crimes, wire fraud, securities fraud, money laundering? you decideFraud by Browser Study
Fraud filters were found to increase the rate of fraud when enabled across multiple browser types and ad exchanges, with costs 44-67% higher when using fraud filters. Simple blacklists of sites and apps were more effective at reducing fraud. Exchangewide win rates should typically be between 5-15%, and sites with win rates over 70% could be flagged for potential fraud.
Digital Ad Fraud FAQ Question 1
a colleague asked this question - "Publishers claim to only have 0.2-1% IVT on their sites. Can it be possible?” I answered in 22 slides.
Digital ad dollars trickle down chart
When advertisers spend money on digital ads, only a small portion goes to the original creators of the content. The majority is kept by intermediaries like ad exchanges, traffic brokers, and media agencies. On average, only 15% of total spending on programmatic ads makes it to publishers, with the remaining 85% going to these middlemen in the form of fees and commissions.
Botnets used for ad fraud spam ddos attacks
many botnets are known, some are dismantled; but the question is what are botnets mainly used for? use the color coding to decide for yourself
Marketer Outcomes Study
The document compares marketing outcomes between a legacy whitelist of publisher sites and a new hand-picked whitelist. It found that the new whitelist achieved a 70% increase in marketing efficiency as measured by conversions per click. Additionally, the new whitelist resulted in both higher eCPM prices for publishers and better marketing results for advertisers in the form of lower cost per start.
More Related Content
More from Dr. Augustine Fou - Independent Ad Fraud Researcher
Alternative to ANA's end to end supply chain transparency study v final
Alternative to ANA's end to end supply chain transparency study v finalDr. Augustine Fou - Independent Ad Fraud Researcher
The ANA RFP for an update to the supply chain transparency study from the ISBA in 2020 is not even asking the right questions; here's my view. Impact of Loss of 3P Cookies on Publishers' Ad Revenue
Impact of Loss of 3P Cookies on Publishers' Ad RevenueDr. Augustine Fou - Independent Ad Fraud Researcher
Previous studies that addressed the impact of losing third party (“3P”) cookies on ad revenue did not clearly differentiate between the impact on ad tech intermediaries versus on publishers. Instead of “advertiser CPMs” (what advertisers pay) this study uses “media CPMs” (what the publishers get) to better isolate the impact of tracking vs no tracking on publishers.Entire ecosystem supporting ad fraud 2018
“In addition to the ad fraud itself, bad guys make money by selling the “picks and shovels” too – e.g. bots, traffic, clicks, malware, fake apps, etc. They have an entire ecosystem to extract value. What follows are just a few examples, scratching the surface.”
Digital Media Trust Collaborative
The original idea of the digital media trust collaborative is was sharing threat intelligence to more quickly remove fraudulent domains and apps from media buys.
Programmatic reach analysis 2021
most buyers who buy in programmatic channels think they are getting enormous "reach" -- i.e. their ads are shown on many sites; but this data shows the exact opposite is true. Their ads are being shown on a small number of sites (less than 1,000); the buyers might as well have bought more direct from good publishers.
2021 update on ad fraud brand safety privacy
digital ad fraud is as rampant as ever; new ripples caused by privacy regulations are starting to affect the market. and more BS from trade associations pretending to be doing something
Browser and OS Share Jan 2021
U.S. smartphone browser share mirrors the mobile operating system market share, with Android users predominantly using Chrome and iOS users using Safari exclusively. On desktop computers, which are mostly Windows-based, Windows users primarily browse with Chrome. The majority of iOS device users have iOS 13 and Safari 13 installed, with only 6% using browsers other than Safari.
Checking abnormal referrer traffic in google analytics
Checking abnormal referrer traffic in google analyticsDr. Augustine Fou - Independent Ad Fraud Researcher
Using Google Analytics to find abnormal traffic and fraud; this is a how-to, to get hourly charts instead of daily rolled-up or averaged data, which hides the fraud. History and Impact of Digital Ad Fraud
This document provides an overview of the history and global impact of digital ad fraud. It discusses how fraudsters are able to generate infinite fake ad impressions through virtual ads rather than real billboards. The document outlines how major brands like Chase and P&G cut digital ad spending significantly without negative effects after removing fraudulent sites. It also examines how ad fraud has contributed to the decline of local journalism and thousands of newspaper closures. Throughout, it encourages analyzing your own analytics and reports to identify abnormal patterns that may indicate fraud.
Digital Fraud Viewability Benchmarks Q4 2020
digital ad fraud, viewability, ad blocking benchmarks for Q 2020; directly measured across a wide variety of campaigns and sites
What CFEs can do about digital ad fraud
certified fraud examiners can apply their investigative techniques to help identify and root out ad fraud too; no specialized tech is required.
Four types of digital ad spend updated august 2020
Four types of digital ad spend updated august 2020Dr. Augustine Fou - Independent Ad Fraud Researcher
from the IAB FY 2019 advertising revenue report, we show that CPM and CPC ads represent 92% of all digital spend; these are the favorite targets of fraudtersHow to Use FouAnalytics For Marketers
FouAnalytics is an alternative to Google Analytics, but with fraud and bot detection baked in. Marketers can use FouAnalytics to look at their own campaigns, find the domains and apps that are eating up their budgets fraudulently, and turn them off, while the campaign is still running. How does that compare to your blackbox fraud detection that just gives you a percent IVT number?
FouAnalytics DIY site media analytics fraud detection baked in
FouAnalytics DIY site media analytics fraud detection baked inDr. Augustine Fou - Independent Ad Fraud Researcher
FouAnalytics - site analytics and media analytics for practitioners to detect fraud and take action themselves - on-site tags and in-ad tags measure sites and ad impressions, respectivelyInvestigating digital ad fraud spi virtual meeting
Investigating digital ad fraud spi virtual meetingDr. Augustine Fou - Independent Ad Fraud Researcher
digital ad fraud is what form of crime? counterfeit goods, computer crimes, wire fraud, securities fraud, money laundering? you decideFraud by Browser Study
Fraud filters were found to increase the rate of fraud when enabled across multiple browser types and ad exchanges, with costs 44-67% higher when using fraud filters. Simple blacklists of sites and apps were more effective at reducing fraud. Exchangewide win rates should typically be between 5-15%, and sites with win rates over 70% could be flagged for potential fraud.
Digital Ad Fraud FAQ Question 1
a colleague asked this question - "Publishers claim to only have 0.2-1% IVT on their sites. Can it be possible?” I answered in 22 slides.
Digital ad dollars trickle down chart
When advertisers spend money on digital ads, only a small portion goes to the original creators of the content. The majority is kept by intermediaries like ad exchanges, traffic brokers, and media agencies. On average, only 15% of total spending on programmatic ads makes it to publishers, with the remaining 85% going to these middlemen in the form of fees and commissions.
Botnets used for ad fraud spam ddos attacks
many botnets are known, some are dismantled; but the question is what are botnets mainly used for? use the color coding to decide for yourself
Marketer Outcomes Study
The document compares marketing outcomes between a legacy whitelist of publisher sites and a new hand-picked whitelist. It found that the new whitelist achieved a 70% increase in marketing efficiency as measured by conversions per click. Additionally, the new whitelist resulted in both higher eCPM prices for publishers and better marketing results for advertisers in the form of lower cost per start.
More from Dr. Augustine Fou - Independent Ad Fraud Researcher (20)
Alternative to ANA's end to end supply chain transparency study v final
Alternative to ANA's end to end supply chain transparency study v final
Impact of Loss of 3P Cookies on Publishers' Ad Revenue
Impact of Loss of 3P Cookies on Publishers' Ad Revenue
Checking abnormal referrer traffic in google analytics
Checking abnormal referrer traffic in google analytics
Four types of digital ad spend updated august 2020
Four types of digital ad spend updated august 2020
FouAnalytics DIY site media analytics fraud detection baked in
FouAnalytics DIY site media analytics fraud detection baked in
Investigating digital ad fraud spi virtual meeting
Investigating digital ad fraud spi virtual meeting
LinkedIn Stats on Updates by Augustine Fou
- 1. who’s viewed your updates who’s liked or commented on your updates LinkedIn Stats on Updates