Driving Behavioral Change for Information Management through Data-Driven Gree...
Level 5 handling data
1. 1. Daylight hours
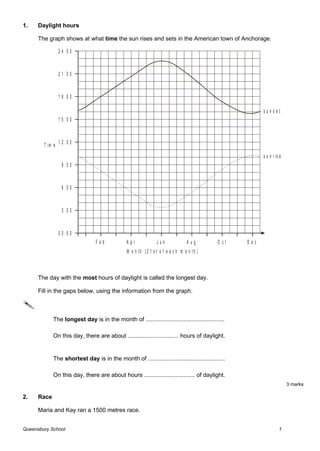
The graph shows at what time the sun rises and sets in the American town of Anchorage.
2 4 :0 0
2 1 :0 0
1 8 :0 0
sunset
1 5 :0 0
T im e 1 2 : 0 0
s u n r is e
9 :0 0
6 :0 0
3 :0 0
0 0 :0 0
Feb Apr Jun Aug O ct D ec
M o n th (2 1 s t o f e a c h m o n th )
The day with the most hours of daylight is called the longest day.
Fill in the gaps below, using the information from the graph.
The longest day is in the month of ................................................
On this day, there are about ............................... hours of daylight.
The shortest day is in the month of ...............................................
On this day, there are about hours ............................... of daylight.
3 marks
2. Race
Maria and Kay ran a 1500 metres race.
Queensbury School 1
2. The distance-time graph shows the race.
M a ria
Kay
1500
1200
D is ta n c e 900
(m e tre s )
600
300
0
0 1 2 3 4 5 6 7 8
T im e ( m in u te s )
Use the graph to help you fill in the gaps in this report of the race.
Just after the start of the race, Maria was in the lead.
At 600 metres, Maria and Kay were level.
Then Kay was in the lead for ...................... minutes.
At ...................... metres, Maria and Kay were level again.
...................... won the race.
2 marks
Her total time was ...................... minutes.
...................... finished ...................... minutes later.
1 mark
3. 3. Quiz
The pupils in five classes did a quiz.
The graphs below show the scores in each class. Each class had a mean score of 7. In three of
the classes, 80% of the pupils got more than the mean score.
C la s s P
100 C la s s R
100
80
% 80
60
of % 60
p u p ils 4 0 of
20 p u p ils 4 0
0 20
0 1 2 3 4 5 6 7 8 9 1 0 11 1 2
0
S c o re 0 1 2 3 4 5 6 7 8 9 10 11 1 2
C la s s Q C la s s S S c o re
100 100
80 80
% 60 % 60
of of
p u p ils 40 p u p ils 40
20 20
0 0
0 1 2 3 4 5 6 7 8 9 10 11 1 2 0 1 2 3 4 5 6 7 8 9 1 0 11 1 2
S c o re S c o re
C la s s T
100
80
% 60
of
p u p ils 4 0
20
0
0 1 2 3 4 5 6 7 8 9 10 11 12
S c o re
(a) In which three classes did 80% of the pupils score more than 7?
Class ........................ and Class ........................ and Class ........................
2 marks
(b) Look at the graphs which show that 80% of the pupils scored more than 7.
Queensbury School 3
4. Some of the statements below are true when 80% of the pupils scored more than 7.
Put a tick ( ) by each statement which is true.
All of the pupils scored at least 2
Most of the pupils scored at least 8
Most of the pupils scored at least 10
Some of the pupils scored less than 6
2 marks
(c) In another quiz the mean score was 6.
Complete this graph to show a mean score of 6.
100
80
%
of 60
p u p ils
40
20
0
0 1 2 3 4 5 6 7 8 9 10 11 12
S c o re
1 mark
5. 4. Cola
Some pupils wanted to know if people can taste the difference
between supermarket cola and more expensive cola.
They asked different people to taste
two drinks.
Then they asked:
Which one is the supermarket cola?
(a) Ali asked 20 people.
The percentage bar chart shows her results.
0% 20% 40% 60% 80% 100%
c o rre c t n o t c o rre c t
70% were correct.
What percentage were not correct?
........................... %
1 mark
(b)Brian asked 50 people.
25 out of 50 were correct.
Complete the percentage bar chart to show Brian’s results.
0% 20% 40% 60% 80% 100%
1 mark
(c) Caro asked 200 people.
The percentage bar chart shows Caro’s results.
0% 20% 40% 60% 80% 100%
c o rre c t n o t c o rre c t
How many of the 200 people were correct?
..................... people
1 mark
Queensbury School 5
6. (d) Ali, Brian and Caro all had different results.
Whose result is likely to be the most reliable?
Tick ( ) your answer.
Ali’s Brian’s Caro’s
Explain why you chose that answer.
1 mark
7. 5. Teachers
The pie charts show how pupils answered three questions about teachers.
Q u e s t io n 1 Q u e s t io n 2 Q u e s t io n 3
S h o u ld t e a c h e r s S h o u ld t e a c h e r s S h o u ld t e a c h e r s t e ll
g iv e h o m e w o r k ? m a k e jo k e s p u p ils o ff if t h e y
in le s s o n s ? f o r g e t t h e ir b o o k s ?
K ey
Yes D o n 't k n o w N o
(a) What was the least common answer to Question 2?
...............................
1 mark
(b) What was the modal answer to Question 3?
...............................
1 mark
(c) About what proportion of pupils answered ‘yes’ to Question 1?
...............................
1 mark
Queensbury School 7