Download to read offline


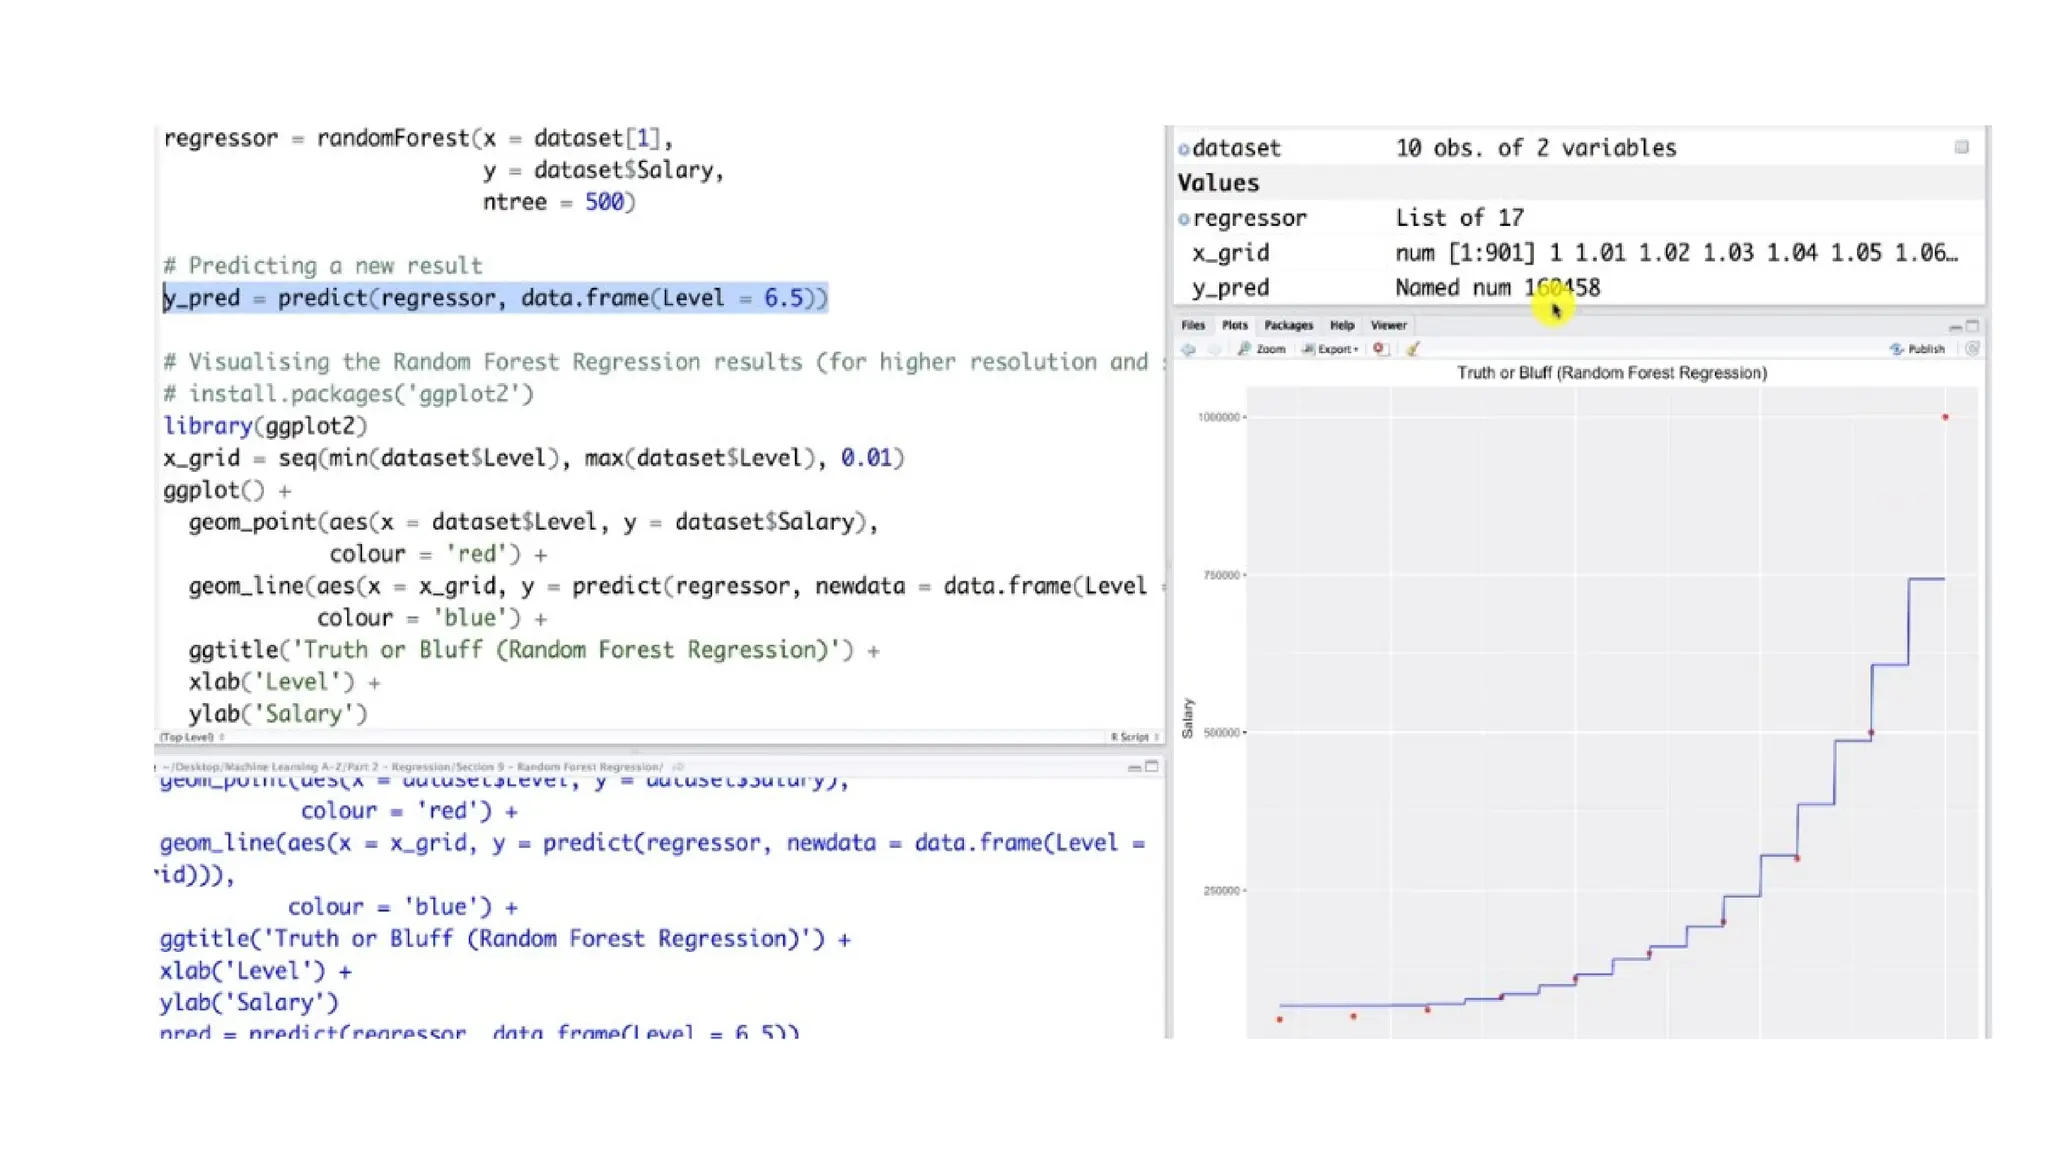


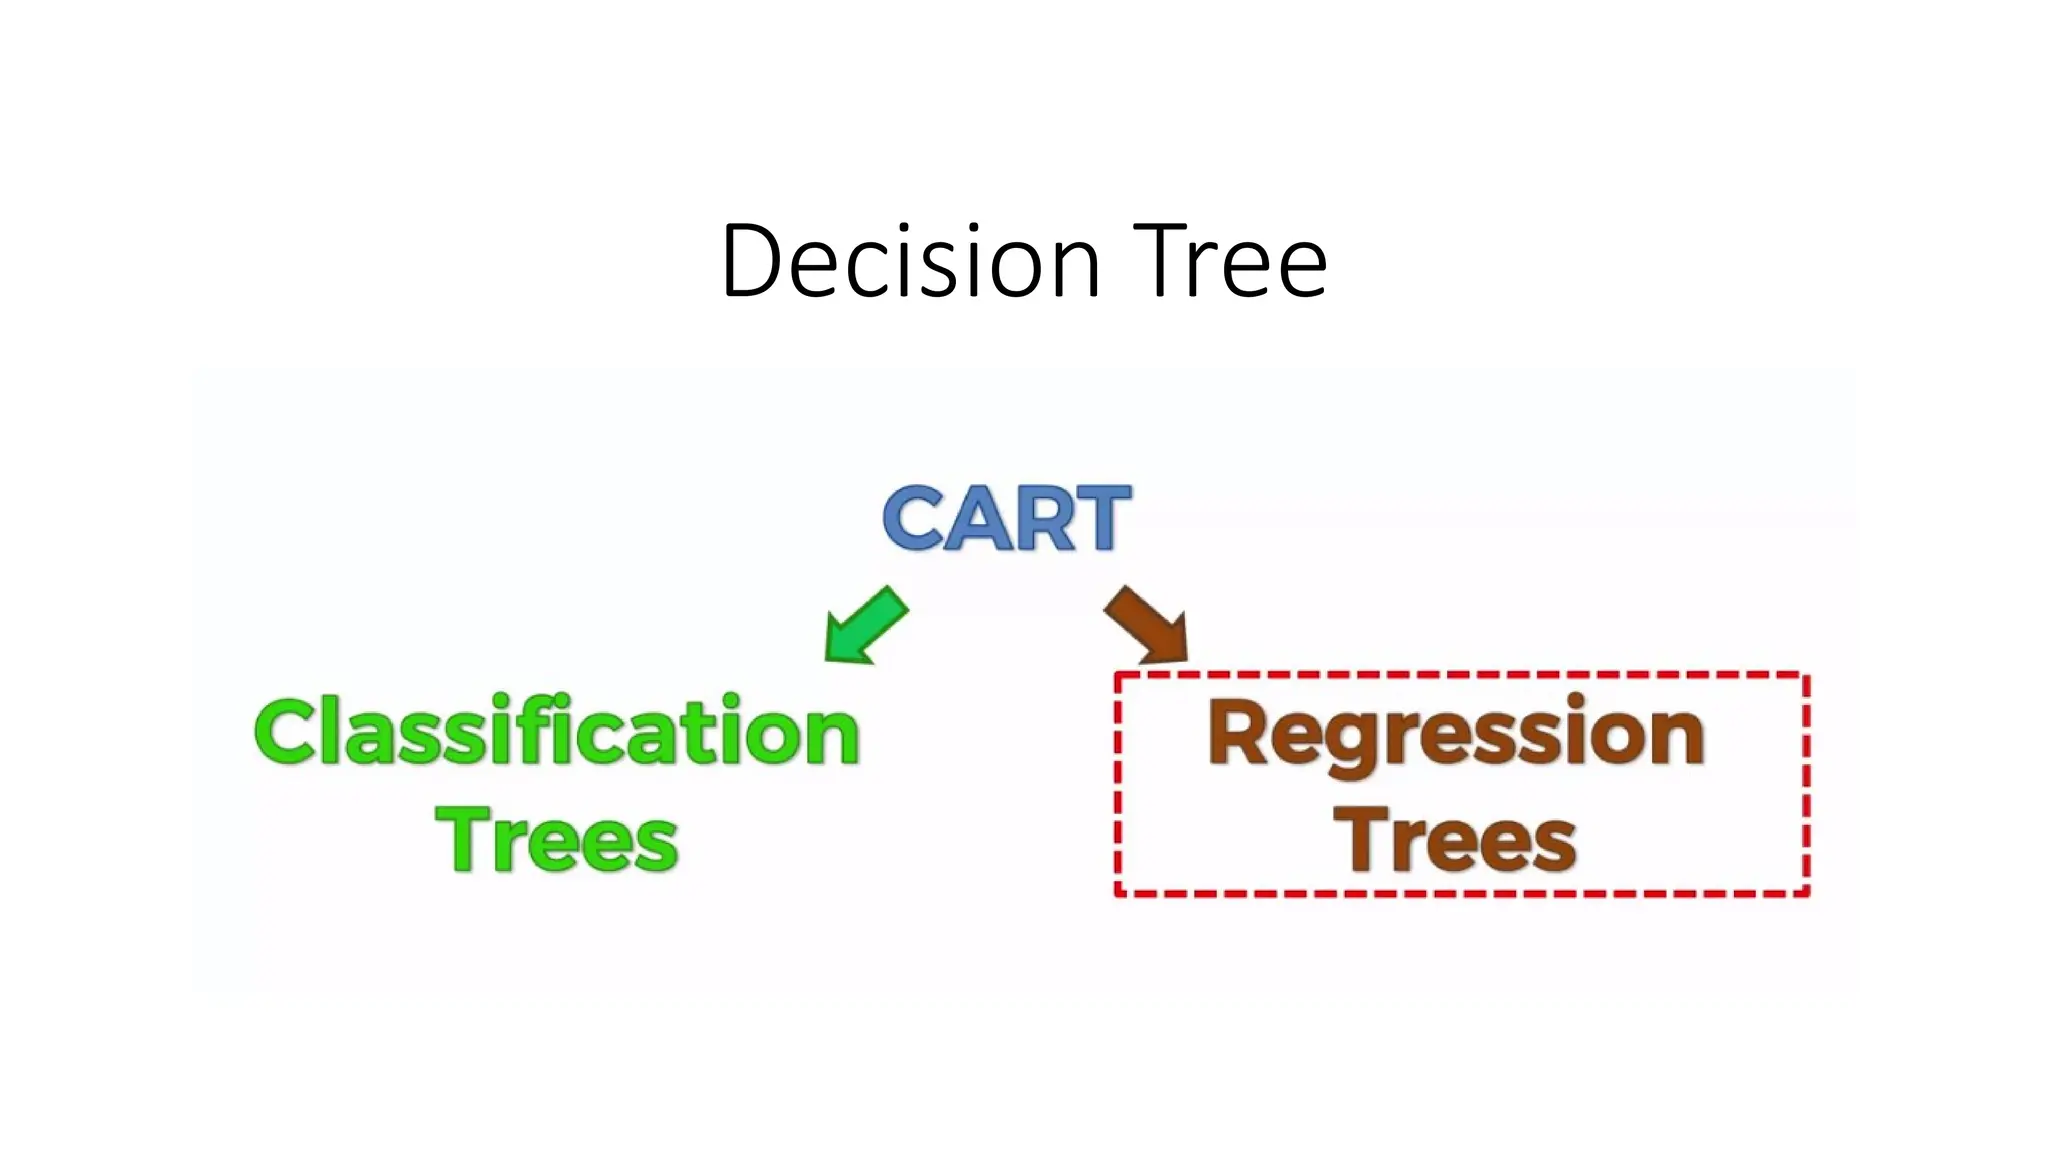
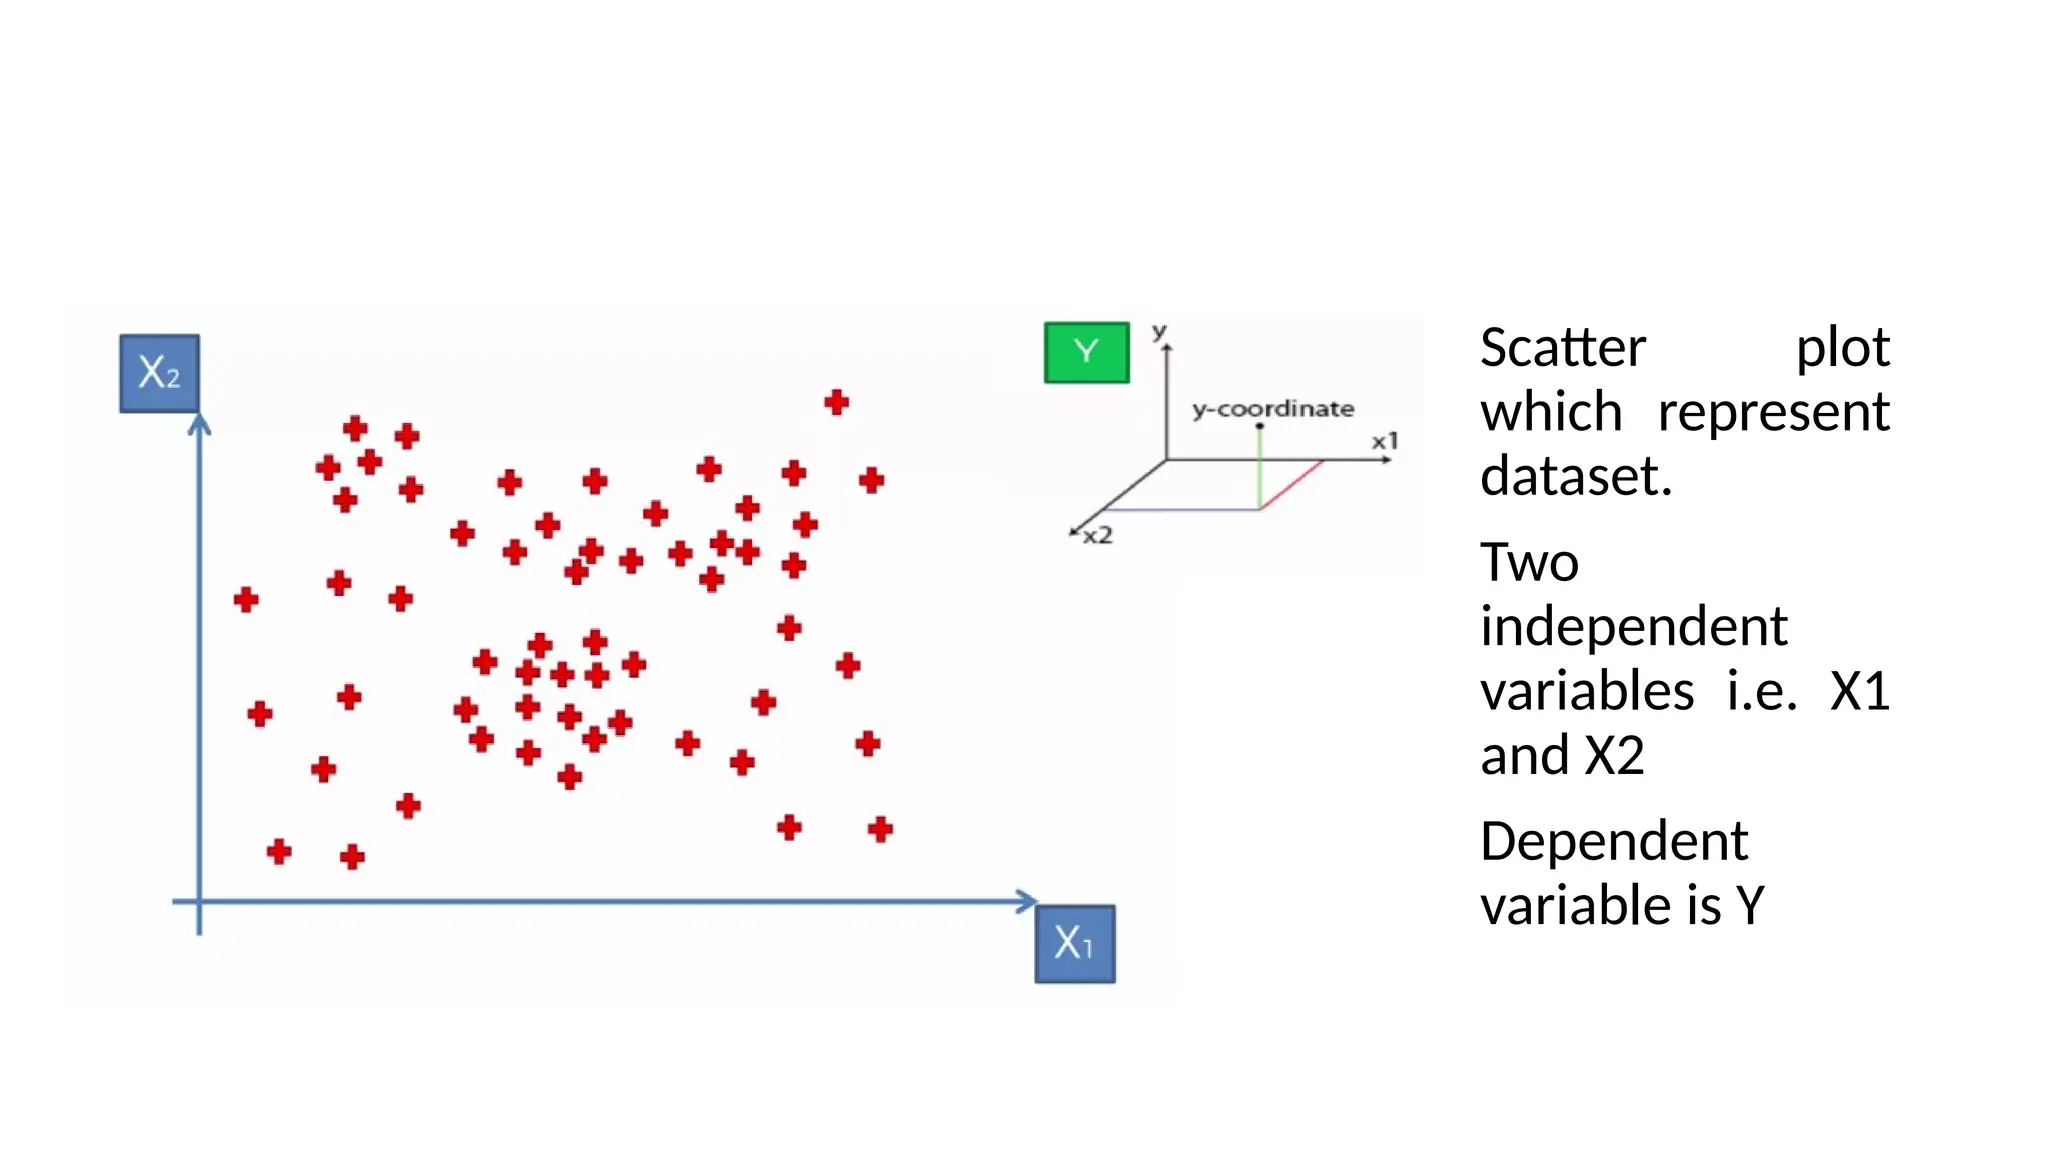


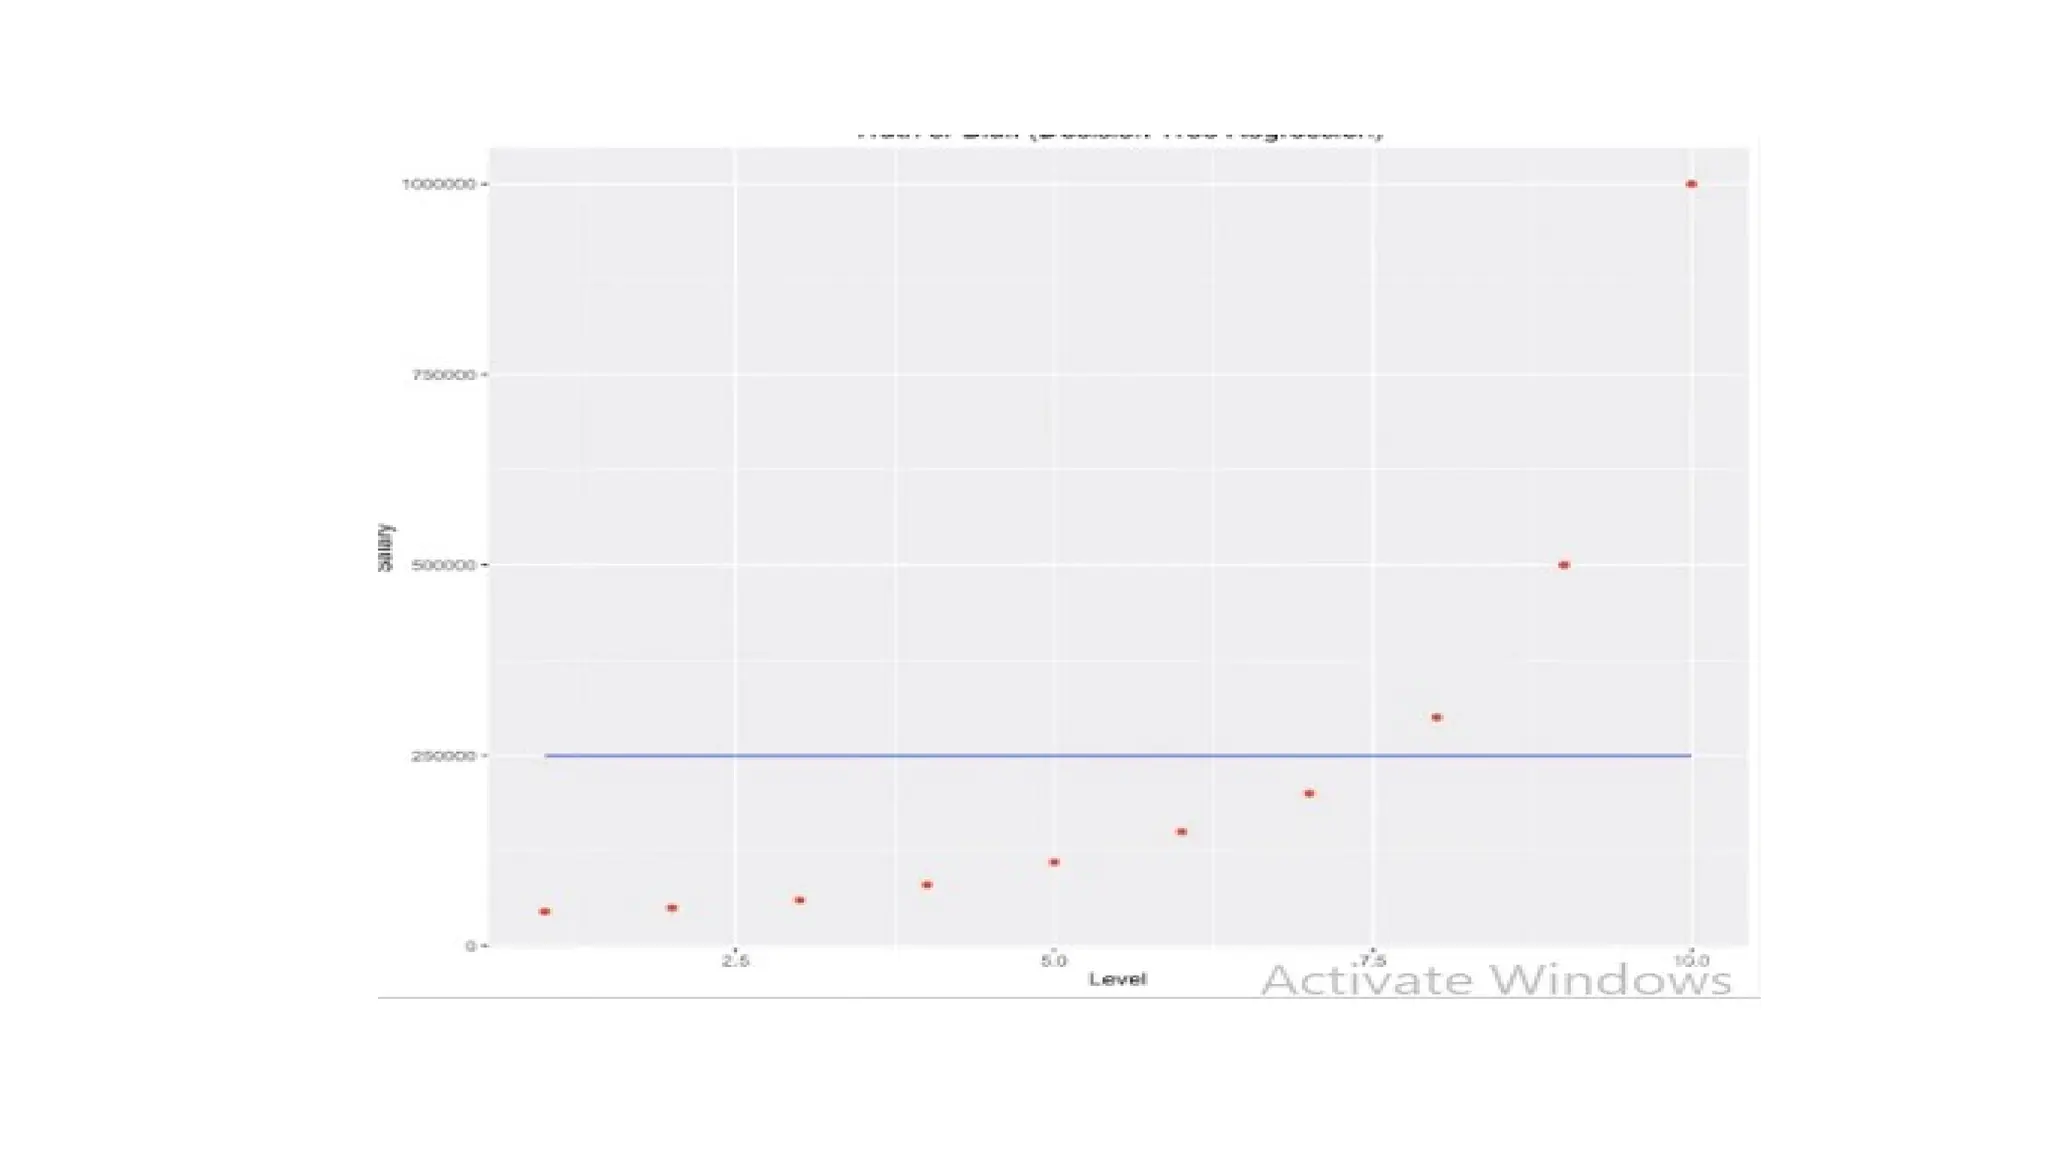


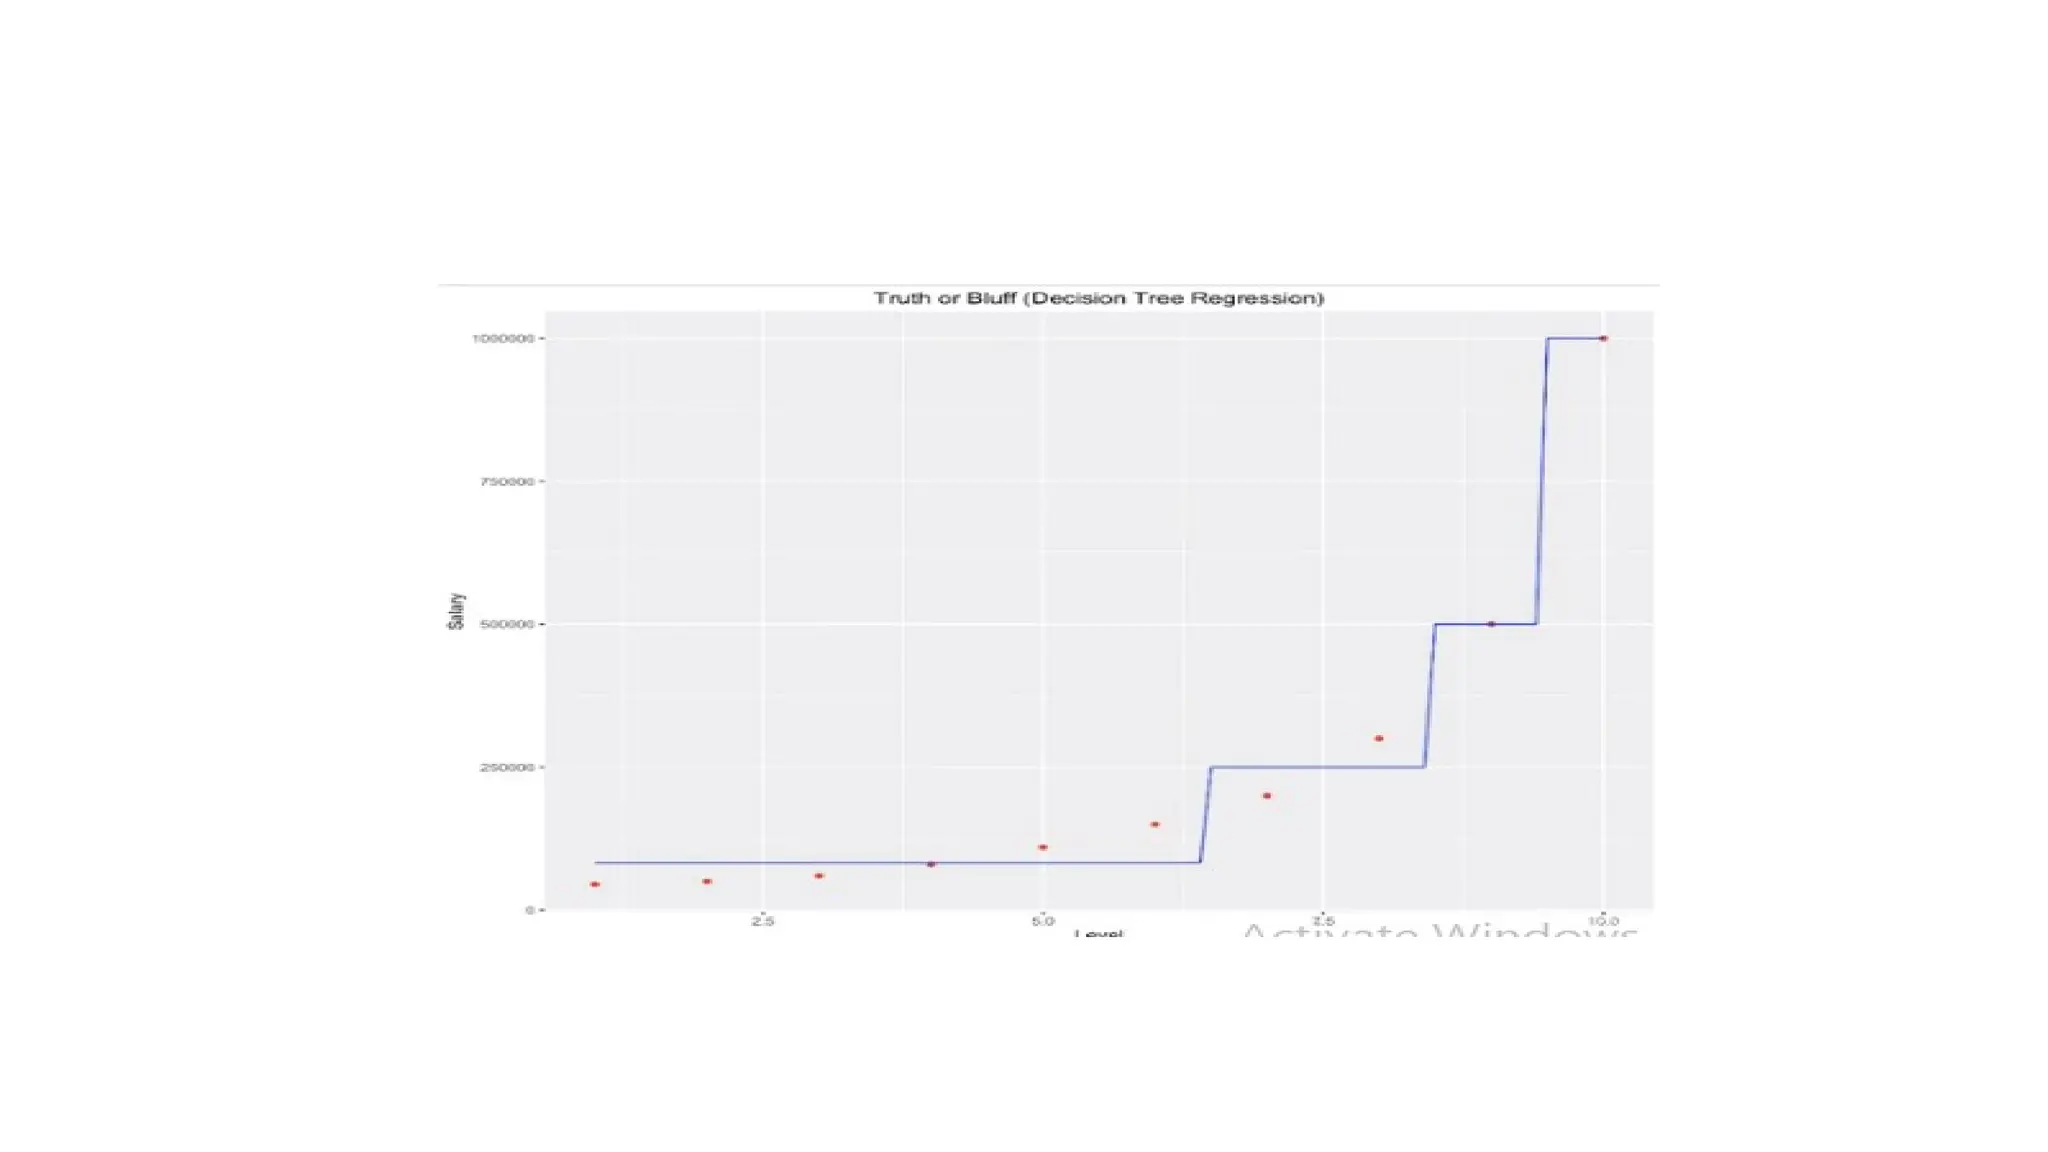

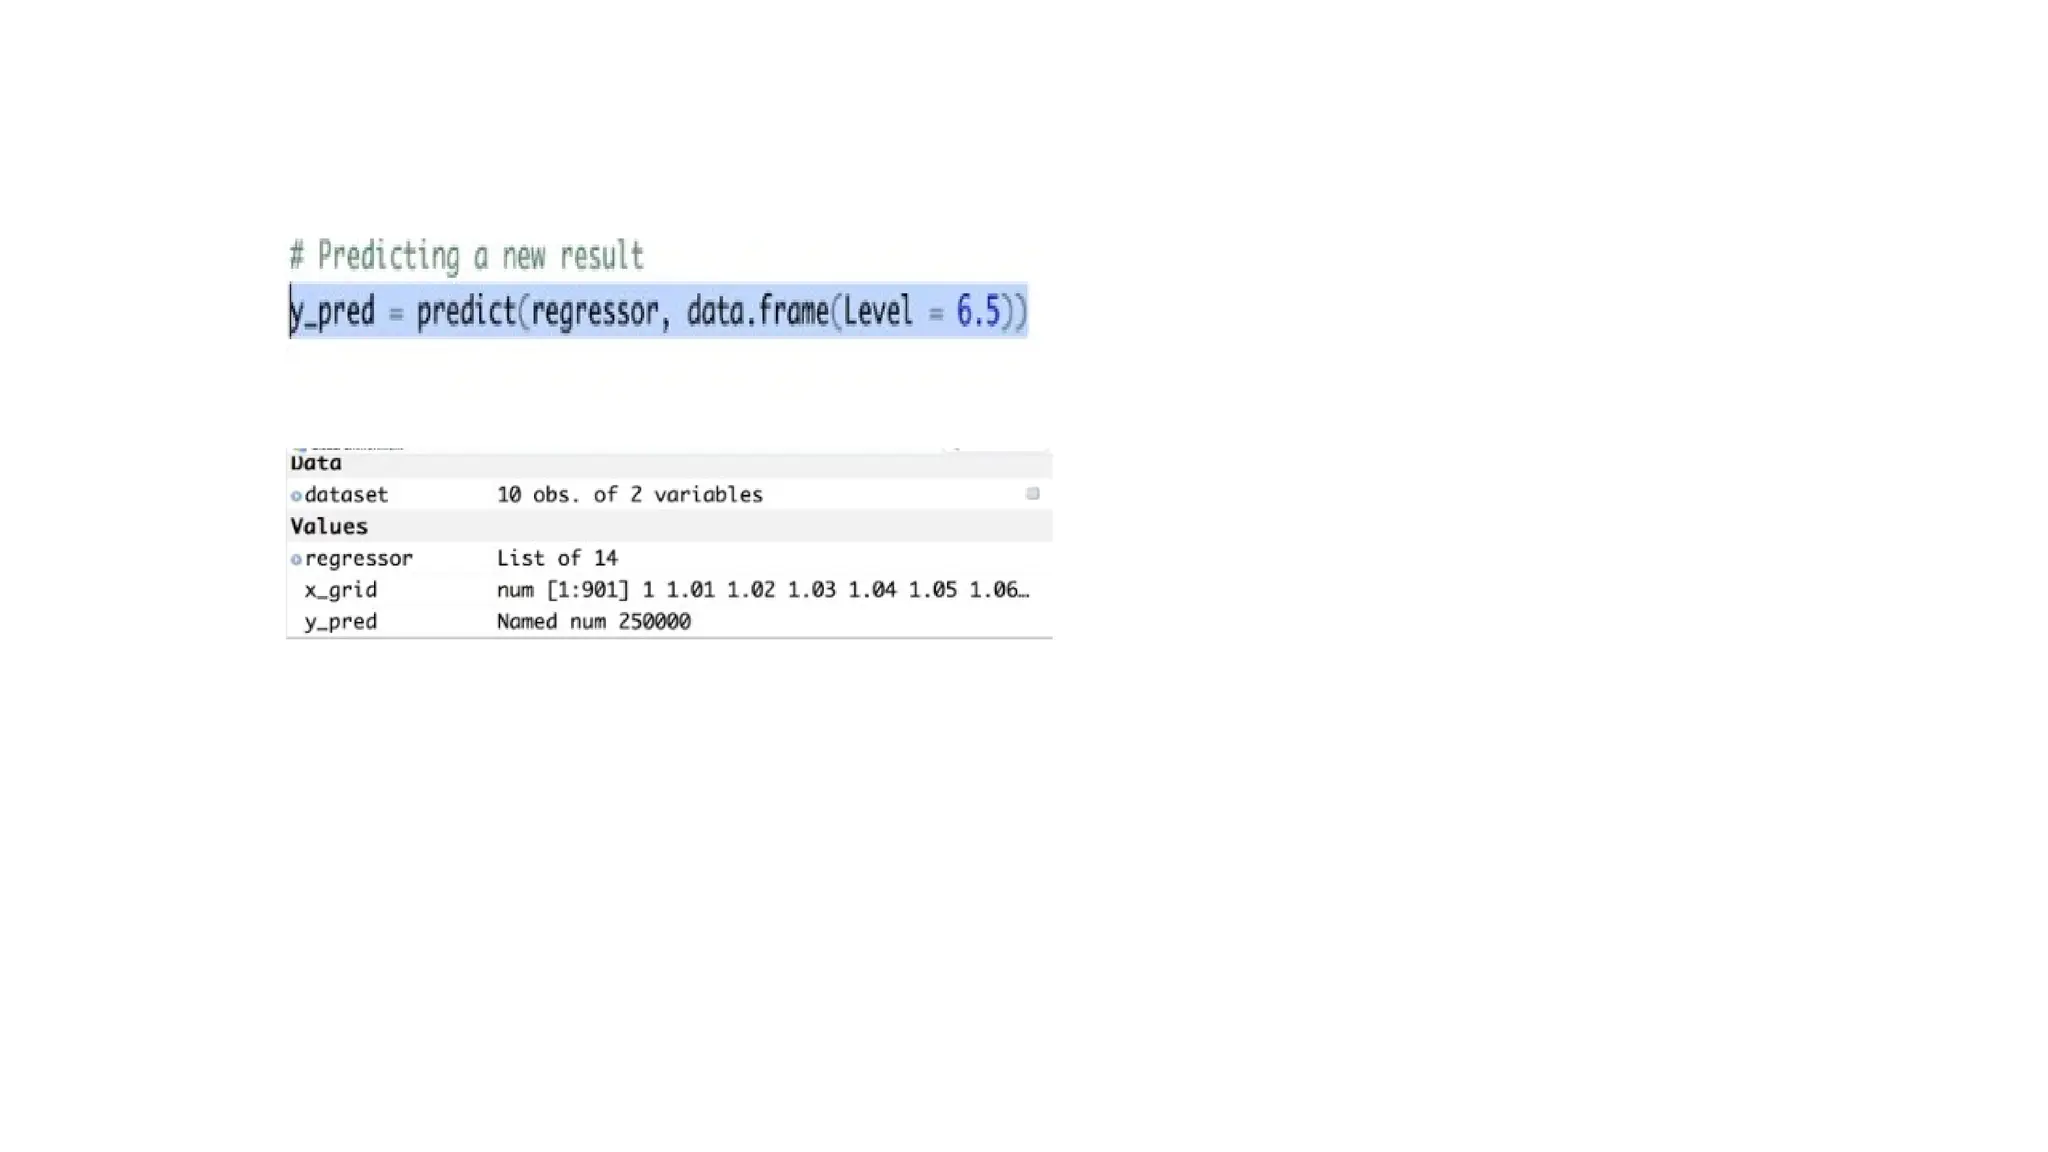
The document discusses the creation of a decision tree regression model using two independent variables (x1 and x2) to predict a dependent variable (y). It outlines the process of segmenting data into terminal leaves and using their averages for predictions. Additionally, it mentions utilizing R for building the regression tree without splitting the dataset, resulting in an average near 250,000.


