Download as PDF, PPTX

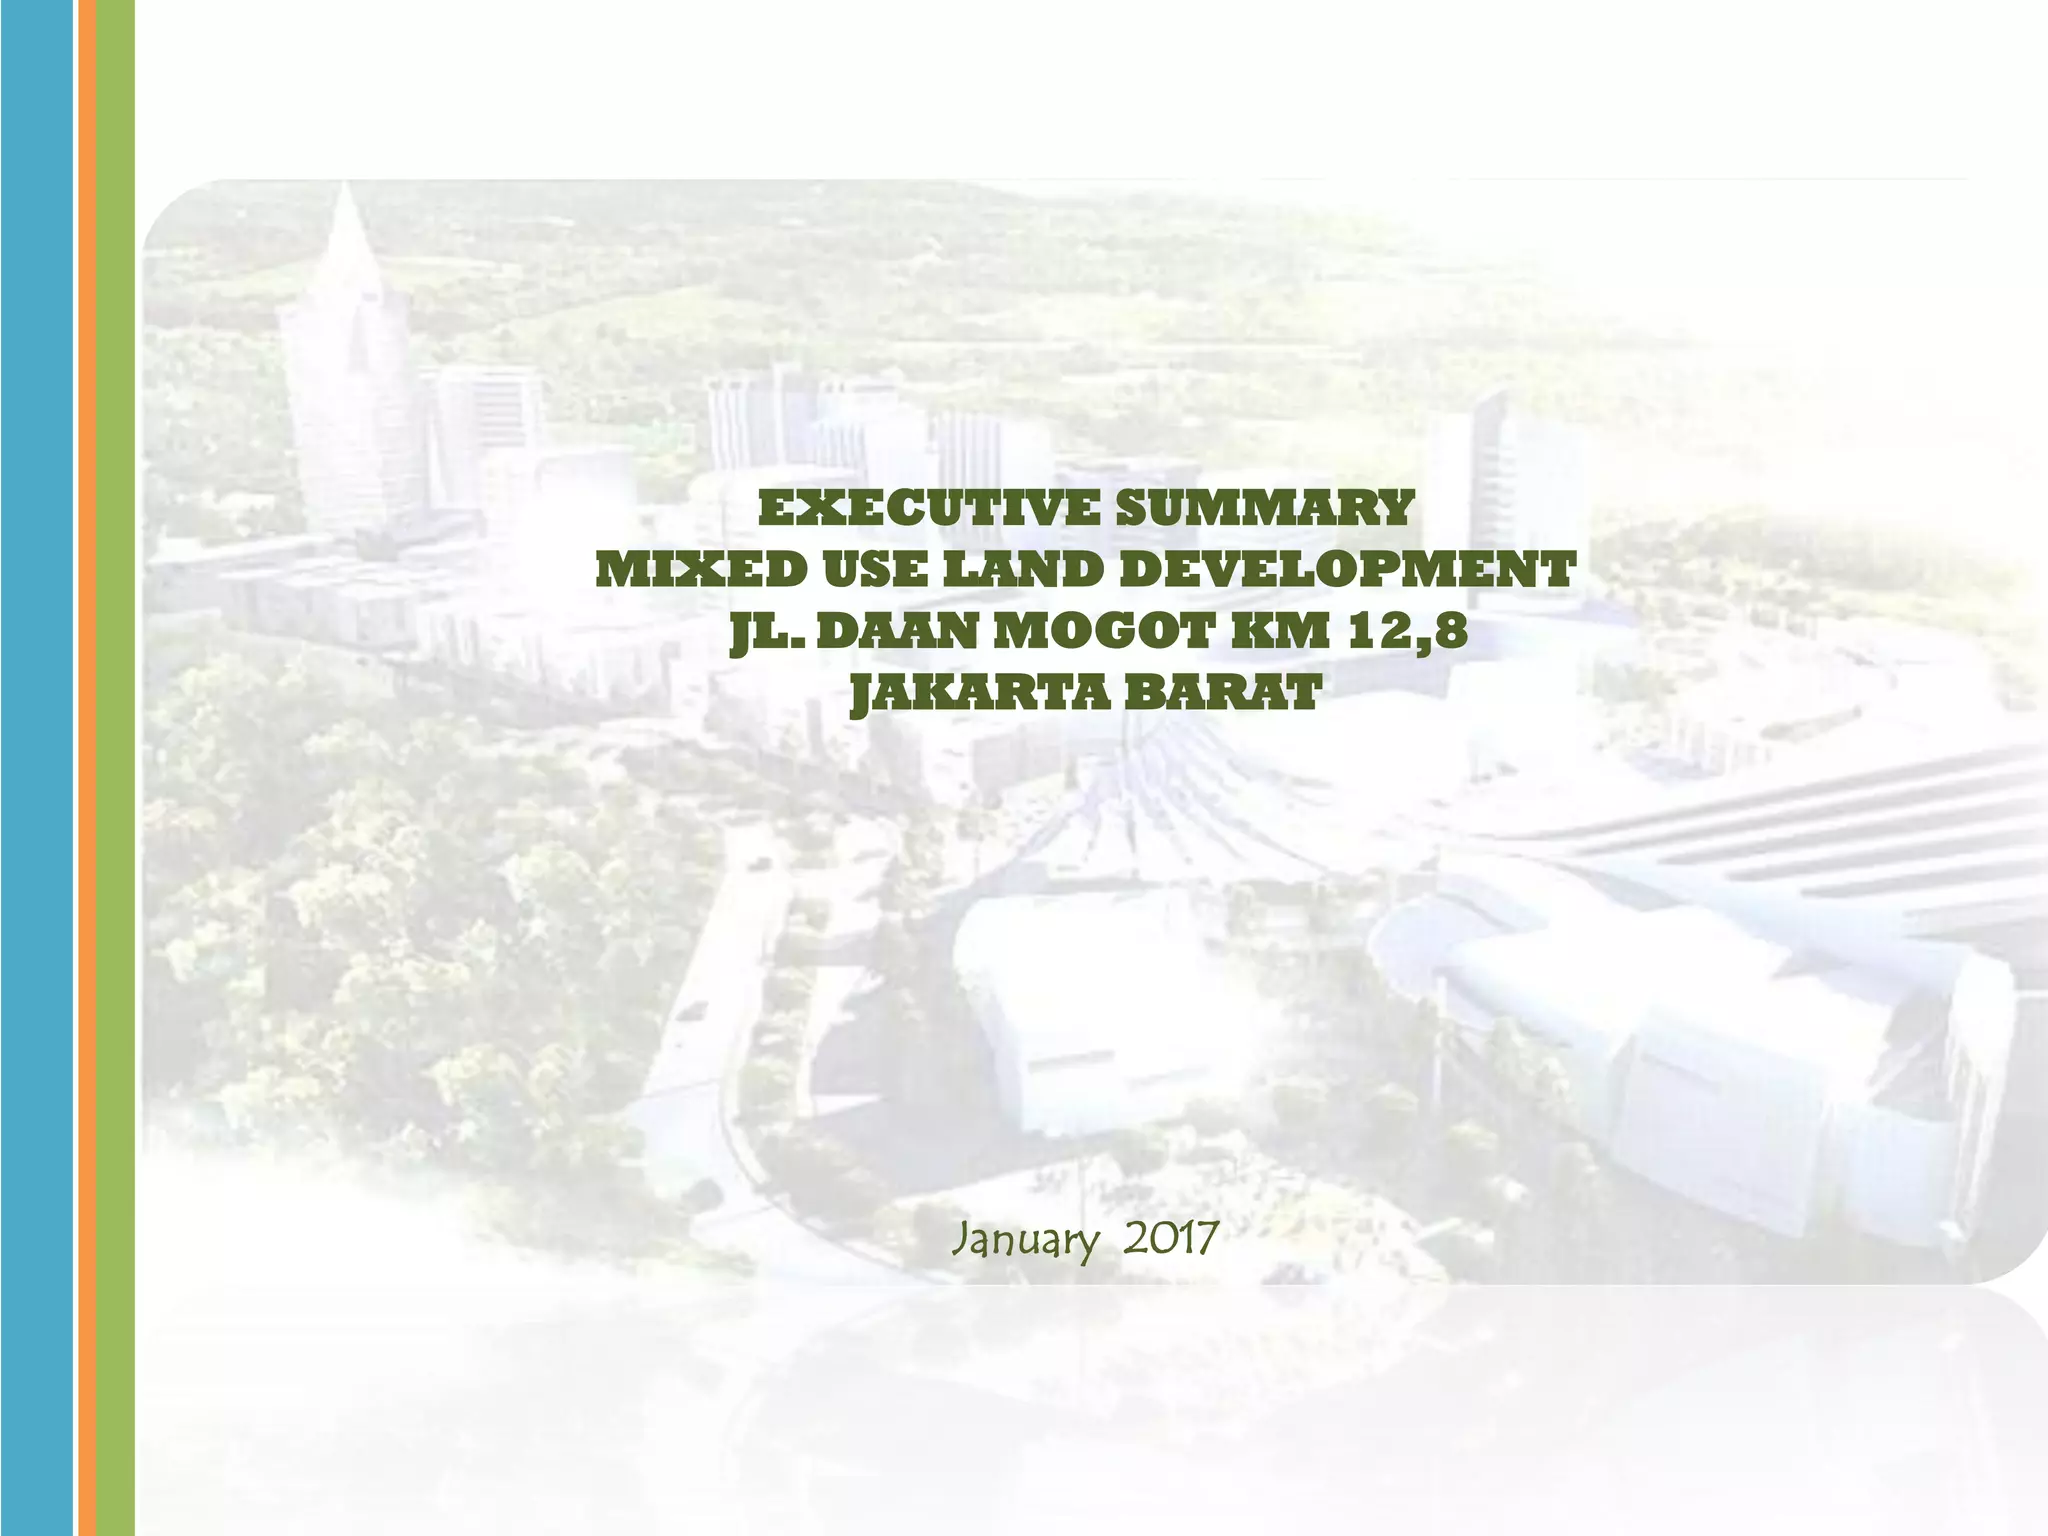

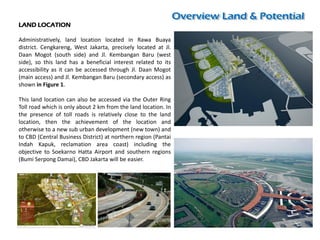
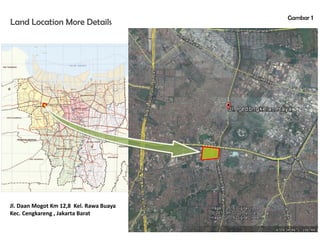
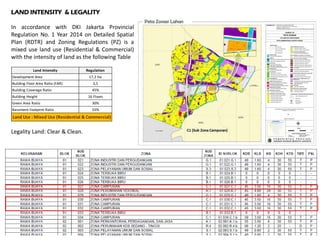

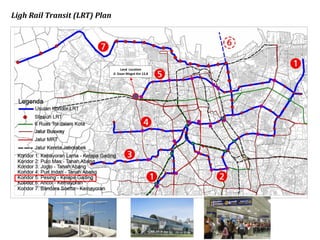
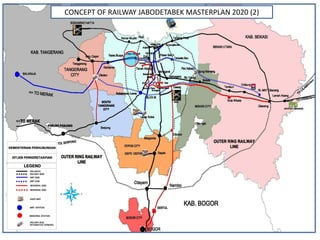

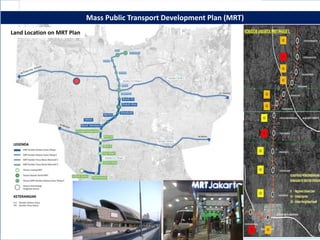
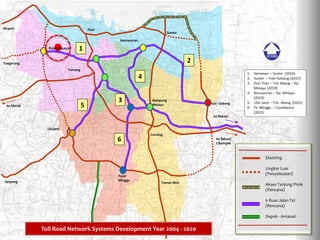
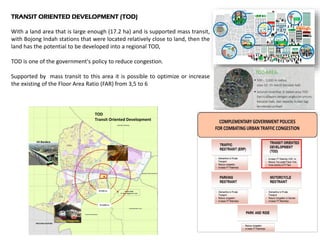
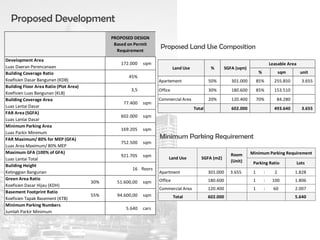
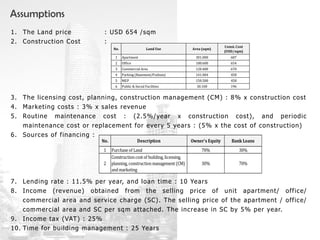
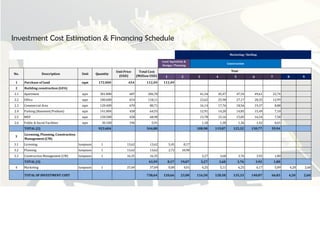
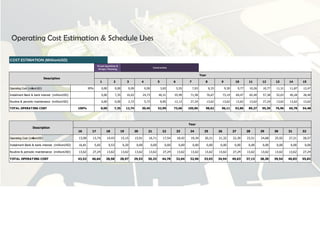
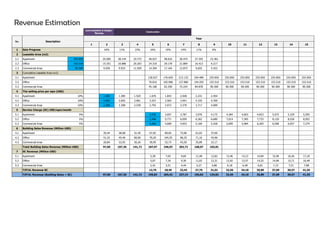
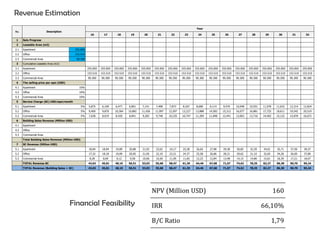


This document summarizes a proposed mixed-use land development project located at Jl. Daan Mogot Km 12.8, West Jakarta. The 17.2-hectare site is zoned for residential and commercial use with a maximum height of 16 floors. It is well-located near transportation infrastructure like the Bojong Indah train station and future LRT and MRT lines. A financial analysis estimates total investment costs of $738.64 million, to be financed through a 70% owner equity and 30% bank loan structure. The proposed development includes 301,000 square meters of apartments, 180,600 square meters of offices, and 120,400 square meters of commercial space.


![A si a sellers kit [05-30-12]](https://cdn.slidesharecdn.com/ss_thumbnails/asiasellerskit05-30-12-120817195055-phpapp01-thumbnail.jpg?width=640&height=640&fit=bounds)


