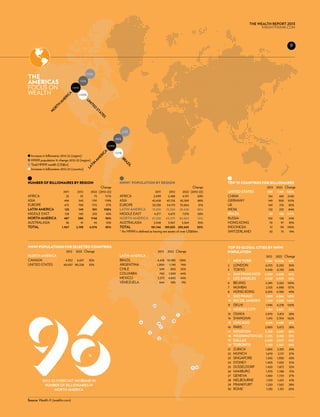
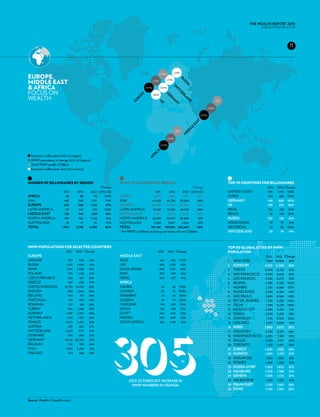
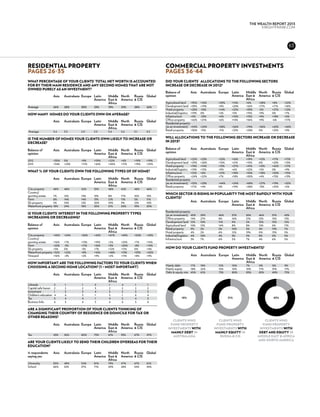
2. The Wealth report 2013
Written by Knight Frank Research
Published on behalf of Knight Frank
by Think, The Pall Mall Deposit,
124-128 Barlby Road,
London, W10 6BL
For Knight Frank
Editor: Andrew Shirley
Head of Research: Liam Bailey
International Research Co-ordinator:
Kate Everett-Allen
Asia-Pacific Research: Nicholas Holt
Marketing: Rebecca Maher
Research enquiries:
liam.bailey@knightfrank.com
Media enquiries:
john.williams@knightfrank.com
for Think
Managing Editor: Louise Bell
Creative Director: Ewan Buck
Designer: Nikki Ackerman
Account Director: Jackie Scully
Managing Director: Polly Arnold
Main illustrations: Vesa Sammalisto
Information graphics: Paul Wootton
Portrait illustrations: Dan Murrell
Printing
Printed by Pureprint Group Ltd
definitions
hnwi
Throughout this report, we use
HNWI as an abbreviation for
high-net-worth individual.
Unless otherwise stated, an
HNWI is defined as someone
with US$30m or more in net
assets. Net assets include homes
and take into account debt and
liabilities where ascertainable.
Prime Property
The most desirable and most
expensive property in a given
location. Prime markets often
have a significant international
bias in terms of buyer profile.
4. The wealth report
The Global Perspective on Prime property and wealth
4
con t en t s
Pages 6-23
Monitor
Onwards and upwards Global wealth distribution 8
Brave old world The Wealth Report Global Cities Survey 16
HNWI interview Dr Chanchai Ruayrungruang 23
Pages 24-45
Performance
safety first Global prime residential performance 26
back to business Commercial property markets 36
HNWI interview Irvine Sellar 45
Pages 46-57
Portfolio
Wealth and well-being The Knight Frank Luxury Investment Index 48
The return of risk Investment choices of the wealthy 54
HNWI interview Howard M Lorber 59
Pages 60-65
Databank
Five-year residential and commercial property performance trends 60
Full results from The Wealth Report Attitudes Survey 62
Luxury investment performance in detail 65
find out more
key contacts: See page 66
Blog: knightfrank.com/wealthreport
Twitter: @knightfrank @kfglobalbrief
App for iPad: knightfrank.com/iPad
Research library: knightfrank.com/research
5. THE WEALTH REPORT 2013
KNIGHTFRANK.com
5
Welcome
W elcome to the latest edition of The Wealth Report,
produced by Knight Frank and now widely recognised as the
leading annual commentary on prime global property markets,
The report highlights the growing interest in commercial
property among private investors (p36), while the results of
our Attitudes Survey suggest that HNWIs are slowly but surely
wealth distribution and the attitudes of the wealthy towards regaining their taste for risk (p54).
property and investments. London and New York are still the most influential cities for
Since we launched the report in 2007, the global economy HNWIs according to our Global Cities Survey (p16), but the key
has provided a turbulent backdrop to each edition. Last year was Asian hubs are catching up fast. This is reflected by the ongoing
no different and we expect that 2013 will also have its share of expansion of Knight Frank’s Asia-Pacific network, enabling us
uncertainty. Despite this, wealth continues to be created; our look to advise HNWI clients across the region.
at how the spread of HNWIs is predicted to change over the next We are fortunate to have led the international prime residential
10 years (p8) gives real food for thought. market in many key locations for the past 20 years, gaining a
One of the most fascinating pieces of research in The Wealth Report unique insight into the wealth arena and building long-term
is the annual update to Knight Frank’s unique Prime International relationships with HNWIs and their advisors around the world.
Residential Index (PIRI). This year, PIRI (p26) shows how 80 of the For many, we are the trophy-asset advisor of choice.
world’s leading luxury property markets are performing. While This unique market knowledge, combined with our in-depth
some are still falling, others are benefiting from their safe haven research, thought leadership and insight, enables us to produce
status, as the wealthy seek a secure location for their assets. publications such as The Wealth Report and helps explain why
This search for safety has also seen the popularity of art, fine Knight Frank has become the world’s leading independent
wines and other “investments of passion” increase. The results of real estate advisor. To find out more about our residential and
our new Luxury Investment Index (p48) reveal just how well some commercial services, including our multi-lingual property search,
of these asset classes have performed. go to knightfrank.com or contact me directly.
Andrew Hay
Head of Global Residential Property, Knight Frank
andrew.hay@knightfrank.com +44 20 7861 1071
contributors
gráinne gilmore james roberts liam bailey andrew shirley mykolas rambus
Head of UK Residential Head of Commercial Global Head of Residential Editor of The Wealth Report, CEO of Wealth-X, a leading
Research, Knight Frank Research, Knight Frank Research, Knight Frank Knight Frank wealth intelligence firm
p8 p36 pp16 and 26 pp48 and 54 p8
6.
7. THE WEALTH REPORT 2013
KNIGHTFRANK.com
7
m oni t or
Creating wealth, it seems, is hardwired into
us as a species. The total number of HNWIs
around the world is increasing once more,
despite the global economy still suffering from
the aftershocks of the credit crunch and
the ensuing financial crisis. Much of this
wealth creation is taking place in the world’s
new economic powerhouses, but London and
New York are still considered the most
important cities for the super-rich –
at least for now...
8 16 23
Onwards and Brave old HNWI
upwards world Interview
Despite the ongoing Our latest Global Cities Dr Chanchai
economic uncertainty, the Survey rankings reveal the Ruayrungruang shares his
world’s HNWI population cities that matter for both passion for investing
continues to rise work and play in property
8. Monitor
Global wealth Distribution and locations favoured by the Super-rich
8
Onwards and
upwards
a region-by-region analysis of wealth creation
based on data and forecasts prepared exclusively
for the wealth report
Gráinne Gilmore
I t has now been six years since the initial signs of the
financial crisis started to emerge, but the global economy
is still feeling the effects. In 2012, economic growth slipped
However, he admits there are challenges. “Credit is
still much more difficult to come by in the wake of the
financial crisis. The capital provided by central bankers’
to its lowest level since 2009. stimulus packages has largely failed to trickle down into
While the signs are that growth will pick up this year, the economy where entrepreneurs can take advantage
many major economies are still performing well below of it. The venture capital world used to be ‘frothy’; that
trend, with some struggling to achieve any improvement in is no longer the case. Having said that, individuals are
economic output at all. But despite this gloomy economic still growing their businesses, but the broader financial
backdrop, there was still room for wealth creation in 2012. conditions are unlikely to change in the near future.”
The number of people with US$30m or more in net assets Economic headwinds, as well as the volatility that
(referred to throughout this report as HNWIs) rose by 5% last characterised the performance of equity and commodity
year, or nearly 8,700, according to data prepared exclusively markets during the year, have had an impact. The total
for The Wealth Report by Wealth-X, a wealth intelligence firm. net worth of HNWIs in Asia, for example, slipped slightly
The combined wealth held by HNWIs also grew by 2%, from US$6.6tr to US$6.4tr in 2012, but their numbers still
or US$566bn, to just over US$26tr in 2012. Over the next rose by 3% overall. “The uneven performance of real estate
10 years, 95,000 people are forecast to break the US$30m and equity markets across Asia has led to the decline in
wealth barrier – a cumulative 50% rise, which will take the wealth,” Mr Rambus says.
total number of HNWIs across the globe to around 285,665. Key Asian stock markets underperformed compared with
Mykolas Rambus, CEO of Wealth-X, says: “There are still wider world indices for much of 2012, although there was a
opportunities in many markets around the world, especially rally towards the end of the year. The FTSE world composite
for those who can look beyond the difficulties in some index of shares climbed modestly, although it ended 2012
developed economies, and take a more global outlook.” some way below the highs seen in 2007.
9 11 13
The americas Europe, Middle Asia-pacific
While the traditional east & africa Mixed fortunes as some
bastions of wealth remain These are testing times for economies begin to slow,
strong, Latin America is HNWIs in both established while elsewhere growth
gaining ground fast and emerging economies gathers pace
9. THE WEALTH REPORT 2013
KNIGHTFRANK.com
9
9,056
The
americas +32%
focus on +96%
wealth +103%
A
IC
ER
AM
U
N
IT
H
RT
ED
O
ST
N
AT
ES
2,232
+88%
+108%
+157%
A
IC
Increase in billionaires 2012-22 (region)
ER
HNWI population % change 2012-22 (region)
AM
BR
AZ
N
Total HNWI wealth (US$bn)
TI
I L
LA
Increase in billionaires 2012-22 (country)
Number of billionaires by region HNWI* population by region Top 10 countries for billionaires
Change Change 2012 2022 Change
2011 2012 2022 (2012-22) 2011 2012 2022 (2012-22) UNITED STATES 543 1,101 103%
AFRICA 25 35 75 117% AFRICA 2,099 2,488 4,197 69% CHINA 154 483 214%
ASIA 496 543 1191 119% ASIA 42,428 43,726 82,369 88% GERMANY 149 300 101%
EUROPE 672 708 1115 57% EUROPE 53,538 54,170 70,864 31% UK 149 276 85%
LATIN AMERICA 123 145 301 108% LATIN AMERICA 13,818 15,230 28,628 88% INDIA 122 225 84%
MIDDLE EAST 128 140 203 45% MIDDLE EAST 4,377 4,675 7,378 58% BRAZIL 53 136 157%
NORTH AMERICA 487 586 1146 96% NORTH AMERICA 61,338 65,579 86,865 32% RUSSIA 102 126 24%
australasia 36 41 45 10% australasia 3,548 3,967 5,364 35% HONG KONG 70 97 39%
Total 1,967 2,198 4,076 85% Total 181,146 189,835 285,665 50% INDONESIA 31 90 190%
* An HNWI is defined as having net assets of over US$30m. SWITZERLAND 63 75 19%
HNWI Populations for selected countries Top 30 global cities by HNWI
2012 2022 Change 2012 2022 Change population
NORTH AMERICA LATIN AMERICA 2012 2022 Change
CANADA 4,922 6,637 35% BRAZIL 4,618 10,985 138% 1 NEW YORK 7,580 10,306 36%
UNITED STATES 60,657 80,228 32% ARGENTINA 1,000 1,743 74% 2 LONDON 6,015 8,202 36%
CHILE 549 850 55% 3 TOKYO 5,440 6,763 24%
COLUMBIA 740 1,063 44% 4 SAN FRANCISCO 4,590 6,665 45%
MEXICO 3,373 4,842 44% 5 LOS ANGELES 4,520 6,075 34%
VENEZUELA 644 585 -9% 6 BEIJING 2,285 5,262 130%
7 MUMBAI 2,105 4,988 137%
8 HONG KONG 3,205 4,780 49%
9 SAO PAULO 1,880 4,566 143%
96
10 RIO DE JANEIRO 1,740 4,285 146%
20 11 DELHI 1,945 4,278 120%
12 MEXICO CITY 2,585 3,901 51%
1 13 OSAKA 2,970 3,813 28%
15 14 SHANGHAI 1,415 3,704 162%
4 18
19 15 CHICAGO 2,615 3,689 41%
17 16 PARIS 2,860 3,672 28%
5 17 HOUSTON 2,295 3,397 48%
18 WASHINGTON DC 2,395 3,188 33%
12
19 DALLAS 2,020 2,927 45%
20 TORONTO 1,765 2,367 34%
21 ZURICH 1,805 2,333 29%
22 MUNICH 1,670 2,117 27%
%
23 SINGAPORE 1,345 1,930 43%
24 SYDNEY 1,405 1,925 37%
9 10 25 DUSSELDORF 1,420 1,872 32%
26 HAMBURG 1,370 1,788 31%
27 GENEVA 1,360 1,724 27%
2012-22 forecast increase in 28 MELBOURNE 1,150 1,621 41%
number of billionaires in 29 FRANKFURT 1,220 1,562 28%
north america 30 ROME 1,130 1,351 20%
Source: Wealth-X (wealthx.com)
10. Monitor
Global wealth Distribution and locations favoured by the Super-rich
10
mixed fortunes will be more than 82,300 HNWIs in Asia, with a combined
China is grappling with what Bert Hofman, Chief East- wealth of US$12.6tr, according to Wealth-X, making it the
Asia and Pacific Economist at the World Bank, calls biggest hub for wealthy individuals outside North America.
a “double whammy” of weaker exports and sluggish
domestic demand. However, it is still expected to continue Cautious optimism
outperforming its rivals, overtaking the US as the world’s Mr Rambus says that the US will remain dominant in terms
largest economy by the end of this decade, based on figures of numbers of HNWIs and billionaires over the next 10 years,
from the Economist Intelligence Unit (see chart below). despite growth in the East. “The industrial revolutions in the
Likewise, wealth creation in China – and wider Asia – US and the UK acted as a base for the large concentration of
will continue, according to Wealth-X, with China’s ultra- wealth still evident in these areas,” he says. North America
wealthy population more than will still have some 30% of the world’s HNWIs in 2022,
doubling by 2022. We examine although this is down from the current 34%.
China’s HNWIs and the role of its Despite weaker Within the US, the biggest rise in the concentration
cities in wealth creation on page 14. of HNWIs is expected to be outside New York, despite its
Indonesia is also expected to exports and status as the world’s pre-eminent global city (see p16).
experience a relative boom over sluggish domestic Wealth-X’s survey of HNWI populations in the world’s
the next decade, albeit from a low leading cities shows that Houston, San Francisco and Dallas
base. HNWIs are tipped to climb by demand, China is will see the most significant rise in HNWIs (see p9) in the US
more than 400% to 5,161 by 2022, still on course to over the next 10 years. New York, however, will still boast the
reflecting international confidence largest number of HNWIs of any city in the world in 2022.
in the potential of the economy, overtake the US as Latin America is another growth story, Mr Rambus says.
as signalled by robust direct the world’s largest “There are huge opportunities in the region, thanks to the
investment during the last year. rise of the middle classes. The natural resources within the
Despite recent economic economy by the end region are also a boost for wealth creation.”
concerns, the number of HNWIs of this decade The number of HNWIs in Brazil is expected to climb by
in India is expected to more than nearly 140%. However, Venezuela is forecast to experience a
double over the next 10 years, drop over the next decade. “We see a diminishing story,” Mr
rising by 137% in Mumbai alone. Rambus says. “Unless there is political change, Venezuela
This will give India – along with will continue to face challenges to creating wealth.”
China and Japan – the highest HNWI populations in Sao Paulo and Rio de Janeiro will
number of HNWIs in Asia by 2022. rise by more than 140% over the next decade, putting them
Intriguingly, Wealth-X figures suggest that one of in the top 10 cities in terms of growth. By 2022, one in 10 of
the most noticeable jumps in HNWI numbers will be in the world’s HNWIs will be living in Latin America.
Myanmar, underlining the link between wealth creation Europe saw the most modest growth in the number of
and an open economy. There are currently fewer than HNWIs last year, a symptom of the ongoing crisis in the
40 HNWIs in the country, Wealth-X estimates, but this is eurozone. The total wealth held by the European ultra-
expected to rise more than seven-fold over the next decade wealthy also remained unchanged at around US$7tr.
in the wake of sweeping political change. The easing of But Wealth-X forecasts that wealth creation will pick
sanctions and pledges of funding for development projects up over the coming years, with a 31% rise in the number
underlines the fact that progress is now being recognised of HNWIs by 2022. Russia and Ukraine will see the highest
internationally. “Foreign firms are establishing a presence growth levels in Europe, but Germany will still be home to
in Myanmar and opportunities to develop infrastructure, the largest population of HNWIs in 2022, followed by the UK.
energy, international banking, and education should This positive outlook is reflected in the Attitudes Survey
enable private enterprises to work with the government to carried out for The Wealth Report. The survey, based on the
develop the country,” Mr Rambus says. opinions of wealth advisors and private bankers, shows
Across Asia, the number of HNWIs is set to rise by 88% that respondents in Europe expect the local economic
over the next decade, the joint highest rate of growth in any situation to have a less negative impact on their clients’
world region, matched only by Latin America. By 2022, there ability to create and preserve wealth this year than in 2012.
World’s top 20 economies by nominal GDP (US$bn at PPP*)
2012 2030
US
CHINA 44,456
us 35,355
CHINA 12,556
15,697
INDIA 21,233
BRAZIL 6,500
FRANCE 4,580
INDIA 4,850
TAIWAN 2,508
INDONESIA 4,568
IRAN 2,280
JAPAN 4,526
UK 4,529
ITALY 3,544
RUSSIAN FED 6,529
MEXICO 5,075
CANADA 3,285
ITALY 1,990
AUSTRALIA 2,438
BRAZIL 2,358
GERMANY 6,533
MEXICO 2,061
TURKEY 3,238
s KOREA 4,105
SPAIN 2,833
UK 2,276
CANADA 1,486
SPAIN 1,488
RUSSIAN fed 2,518
S ARABIA 2,231
GERMANY 3,318
FRANCE 2,331
s KOREA 1,561
INDONESIA 1,216
JAPAN 7,841
TURKEY 1,128
AUSTRALIA 970
TAIWAN 982
POLAND 799
IRAN 975
1 2 3 4 5 6 7 8 9 10 11 12 13 14 15 16 17 18 19 20 1 2 3 4 5 6 7 8 9 10 11 12 13 14 15 16 17 18 19 20
Source: Economist Intelligence Unit * Purchasing Power Parity
11. THE WEALTH REPORT 2013
KNIGHTFRANK.com
11
6,966 +24%
Europe,
middle east
+19%
RU
+31%
SS
& africa
IA
+57% +101%
SW
focus on
IT
ZE
+85%
G
PE
wealth
RL
ER
RO
AN
M
729
EU
AN
D
U
K
Y
+58%
+45%
ST
EA
LE
332
D
ID
M
+69%
+117%
A
Increase in billionaires 2012-22 (region) C
RI
AF
HNWI population % change 2012-22 (region)
Total HNWI wealth (US$bn)
Increase in billionaires 2012-22 (country)
Number of billionaires by region HNWI* population by region Top 10 countries for billionaires
Change Change 2012 2022 Change
2011 2012 2022 (2012-22) 2011 2012 2022 (2012-22) UNITED STATES 543 1,101 103%
AFRICA 25 35 75 117% AFRICA 2,099 2,488 4,197 69% CHINA 154 483 214%
ASIA 496 543 1,191 119% ASIA 42,428 43,726 82,369 88% GERMANY 149 300 101%
EUROPE 672 708 1,115 57% EUROPE 53,538 54,170 70,864 31% UK 149 276 85%
LATIN AMERICA 123 145 301 108% LATIN AMERICA 13,818 15,230 28,628 88% INDIA 122 225 84%
MIDDLE EAST 128 140 203 45% MIDDLE EAST 4,377 4,675 7,378 58% BRAZIL 53 136 157%
NORTH AMERICA 487 586 1,146 96% NORTH AMERICA 61,338 65,579 86,865 32% RUSSIA 102 126 24%
australasia 36 41 45 10% australasia 3,548 3,967 5,364 35% HONG KONG 70 97 39%
Total 1,967 2,198 4,076 85% Total 181,146 189,835 285,665 50% INDONESIA 31 90 190%
* An HNWI is defined as having net assets of over US$30m. SWITZERLAND 63 75 19%
HNWI Populations for selected countries Top 30 global cities by HNWI
2012 2022 Change 2012 2022 Change population
EUROPE MIDDLE EAST 2012 2022 Change
UKRAINE 397 690 74% IRAQ 162 365 125% 1 NEW YORK 7,580 10,306 36%
RUSSIA 1,123 1,694 51% UAE 828 1,270 53% 2 LONDON 6,015 8,202 36%
SPAIN 1,441 2,063 43% SAUDI ARABIA 1,289 1,917 49% 3 TOKYO 5,440 6,763 24%
POLAND 799 1,128 41% IRAN 235 349 49% 4 SAN FRANCISCO 4,590 6,665 45%
CZECH REPUBLIC 265 367 38% ISRAEL 309 437 41% 5 LOS ANGELES 4,520 6,075 34%
GREECE 441 603 37% AFRICA 6 BEIJING 2,285 5,262 130%
UNITED KINGDOM 10,373 14,150 36% ZAMBIA 20 82 310% 7 MUMBAI 2,105 4,988 137%
SWEDEN 990 1,344 36% UGANDA 20 81 305% 8 HONG KONG 3,205 4,780 49%
IRELAND 554 751 36% ZIMBABWE 16 61 281% 9 SAO PAULO 1,880 4,566 143%
PORTUGAL 735 984 34% ALGERIA 34 111 226% 2
22 29 10 RIO DE JANEIRO 1,740 4,285 146%
ROMANIA 137 183 34% TANZANIA 118 329 179% 16 25 26 11 DELHI 1,945 4,278 120%
TURKEY 936 1,248 33% KENYA 142 248 75% 12 MEXICO CITY 2,585 3,901 51%
21 27
NORWAY 1,397 1,790 28% EGYPT 544 865 59% 30 13 OSAKA 2,970 3,813 28%
NETHERLANDS 1,181 1,512 28% NIGERIA 529 809 53% 14 SHANGHAI 1,415 3,704 162%
FRANCE 4,074 5,212 28% SOUTH AFRICA 828 1,149 39% 15 CHICAGO 2,615 3,689 41%
305
AUSTRIA 539 687 27% 16 PARIS 2,860 3,672 28%
SWITZERLAND 5,657 7,171 27% 17 HOUSTON 2,295 3,397 48%
DENMARK 706 894 27% 18 WASHINGTON DC 2,395 3,188 33%
GERMANY 16,192 20,286 25% 19 DALLAS 2,020 2,927 45%
BELGIUM 750 933 24% 20 TORONTO 1,765 2,367 34%
ITALY 1,892 2,294 21% 21 ZURICH 1,805 2,333 29%
FINLAND 412 486 18% 22 MUNICH 1,670 2,117 27%
23 SINGAPORE 1,345 1,930 43%
% 24 SYDNEY 1,405 1,925 37%
25 DUSSELDORF 1,420 1,872 32%
26 HAMBURG 1,370 1,788 31%
27 GENEVA 1,360 1,724 27%
2012-22 forecast increase in 28 MELBOURNE 1,150 1,621 41%
HNWI numbers in Uganda 29 FRANKFURT 1,220 1,562 28%
30 ROME 1,130 1,351 20%
Source: Wealth-X (wealthx.com)
12. Monitor
Global wealth Distribution and locations favoured by the Super-rich
12
Challenging times
The Attitudes Survey also shows that HNWIs across the The big
globe remain concerned about the possible impact of
punitive tax policies. France plans to hit high earners with
question
a tax rate of up to 75%, while countries including Spain What will have
and Ireland have also imposed wealth or property taxes. the biggest impact
Italy and Spain are the only countries where the number of on HNWI wealth
billionaires is expected to fall over the next decade. creation over the
The tax landscape is a key risk for wealth creation in next 10 years?
the coming years. “There are different motivations behind Dr elizabeth
some of the recent tax rises,” Mr Rambus says. “In Hong stephens
Kong and Singapore, they are designed to address specific
concerns – such as an overheating housing market.
In other countries, governments are searching for ways to
repair their balance sheets. Coming down hard on the
wealthy creates some ‘political theatre’.” China’s new leadership, headed by
The growing generation gap, in both developed President Xi Jinping and Premier Li
and developing economies, poses another risk. Rising Keqiang, will shape the course of the
youth unemployment creates the prospect of a “lost country’s economic and foreign policy
generation” with no hope of the same levels of financial for the next decade – and, in doing so, The restructuring, or at least
or social success as determine the state of wealth creation rebalancing, of China’s economy
their parents and worldwide. The leaders are expected has been deferred for a decade,
grandparents. For For former to focus on solidifying internal due to the seismic shift involved in
former US Treasury support rather than grandiose reform reducing dependence on exports
Secretary Larry
US Treasury initiatives, and an anti-corruption drive and infrastructural investments and
Summers, this is Secretary Larry is likely to be prioritised to help boost stimulating domestic consumption-
our most pressing credibility within government and driven growth. This implies handing
long-term issue.
Summers, youth among the public. over more resources to ordinary
In Europe and unemployment is Yet the real question – and the one people, and letting them decide how to
the US, youth with global ramifications – is not who spend them, thus reducing the state’s
unemployment has
our most pressing China’s new leaders are, or whether capacity to control the economy.
risen sharply since long-term issue they will introduce far-reaching Such a move requires a united
the financial crisis. economic reforms or adopt a more leadership willing and able to take
In Africa, it threatens assertive foreign policy, but whether risks. China’s new leaders may be
to act as a drag on they can remain united at a time when technically able, but they are as yet
economic growth. decisive leadership is required. unproven in this department. The
Around 60% of The new leaders’ educational prospects for managed economic
Africa’s unemployed background and world view are change remain uncertain.
are aged between 15 and 24, and the rate of youth more diverse than those of their Whatever happens, the global
unemployment in North Africa is the highest in the world, predecessors, which may make impact will be significant. China makes
according to the International Labour Organisation (ILO). consensus harder. A split would signal the largest global contribution to
There is real impetus for policymakers to address disunity and cast doubt on the party’s growth rates – an average of 10% since
this challenge. Economic growth in sub-Saharan African ability to quell challenges from below, joining the World Trade Organization
countries has been impressive in recent years, despite a encouraging those calling for more in 2001. Any slowdown will have a
slowdown in 2011 due to the political turmoil of the rapid social change. profound effect on investments and
Arab Spring. Ethiopia, Nigeria, Ghana and Rwanda all If it were to coincide with a on the ability of HNWIs to create
posted GDP growth of between 6% and 8% last year, sustained economic slowdown, friction further wealth, not just in China and
according to the latest estimates. at the top would temper the party’s Asia, but around the world.
The number of young people in Africa is set to double ability to manage public perceptions
by 2045, and harnessing their ability and skills is crucial of the economy. The interpretation of Elizabeth Stephens is Head of Credit and
Political Risk Analysis at JLT Specialty
to further bolster economic growth and to enable these economic statistics varies dramatically and plays a leading role in the firm’s World
fast-growing developing countries to realise their potential in all parts of the world in line with Risk Review ratings tool. Her PhD is on
in terms of wealth creation. However, it is a sign of the political expediency, and centralised US foreign policy and the Middle East.
She lectures at the University of
opportunities on offer within Africa that HNWI numbers dissemination of data helps to sustain Birmingham’s Department of American
are expected to double if not treble (albeit from relatively an economic narrative. and Canadian Studies.
low bases) in a number of countries (p11), contributing to
HNWI growth of 69% across the entire continent.
The economic crisis may have put the brakes on global
wealth creation to some extent. But it is clear that the
appetite to build wealth, particularly in ambitious, rapidly
developing nations, remains as strong as ever.
13. THE WEALTH REPORT 2013
KNIGHTFRANK.com
13
Asia-
pacific
focus on
wealth
6,444 +214%
+88% +39%
CH
IN
A
+119% +190%
H
O
N
+84%
G
IA
IN
KO
AS
D
N
O
G
IN
N
496
ES
D
IA
IA
+35%
+10%
A
SI
Increase in billionaires 2012-22 (region)
LA
RA
HNWI population % change 2012-22 (region)
ST
Total HNWI wealth (US$bn)
AU
Increase in billionaires 2012-22 (country)
Number of billionaires by region HNWI* population by region Top 10 countries for billionaires
change Change 2012 2022 Change
2011 2012 2022 (2012-22) 2011 2012 2022 (2012-22) UNITED STATES 543 1,101 103%
AFRICA 25 35 75 117% AFRICA 2,099 2,488 4,197 69% CHINA 154 483 214%
ASIA 496 543 1,191 119% ASIA 42,428 43,726 82,369 88% GERMANY 149 300 101%
EUROPE 672 708 1,115 57% EUROPE 53,538 54,170 70,864 31% UK 149 276 85%
LATIN AMERICA 123 145 301 108% LATIN AMERICA 13,818 15,230 28,628 88% INDIA 122 225 84%
MIDDLE EAST 128 140 203 45% MIDDLE EAST 4,377 4,675 7,378 58% BRAZIL 53 136 157%
NORTH AMERICA 487 586 1,146 96% NORTH AMERICA 61,338 65,579 86,865 32% RUSSIA 102 126 24%
australasia 36 41 45 10% australasiA 3,548 3,967 5,364 35% HONG KONG 70 97 39%
Total 1,967 2,198 4,076 85% Total 181,146 189,835 285,665 50% INDONESIA 31 90 190%
* An HNWI is defined as having net assets of over US$30m. SWITZERLAND 63 75 19%
HNWI Populations for selected countries Top 30 global cities by HNWI
2012 2022 Change 2012 2022 Change population
ASIA australasiA 2012 2022 Change
MYANMAR 39 307 687% AUSTRALIA 3,432 4,635 35% 1 NEW YORK 7,580 10,306 36%
INDONESIA 1,029 5,161 402% NEW ZEALAND 500 665 33% 2 LONDON 6,015 8,202 36%
MONGOLIA 49 230 369% 3 TOKYO 5,440 6,763 24%
CHINA 10,849 25,660 137% 4 SAN FRANCISCO 4,590 6,665 45%
CAMBODIA 54 112 107% 5 LOS ANGELES 4,520 6,075 34%
INDIA 8,481 17,032 101% 3 6 BEIJING 2,285 5,262 130%
BANGLADESH 78 155 99% 6 13 7 MUMBAI 2,105 4,988 137%
SRI LANKA 64 120 88% 8 HONG KONG 3,205 4,780 49%
VIETNAM 186 344 85% 14
9 SAO PAULO 1,880 4,566 143%
KAZAKHSTAN 135 244 81% 11
8 10 RIO DE JANEIRO 1,740 4,285 146%
PHILIPPINES 662 1,079 63% 7 11 DELHI 1,945 4,278 120%
TAIWAN 1,181 1,871 58% 12 MEXICO CITY 2,585 3,901 51%
MALAYSIA 828 1,249 51% 13 OSAKA 2,970 3,813 28%
THAILAND 681 1,018 49% 14 SHANGHAI 1,415 3,704 162%
HONG KONG 3,206 4,778 49% 15 CHICAGO 2,615 3,689 41%
687
SOUTH KOREA 1,412 2,061 46% 23 16 PARIS 2,860 3,672 28%
SINGAPORE 1,343 1,932 44% 17 HOUSTON 2,295 3,397 48%
JAPAN 12,668 16,264 28% 18 WASHINGTON DC 2,395 3,188 33%
PAKISTAN 368 446 21% 19 DALLAS 2,020 2,927 45%
20 TORONTO 1,765 2,367 34%
21 ZURICH 1,805 2,333 29%
22 MUNICH 1,670 2,117 27%
23 SINGAPORE 1,345 1,930 43%
% 24 SYDNEY 1,405 1,925 37%
25 DUSSELDORF 1,420 1,872 32%
24 26 HAMBURG 1,370 1,788 31%
28 27 GENEVA 1,360 1,724 27%
2012-22 forecast increase in 28 MELBOURNE 1,150 1,621 41%
HNWI numbers in myanmar 29 FRANKFURT 1,220 1,562 28%
30 ROME 1,130 1,351 20%
Source: Wealth-X (wealthx.com)