Kf 4
•Download as DOCX, PDF•
0 likes•97 views

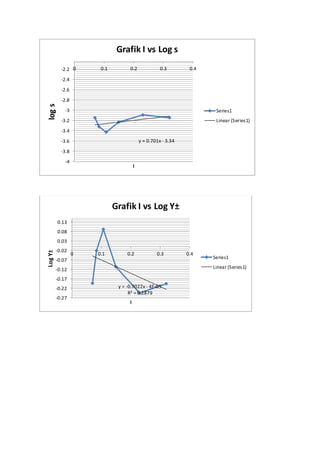
The document contains two graphs with linear trend lines. The first graph plots log s on the x-axis and I on the y-axis, with the linear trend line having a slope of 0.701 and y-intercept of -3.34. The second graph plots log Y± on the x-axis and I on the y-axis, with the linear trend line having a slope of -0.7022 and y-intercept of -0.00004 and an R2 value of 0.2879.

Recommended
More Related Content
More from Fujikawa Kenza
More from Fujikawa Kenza (7)
Recently uploaded
Recently uploaded (20)
Kf 4
- 1. Grafik I vs Log s -2.2 0 0.1 0.2 0.3 0.4 y = 0.701x - 3.34 -2.4 -2.6 -2.8 -3 -3.2 -3.4 -3.6 -3.8 -4 log s I Series1 Linear (Series1) Grafik I vs Log Y± y = -0.7022x - 4E-05 R² = 0.2879 0.13 0.08 0.03 -0.02 -0.07 -0.12 -0.17 -0.22 -0.27 0 0.1 0.2 0.3 0.4 Log Y± I Series1 Linear (Series1)