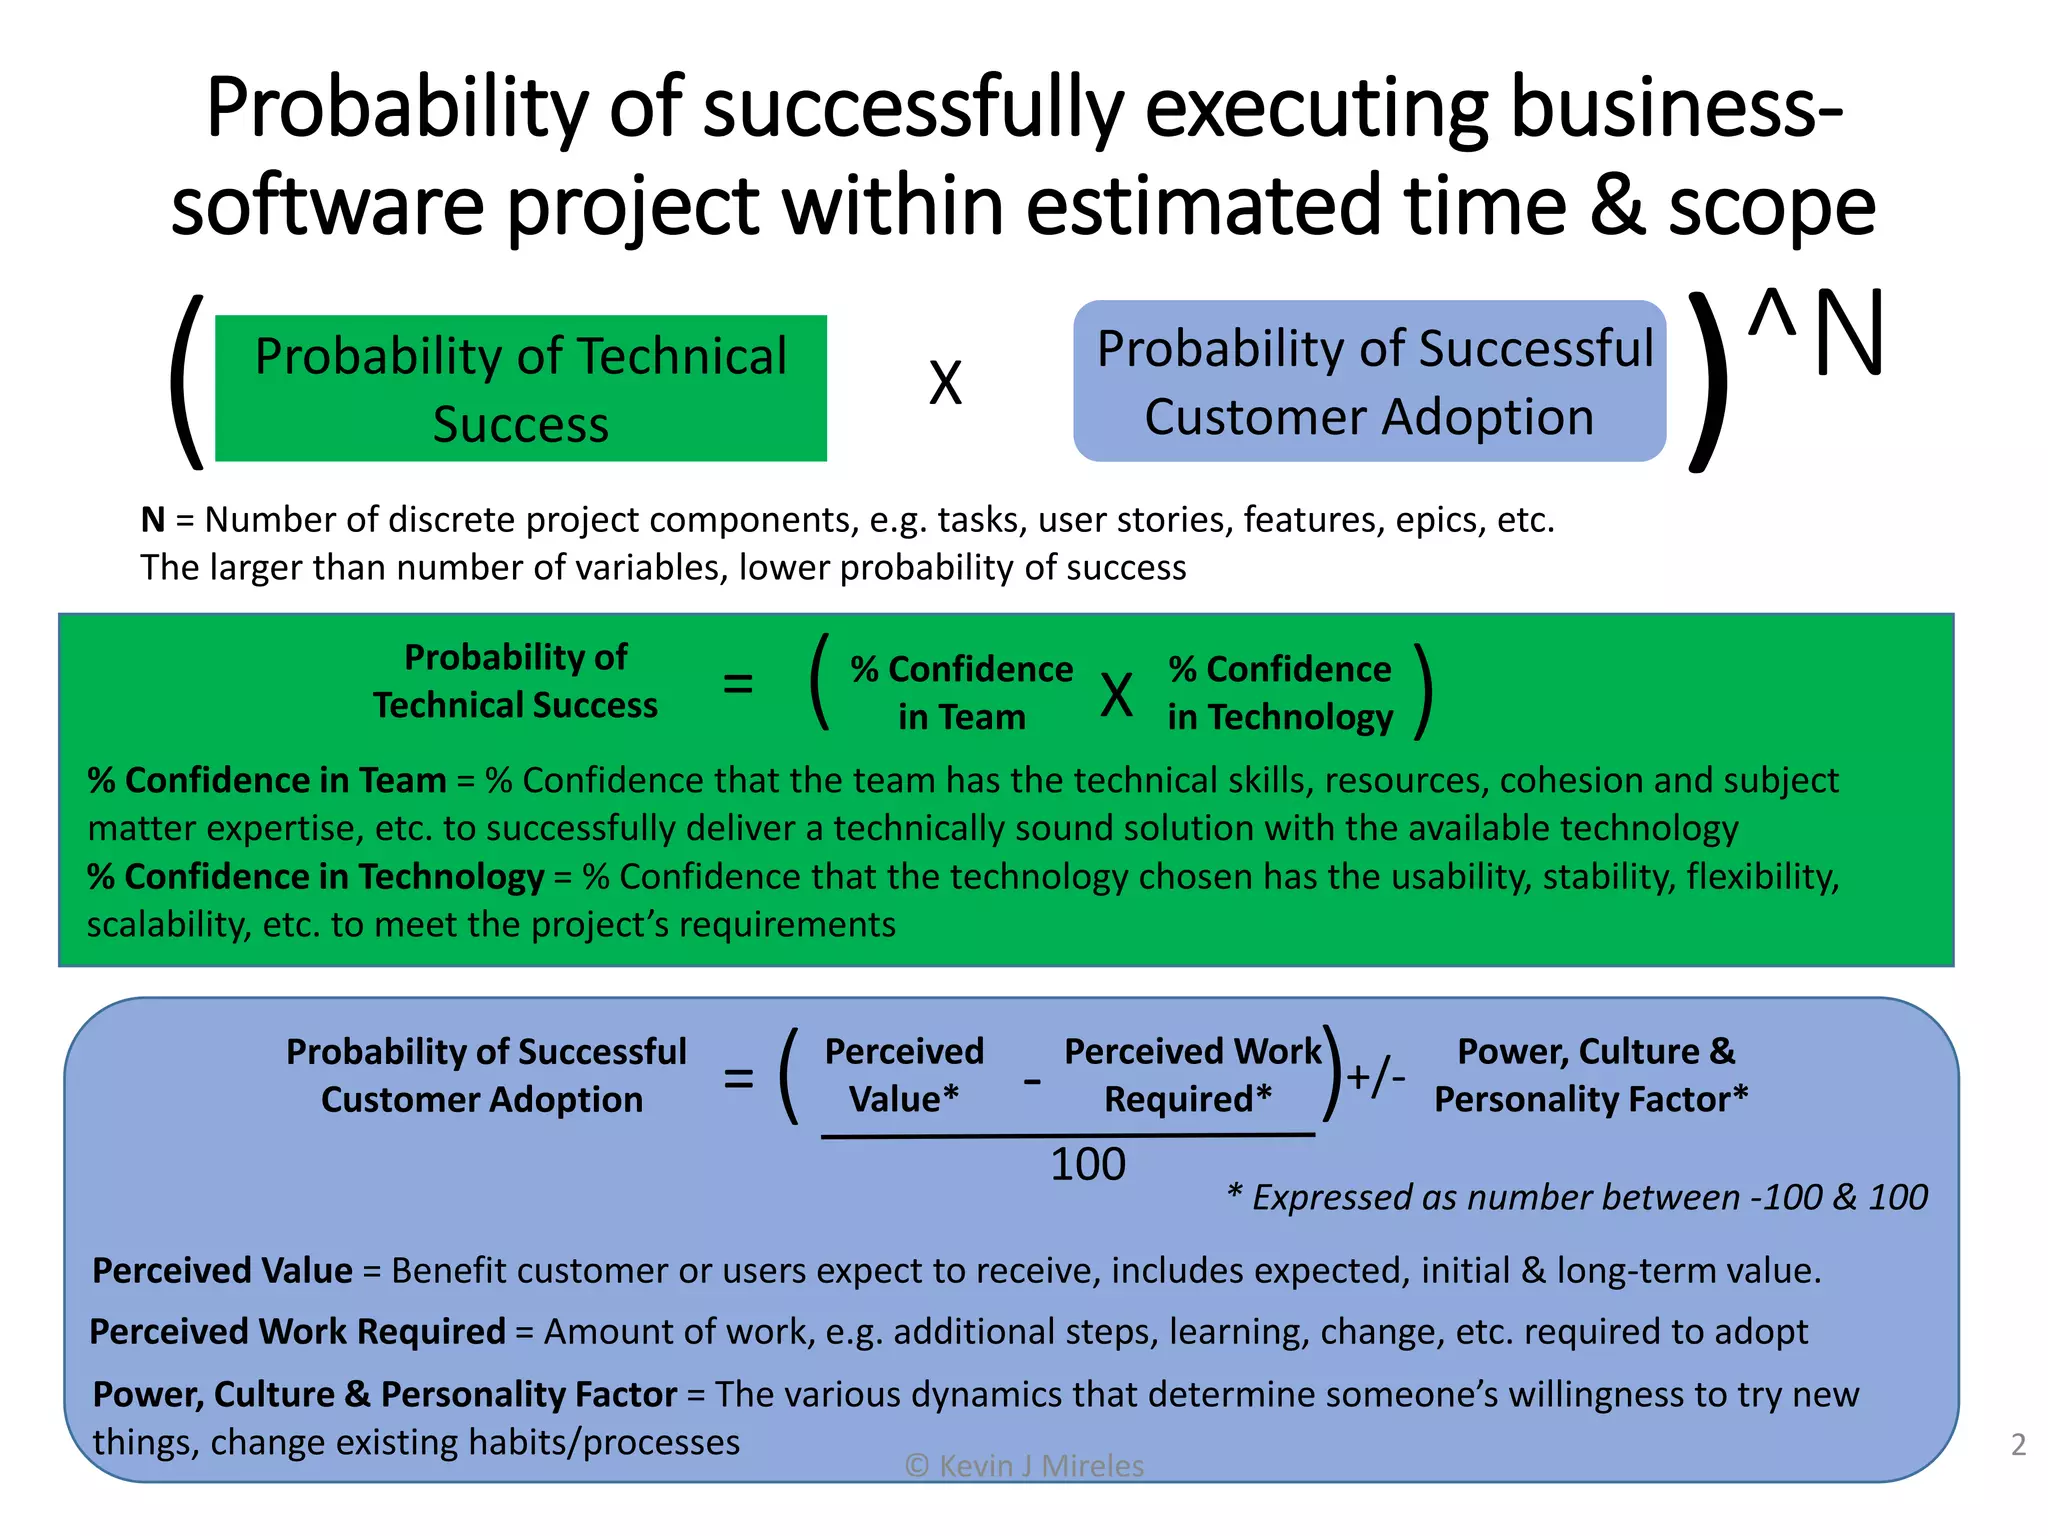
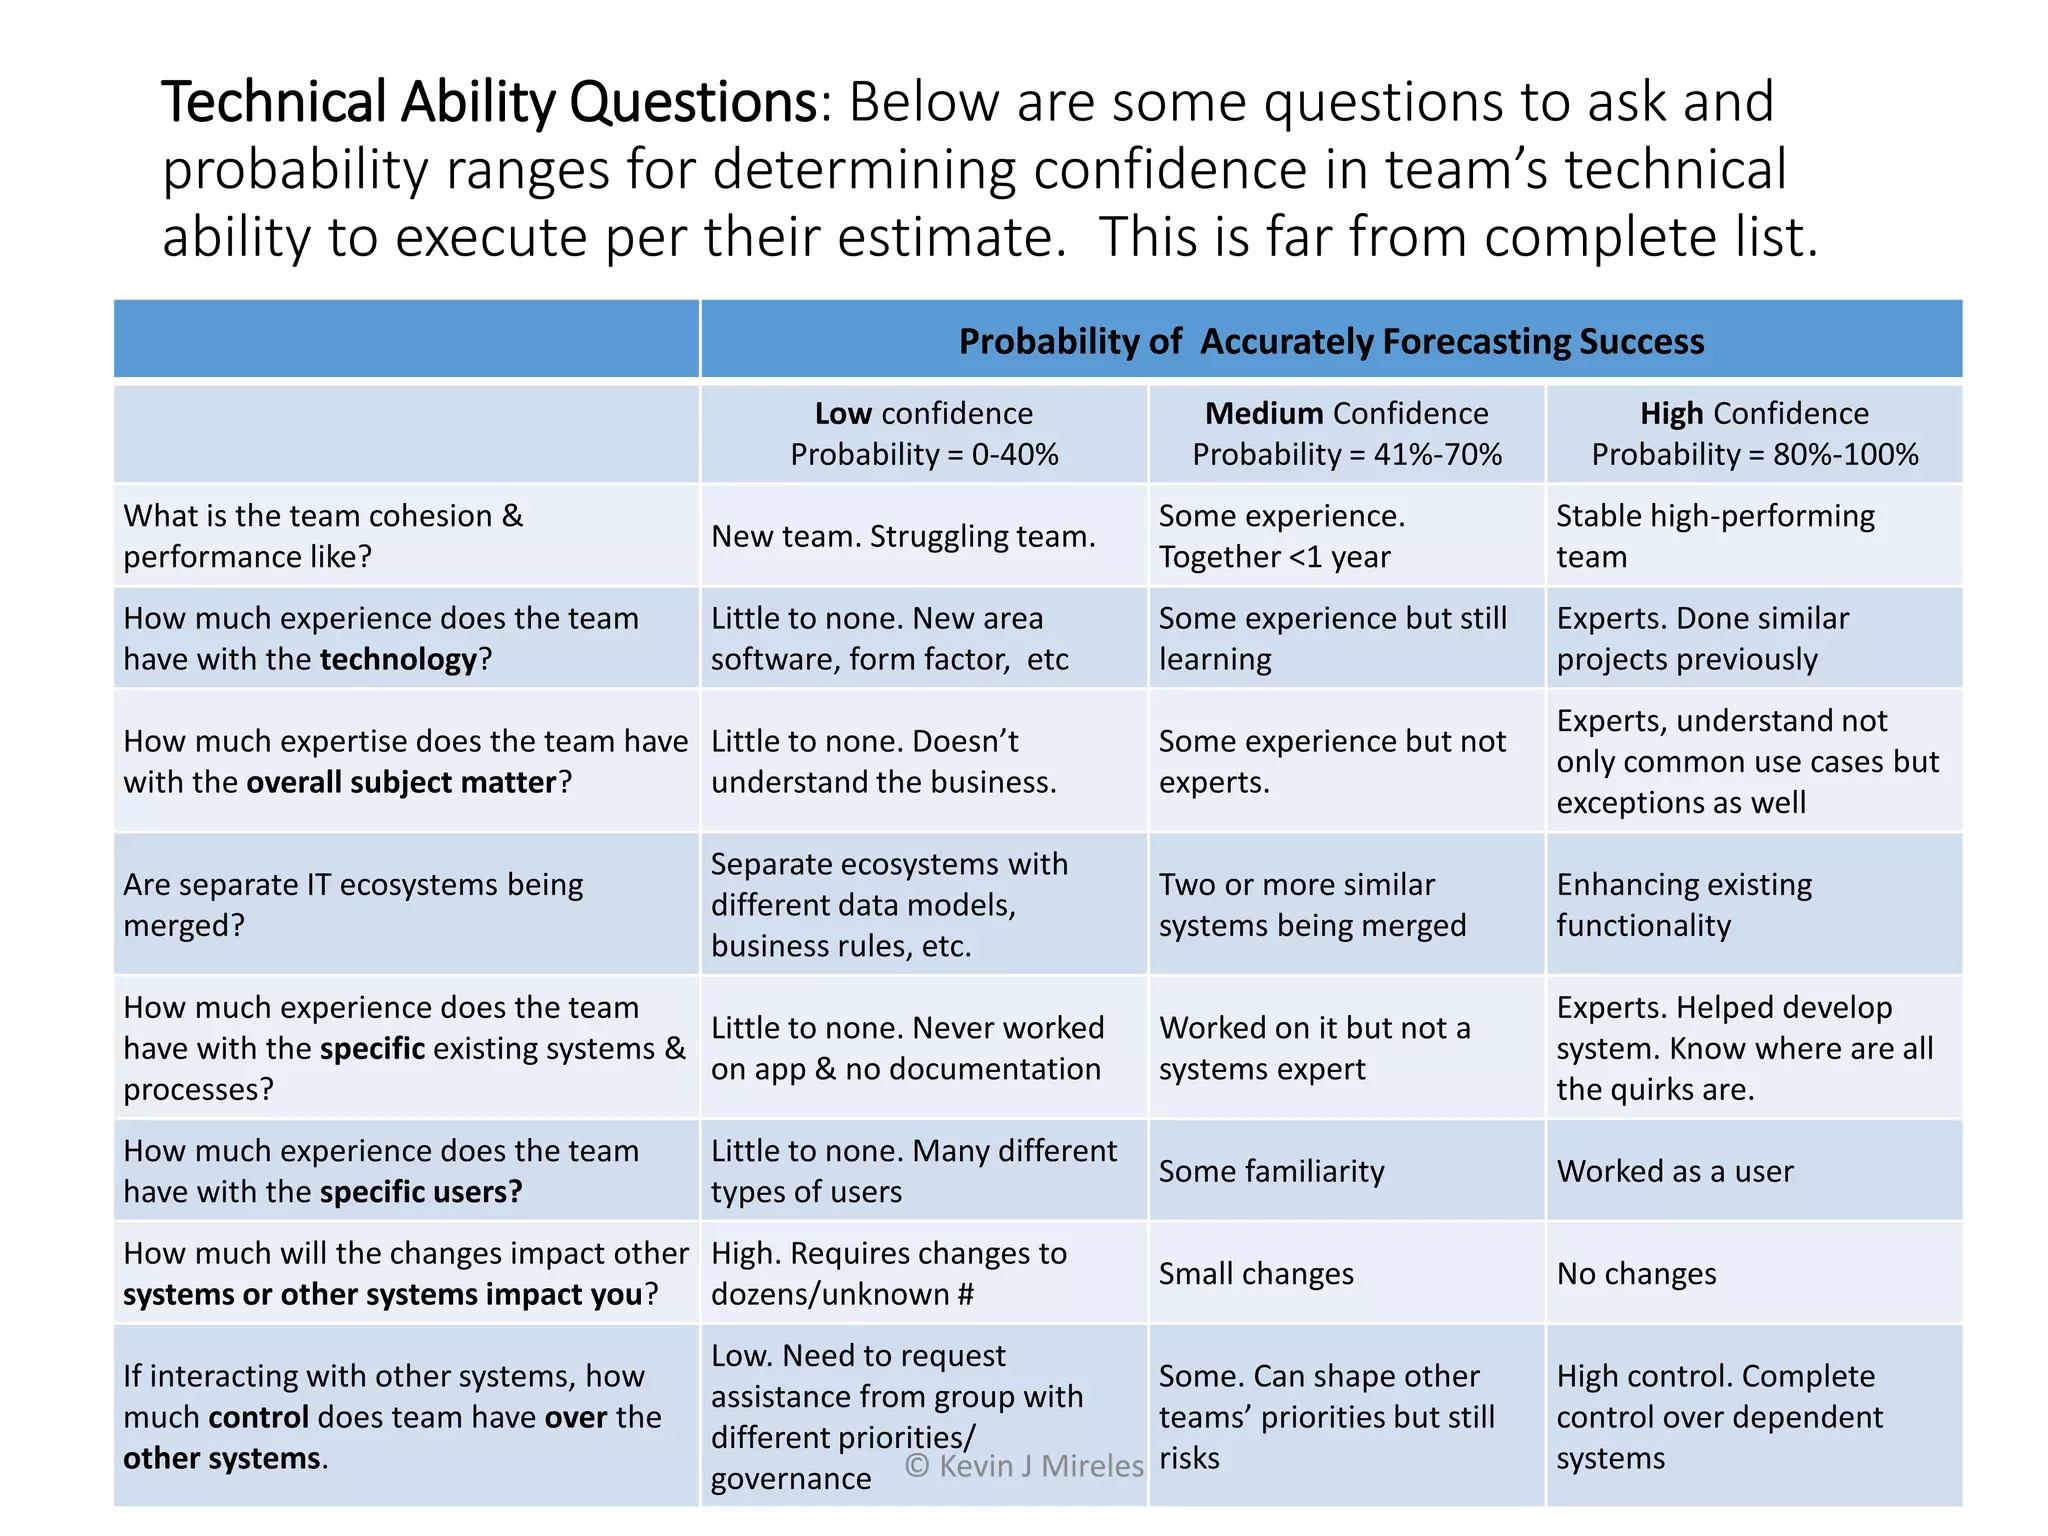
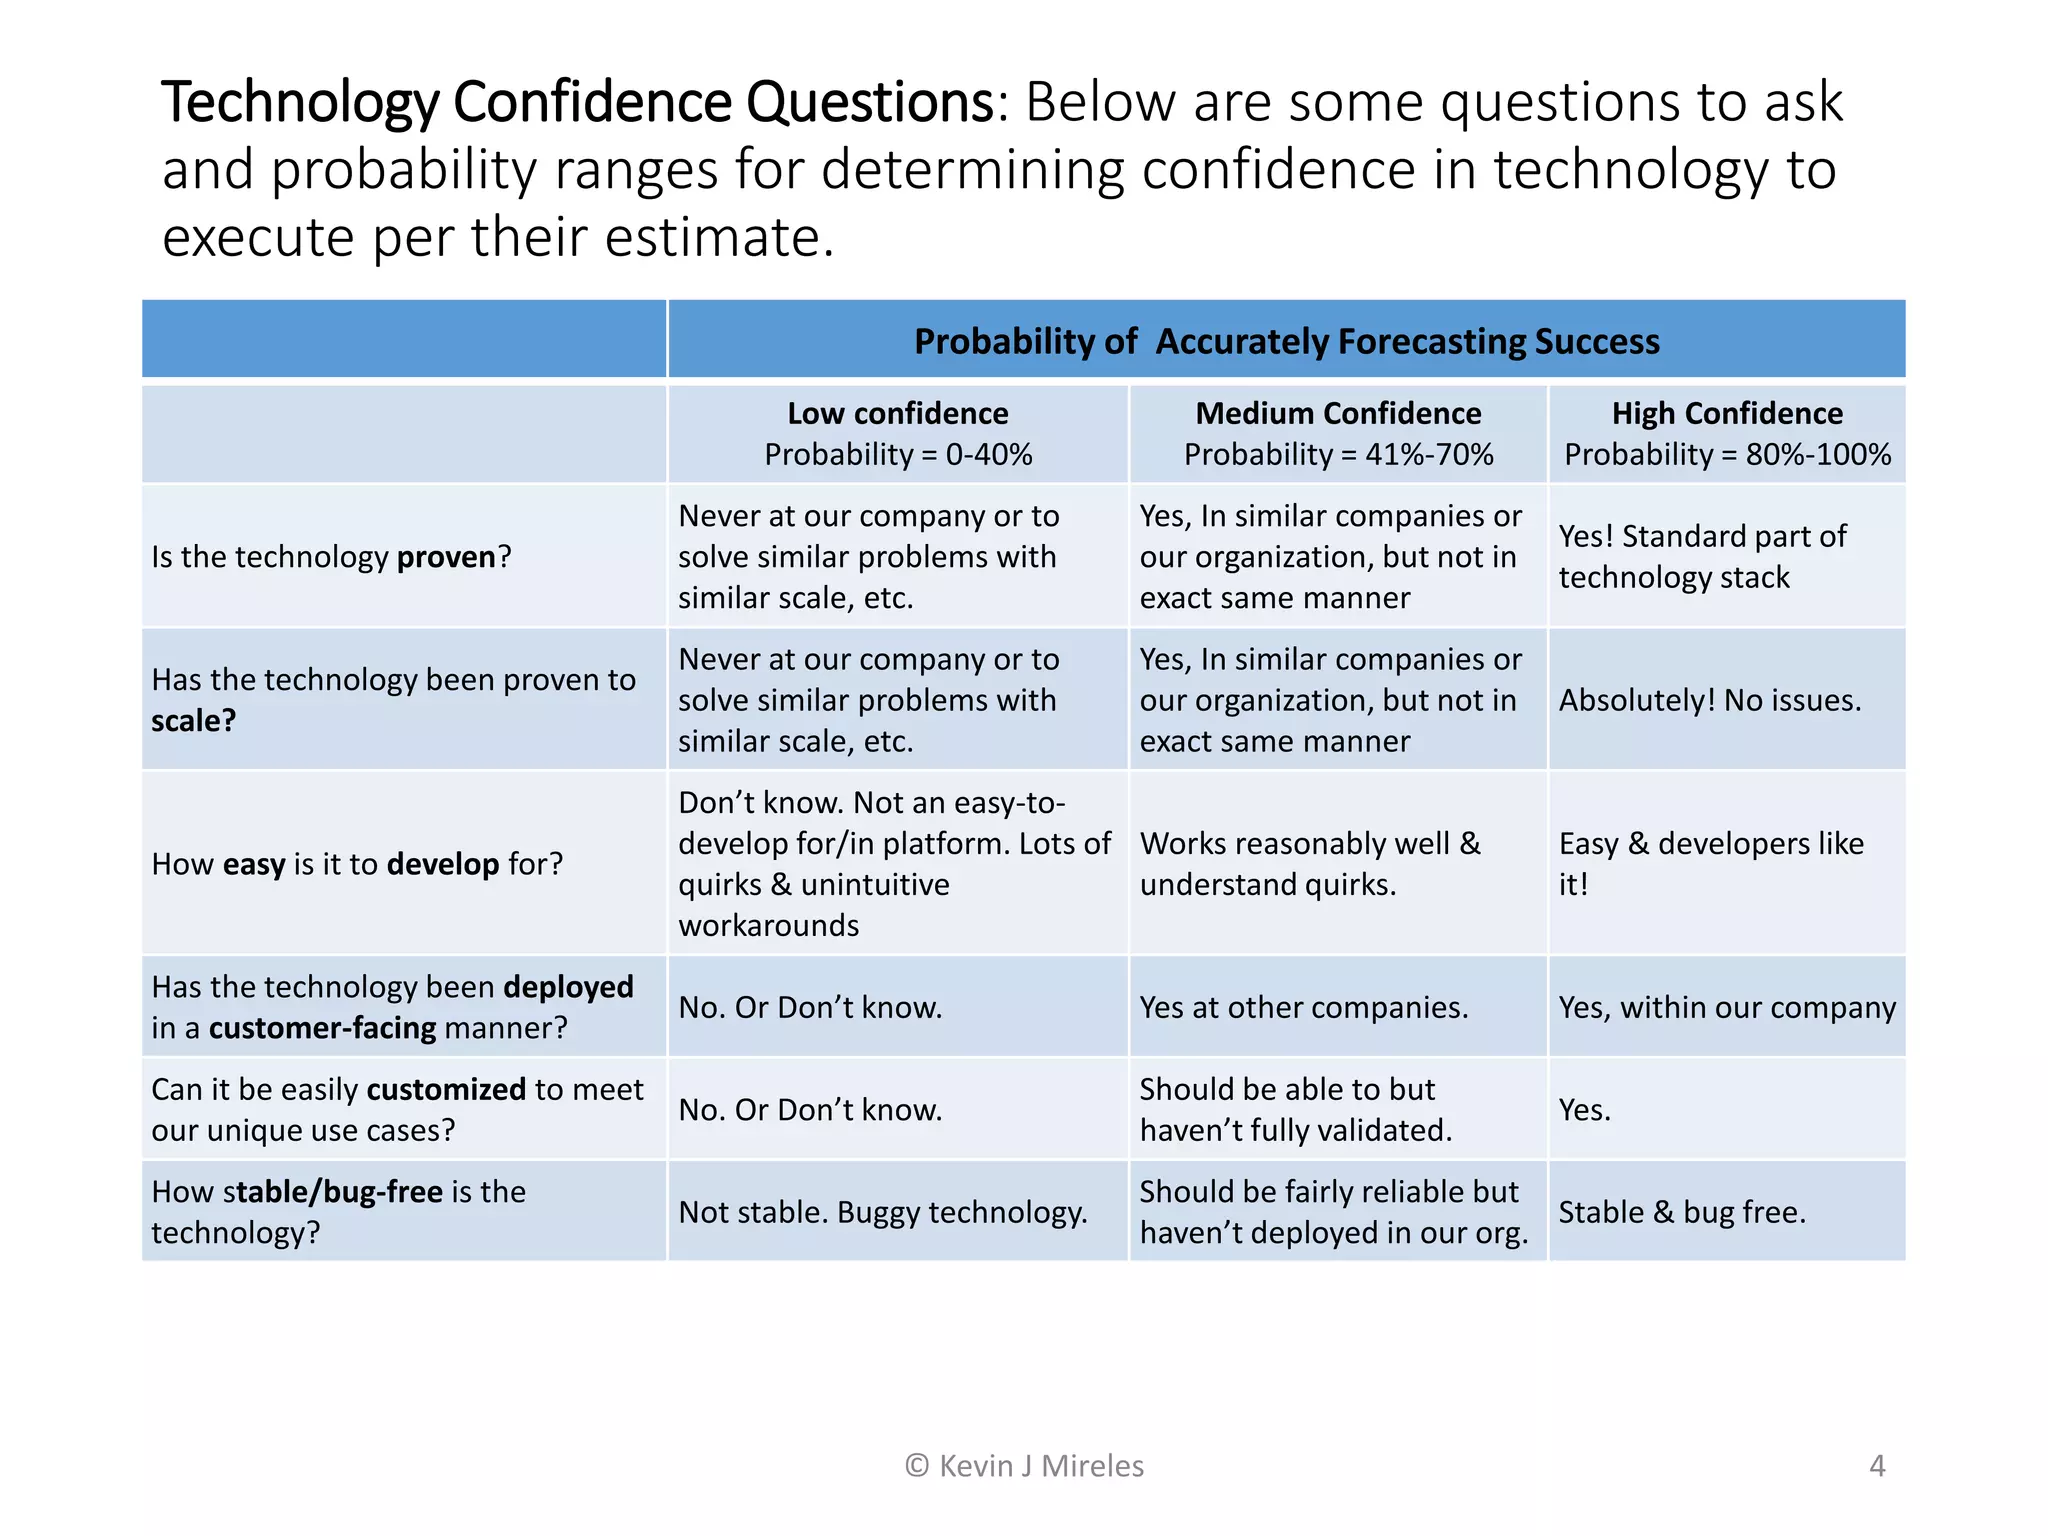
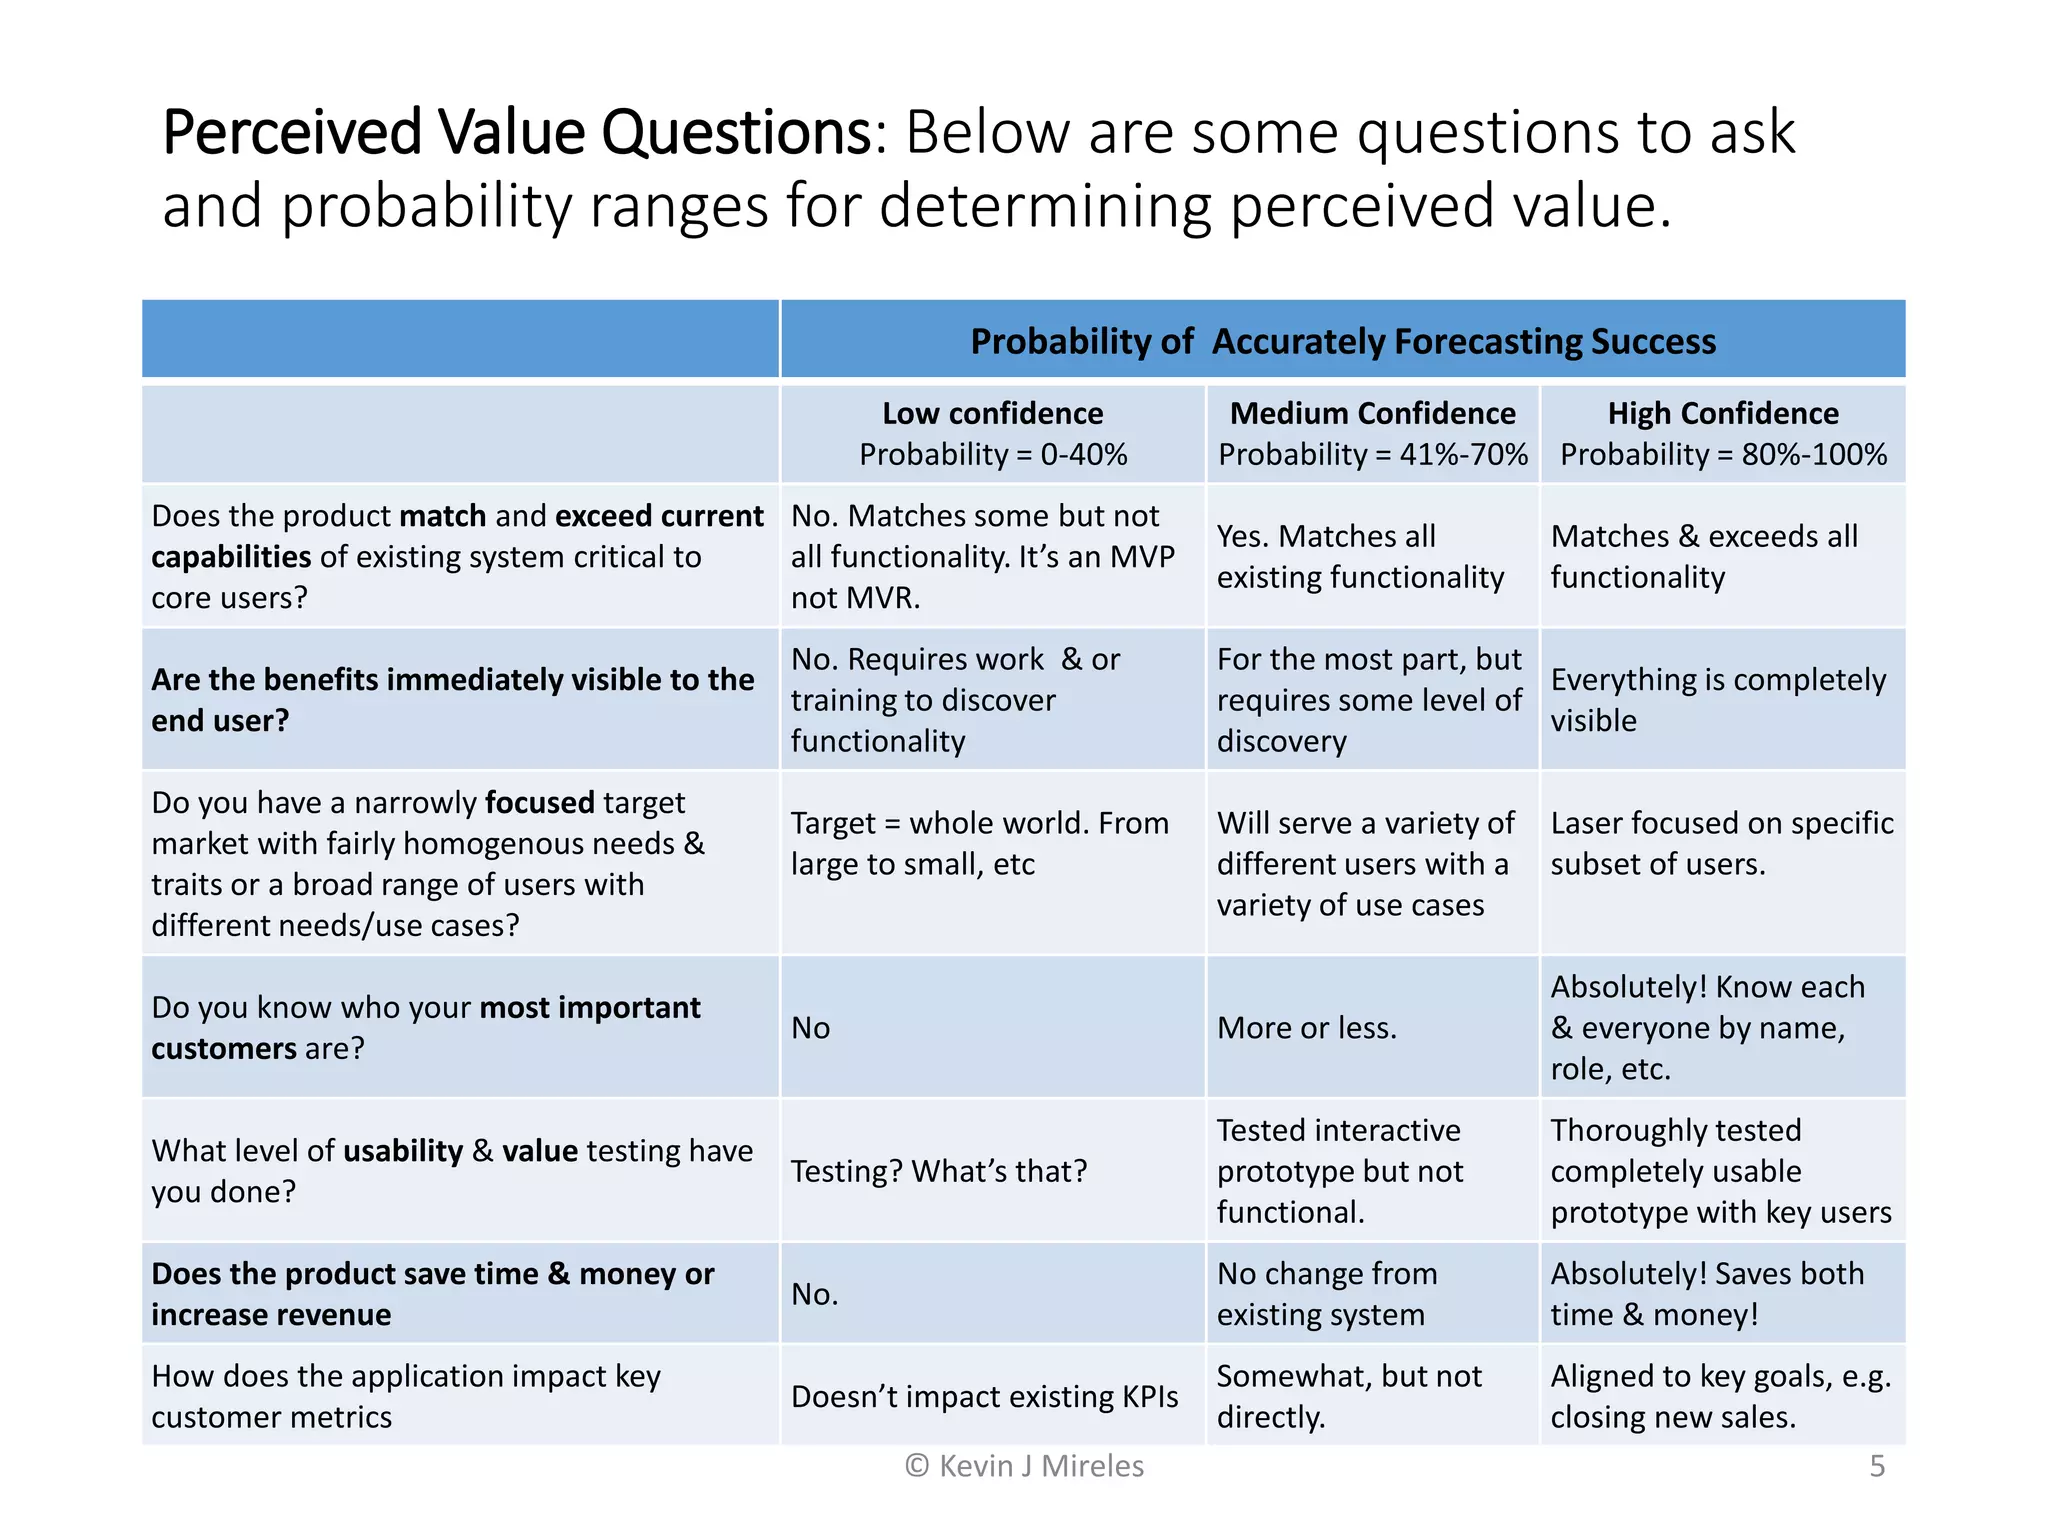
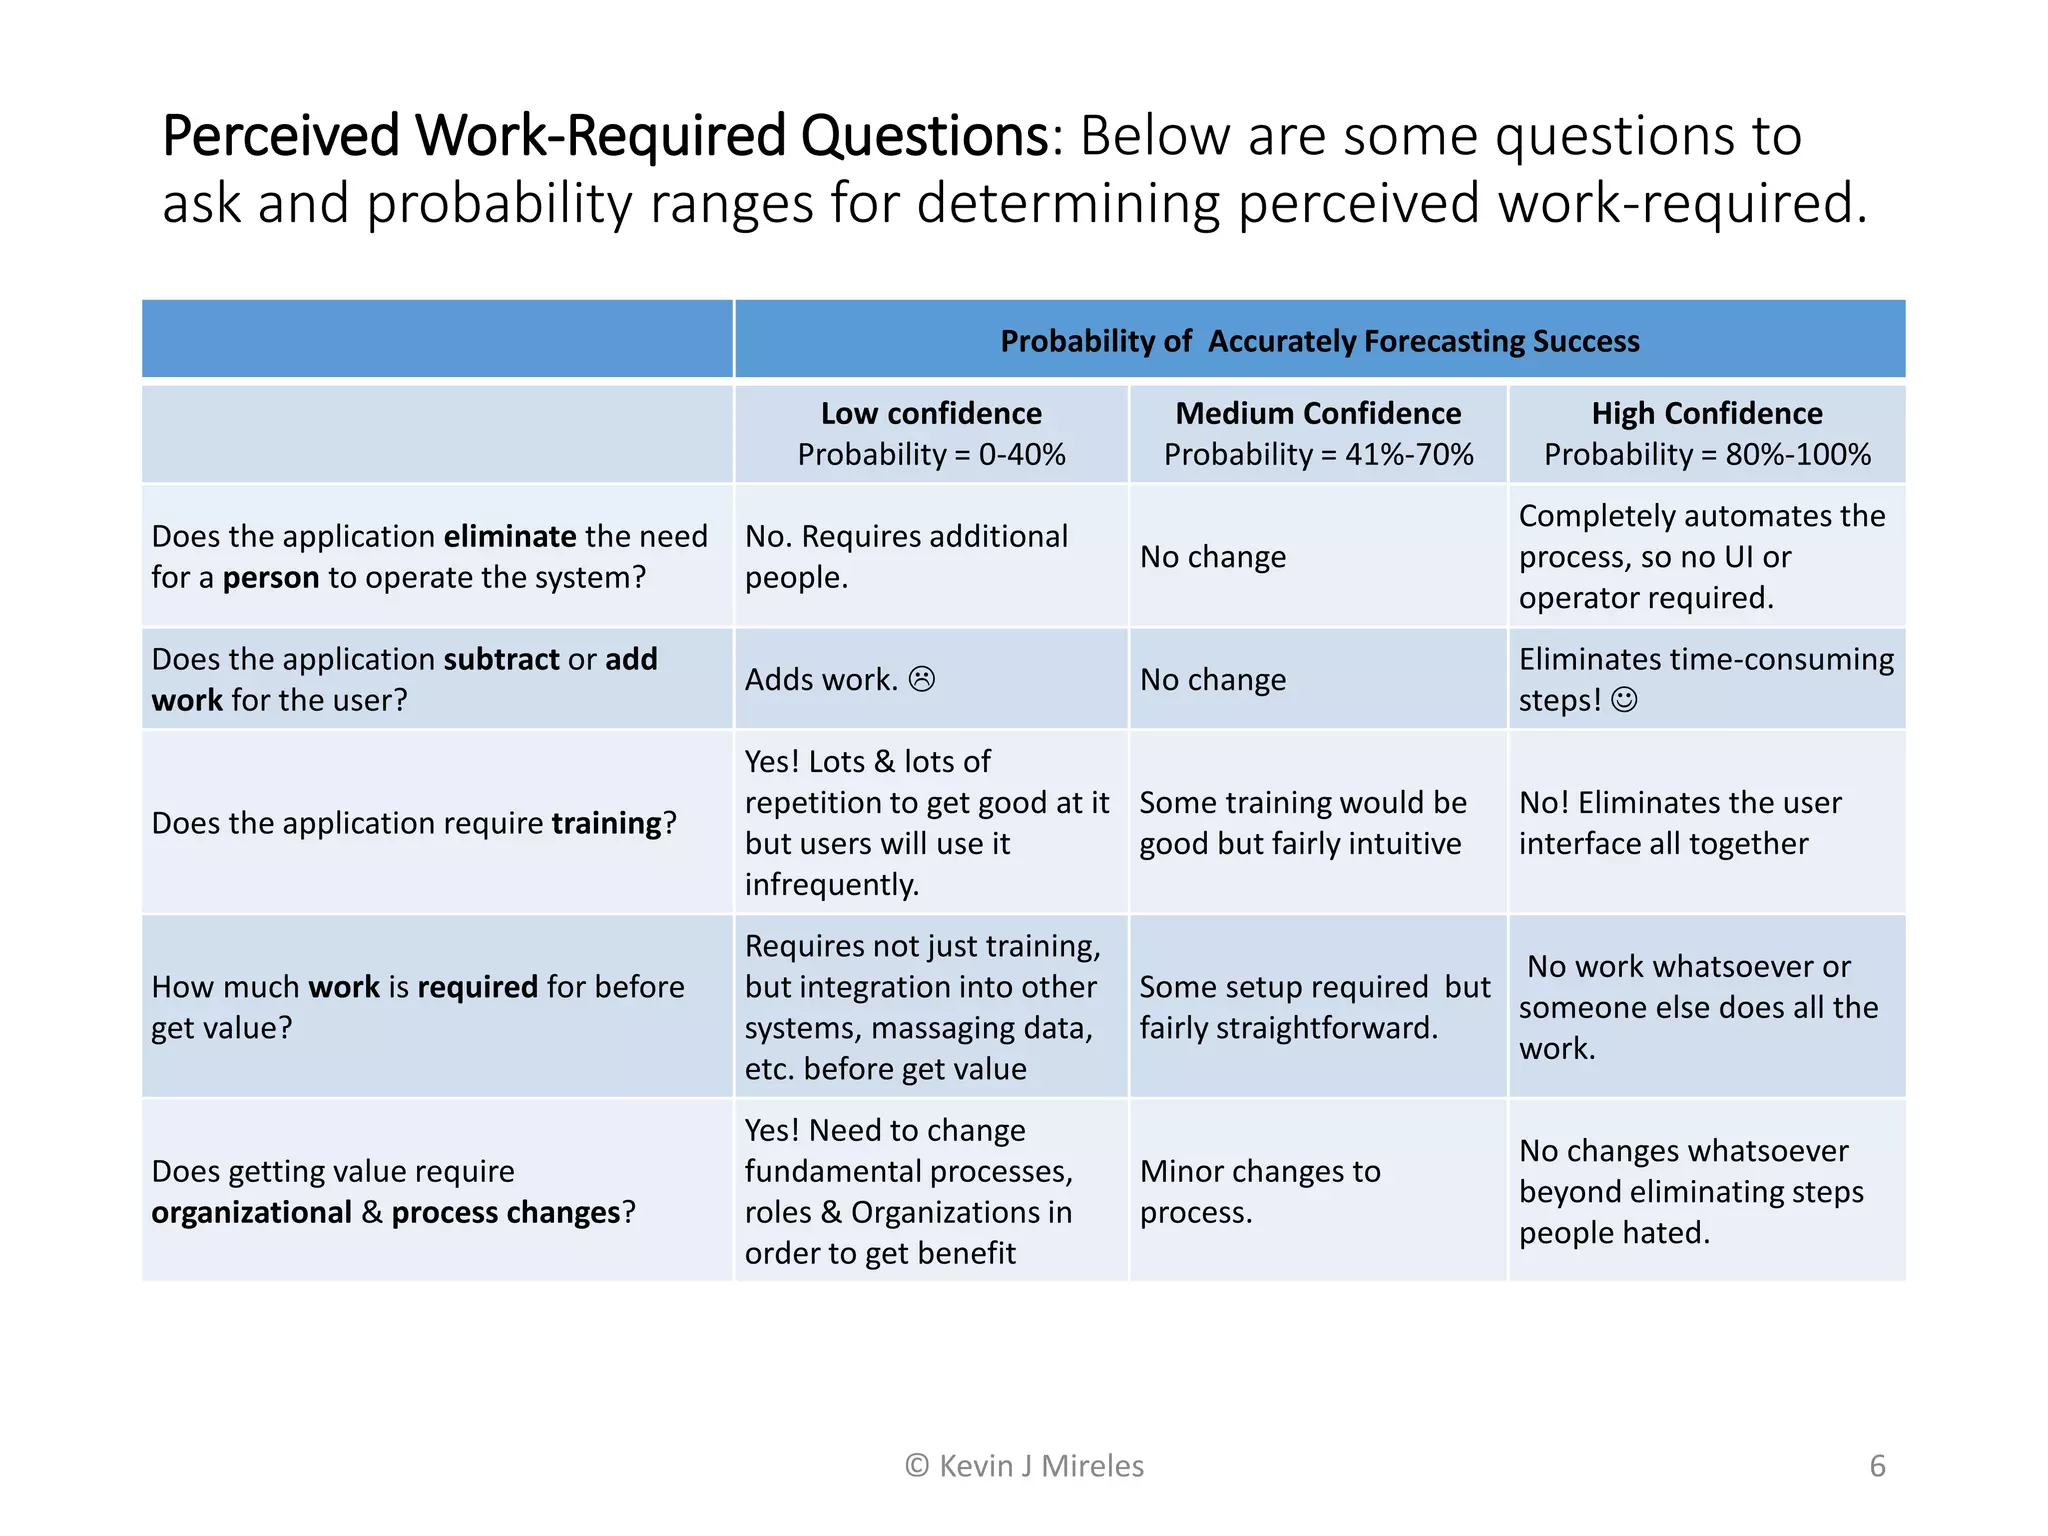
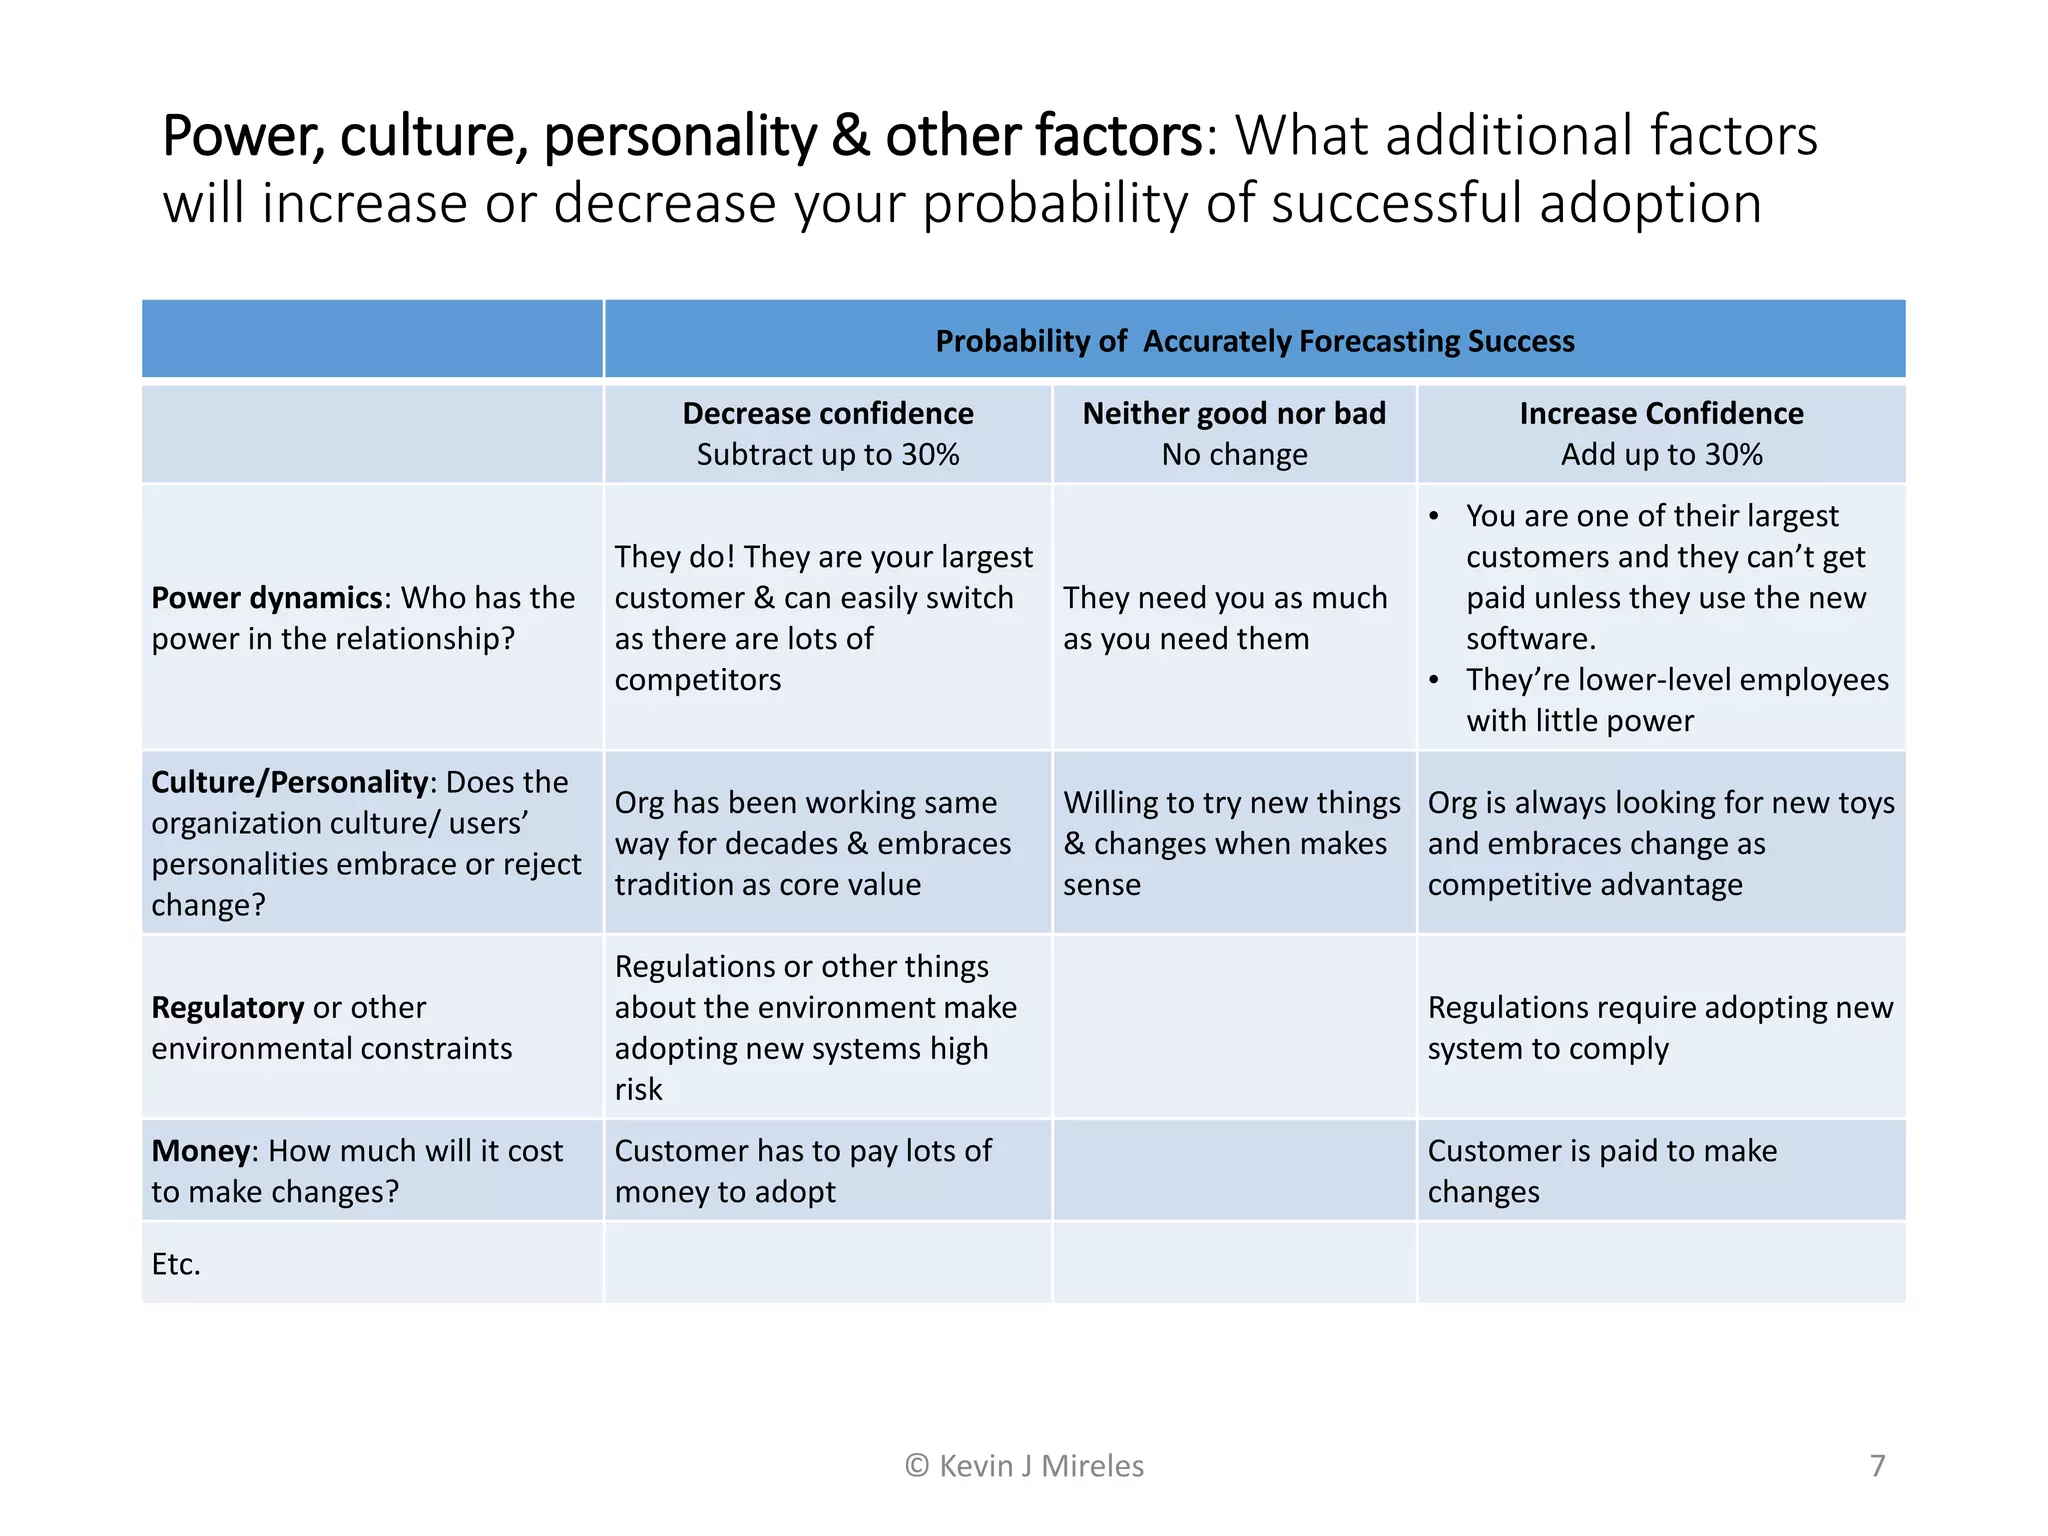
Probability of successfully executing
business software project within
estimated time & scope
©Kevin J Mireles
Probability of successfully executing business-
software project within estimated time & scope
2
Probability of Technical
Success
X
Probability of Successful
Customer Adoption( )^N
Perceived Work Required = Amount of work, e.g. additional steps, learning, change, etc. required to adopt
Power, Culture & Personality Factor = The various dynamics that determine someone’s willingness to try new
things, change existing habits/processes
Perceived
Value* -
Perceived Work
Required*( +/-
100
) Power, Culture &
Personality Factor*
Probability of Successful
Customer Adoption =
Perceived Value = Benefit customer or users expect to receive, includes expected, initial & long-term value.
* Expressed as number between -100 & 100
N = Number of discrete project components, e.g. tasks, user stories, features, epics, etc.
The larger than number of variables, lower probability of success
% Confidence
in Team X
% Confidence
in Technology )(Probability of
Technical Success =
% Confidence in Team = % Confidence that the team has the technical skills, resources, cohesion and subject
matter expertise, etc. to successfully deliver a technically sound solution with the available technology
% Confidence in Technology = % Confidence that the technology chosen has the usability, stability, flexibility,
scalability, etc. to meet the project’s requirements
© Kevin J Mireles
Technical Ability Questions: Below are some questions to ask and
probability ranges for determining confidence in team’s technical
ability to execute per their estimate. This is far from complete list.
3
Probability of Accurately Forecasting Success
Low confidence
Probability = 0-40%
Medium Confidence
Probability = 41%-70%
High Confidence
Probability = 80%-100%
What is the team cohesion &
performance like?
New team. Struggling team.
Some experience.
Together <1 year
Stable high-performing
team
How much experience does the team
have with the technology?
Little to none. New area
software, form factor, etc
Some experience but still
learning
Experts. Done similar
projects previously
How much expertise does the team have
with the overall subject matter?
Little to none. Doesn’t
understand the business.
Some experience but not
experts.
Experts, understand not
only common use cases but
exceptions as well
Are separate IT ecosystems being
merged?
Separate ecosystems with
different data models,
business rules, etc.
Two or more similar
systems being merged
Enhancing existing
functionality
How much experience does the team
have with the specific existing systems &
processes?
Little to none. Never worked
on app & no documentation
Worked on it but not a
systems expert
Experts. Helped develop
system. Know where are all
the quirks are.
How much experience does the team
have with the specific users?
Little to none. Many different
types of users
Some familiarity Worked as a user
How much will the changes impact other
systems or other systems impact you?
High. Requires changes to
dozens/unknown #
Small changes No changes
If interacting with other systems, how
much control does team have over the
other systems.
Low. Need to request
assistance from group with
different priorities/
governance
Some. Can shape other
teams’ priorities but still
risks
High control. Complete
control over dependent
systems© Kevin J Mireles
Technology Confidence Questions: Below are some questions to ask
and probability ranges for determining confidence in technology to
execute per their estimate.
4
Probability of Accurately Forecasting Success
Low confidence
Probability = 0-40%
Medium Confidence
Probability = 41%-70%
High Confidence
Probability = 80%-100%
Is the technology proven?
Never at our company or to
solve similar problems with
similar scale, etc.
Yes, In similar companies or
our organization, but not in
exact same manner
Yes! Standard part of
technology stack
Has the technology been proven to
scale?
Never at our company or to
solve similar problems with
similar scale, etc.
Yes, In similar companies or
our organization, but not in
exact same manner
Absolutely! No issues.
How easy is it to develop for?
Don’t know. Not an easy-to-
develop for/in platform. Lots of
quirks & unintuitive
workarounds
Works reasonably well &
understand quirks.
Easy & developers like
it!
Has the technology been deployed
in a customer-facing manner?
No. Or Don’t know. Yes at other companies. Yes, within our company
Can it be easily customized to meet
our unique use cases?
No. Or Don’t know.
Should be able to but
haven’t fully validated.
Yes.
How stable/bug-free is the
technology?
Not stable. Buggy technology.
Should be fairly reliable but
haven’t deployed in our org.
Stable & bug free.
© Kevin J Mireles
Perceived Value Questions: Below are some questions to ask
and probability ranges for determining perceived value.
5
Probability of Accurately Forecasting Success
Low confidence
Probability = 0-40%
Medium Confidence
Probability = 41%-70%
High Confidence
Probability = 80%-100%
Does the product match and exceed current
capabilities of existing system critical to
core users?
No. Matches some but not
all functionality. It’s an MVP
not MVR.
Yes. Matches all
existing functionality
Matches & exceeds all
functionality
Are the benefits immediately visible to the
end user?
No. Requires work & or
training to discover
functionality
For the most part, but
requires some level of
discovery
Everything is completely
visible
Do you have a narrowly focused target
market with fairly homogenous needs &
traits or a broad range of users with
different needs/use cases?
Target = whole world. From
large to small, etc
Will serve a variety of
different users with a
variety of use cases
Laser focused on specific
subset of users.
Do you know who your most important
customers are?
No More or less.
Absolutely! Know each
& everyone by name,
role, etc.
What level of usability & value testing have
you done?
Testing? What’s that?
Tested interactive
prototype but not
functional.
Thoroughly tested
completely usable
prototype with key users
Does the product save time & money or
increase revenue
No.
No change from
existing system
Absolutely! Saves both
time & money!
How does the application impact key
customer metrics
Doesn’t impact existing KPIs
Somewhat, but not
directly.
Aligned to key goals, e.g.
closing new sales.
© Kevin J Mireles
Perceived Work-Required Questions: Below are some questions to
ask and probability ranges for determining perceived work-required.
6
Probability of Accurately Forecasting Success
Low confidence
Probability = 0-40%
Medium Confidence
Probability = 41%-70%
High Confidence
Probability = 80%-100%
Does the application eliminate the need
for a person to operate the system?
No. Requires additional
people.
No change
Completely automates the
process, so no UI or
operator required.
Does the application subtract or add
work for the user?
Adds work.  No change
Eliminates time-consuming
steps! 
Does the application require training?
Yes! Lots & lots of
repetition to get good at it
but users will use it
infrequently.
Some training would be
good but fairly intuitive
No! Eliminates the user
interface all together
How much work is required for before
get value?
Requires not just training,
but integration into other
systems, massaging data,
etc. before get value
Some setup required but
fairly straightforward.
No work whatsoever or
someone else does all the
work.
Does getting value require
organizational & process changes?
Yes! Need to change
fundamental processes,
roles & Organizations in
order to get benefit
Minor changes to
process.
No changes whatsoever
beyond eliminating steps
people hated.
© Kevin J Mireles
Power, culture, personality & other factors: What additional factors
will increase or decrease your probability of successful adoption
7
Probability of Accurately Forecasting Success
Decrease confidence
Subtract up to 30%
Neither good nor bad
No change
Increase Confidence
Add up to 30%
Power dynamics: Who has the
power in the relationship?
They do! They are your largest
customer & can easily switch
as there are lots of
competitors
They need you as much
as you need them
• You are one of their largest
customers and they can’t get
paid unless they use the new
software.
• They’re lower-level employees
with little power
Culture/Personality: Does the
organization culture/ users’
personalities embrace or reject
change?
Org has been working same
way for decades & embraces
tradition as core value
Willing to try new things
& changes when makes
sense
Org is always looking for new toys
and embraces change as
competitive advantage
Regulatory or other
environmental constraints
Regulations or other things
about the environment make
adopting new systems high
risk
Regulations require adopting new
system to comply
Money: How much will it cost
to make changes?
Customer has to pay lots of
money to adopt
Customer is paid to make
changes
Etc.
© Kevin J Mireles

Kevin's Software Success Equation

  • 1.
    Probability of successfullyexecuting business software project within estimated time & scope ©Kevin J Mireles
  • 2.
    Probability of successfullyexecuting business- software project within estimated time & scope 2 Probability of Technical Success X Probability of Successful Customer Adoption( )^N Perceived Work Required = Amount of work, e.g. additional steps, learning, change, etc. required to adopt Power, Culture & Personality Factor = The various dynamics that determine someone’s willingness to try new things, change existing habits/processes Perceived Value* - Perceived Work Required*( +/- 100 ) Power, Culture & Personality Factor* Probability of Successful Customer Adoption = Perceived Value = Benefit customer or users expect to receive, includes expected, initial & long-term value. * Expressed as number between -100 & 100 N = Number of discrete project components, e.g. tasks, user stories, features, epics, etc. The larger than number of variables, lower probability of success % Confidence in Team X % Confidence in Technology )(Probability of Technical Success = % Confidence in Team = % Confidence that the team has the technical skills, resources, cohesion and subject matter expertise, etc. to successfully deliver a technically sound solution with the available technology % Confidence in Technology = % Confidence that the technology chosen has the usability, stability, flexibility, scalability, etc. to meet the project’s requirements © Kevin J Mireles
  • 3.
    Technical Ability Questions:Below are some questions to ask and probability ranges for determining confidence in team’s technical ability to execute per their estimate. This is far from complete list. 3 Probability of Accurately Forecasting Success Low confidence Probability = 0-40% Medium Confidence Probability = 41%-70% High Confidence Probability = 80%-100% What is the team cohesion & performance like? New team. Struggling team. Some experience. Together <1 year Stable high-performing team How much experience does the team have with the technology? Little to none. New area software, form factor, etc Some experience but still learning Experts. Done similar projects previously How much expertise does the team have with the overall subject matter? Little to none. Doesn’t understand the business. Some experience but not experts. Experts, understand not only common use cases but exceptions as well Are separate IT ecosystems being merged? Separate ecosystems with different data models, business rules, etc. Two or more similar systems being merged Enhancing existing functionality How much experience does the team have with the specific existing systems & processes? Little to none. Never worked on app & no documentation Worked on it but not a systems expert Experts. Helped develop system. Know where are all the quirks are. How much experience does the team have with the specific users? Little to none. Many different types of users Some familiarity Worked as a user How much will the changes impact other systems or other systems impact you? High. Requires changes to dozens/unknown # Small changes No changes If interacting with other systems, how much control does team have over the other systems. Low. Need to request assistance from group with different priorities/ governance Some. Can shape other teams’ priorities but still risks High control. Complete control over dependent systems© Kevin J Mireles
  • 4.
    Technology Confidence Questions:Below are some questions to ask and probability ranges for determining confidence in technology to execute per their estimate. 4 Probability of Accurately Forecasting Success Low confidence Probability = 0-40% Medium Confidence Probability = 41%-70% High Confidence Probability = 80%-100% Is the technology proven? Never at our company or to solve similar problems with similar scale, etc. Yes, In similar companies or our organization, but not in exact same manner Yes! Standard part of technology stack Has the technology been proven to scale? Never at our company or to solve similar problems with similar scale, etc. Yes, In similar companies or our organization, but not in exact same manner Absolutely! No issues. How easy is it to develop for? Don’t know. Not an easy-to- develop for/in platform. Lots of quirks & unintuitive workarounds Works reasonably well & understand quirks. Easy & developers like it! Has the technology been deployed in a customer-facing manner? No. Or Don’t know. Yes at other companies. Yes, within our company Can it be easily customized to meet our unique use cases? No. Or Don’t know. Should be able to but haven’t fully validated. Yes. How stable/bug-free is the technology? Not stable. Buggy technology. Should be fairly reliable but haven’t deployed in our org. Stable & bug free. © Kevin J Mireles
  • 5.
    Perceived Value Questions:Below are some questions to ask and probability ranges for determining perceived value. 5 Probability of Accurately Forecasting Success Low confidence Probability = 0-40% Medium Confidence Probability = 41%-70% High Confidence Probability = 80%-100% Does the product match and exceed current capabilities of existing system critical to core users? No. Matches some but not all functionality. It’s an MVP not MVR. Yes. Matches all existing functionality Matches & exceeds all functionality Are the benefits immediately visible to the end user? No. Requires work & or training to discover functionality For the most part, but requires some level of discovery Everything is completely visible Do you have a narrowly focused target market with fairly homogenous needs & traits or a broad range of users with different needs/use cases? Target = whole world. From large to small, etc Will serve a variety of different users with a variety of use cases Laser focused on specific subset of users. Do you know who your most important customers are? No More or less. Absolutely! Know each & everyone by name, role, etc. What level of usability & value testing have you done? Testing? What’s that? Tested interactive prototype but not functional. Thoroughly tested completely usable prototype with key users Does the product save time & money or increase revenue No. No change from existing system Absolutely! Saves both time & money! How does the application impact key customer metrics Doesn’t impact existing KPIs Somewhat, but not directly. Aligned to key goals, e.g. closing new sales. © Kevin J Mireles
  • 6.
    Perceived Work-Required Questions:Below are some questions to ask and probability ranges for determining perceived work-required. 6 Probability of Accurately Forecasting Success Low confidence Probability = 0-40% Medium Confidence Probability = 41%-70% High Confidence Probability = 80%-100% Does the application eliminate the need for a person to operate the system? No. Requires additional people. No change Completely automates the process, so no UI or operator required. Does the application subtract or add work for the user? Adds work.  No change Eliminates time-consuming steps!  Does the application require training? Yes! Lots & lots of repetition to get good at it but users will use it infrequently. Some training would be good but fairly intuitive No! Eliminates the user interface all together How much work is required for before get value? Requires not just training, but integration into other systems, massaging data, etc. before get value Some setup required but fairly straightforward. No work whatsoever or someone else does all the work. Does getting value require organizational & process changes? Yes! Need to change fundamental processes, roles & Organizations in order to get benefit Minor changes to process. No changes whatsoever beyond eliminating steps people hated. © Kevin J Mireles
  • 7.
    Power, culture, personality& other factors: What additional factors will increase or decrease your probability of successful adoption 7 Probability of Accurately Forecasting Success Decrease confidence Subtract up to 30% Neither good nor bad No change Increase Confidence Add up to 30% Power dynamics: Who has the power in the relationship? They do! They are your largest customer & can easily switch as there are lots of competitors They need you as much as you need them • You are one of their largest customers and they can’t get paid unless they use the new software. • They’re lower-level employees with little power Culture/Personality: Does the organization culture/ users’ personalities embrace or reject change? Org has been working same way for decades & embraces tradition as core value Willing to try new things & changes when makes sense Org is always looking for new toys and embraces change as competitive advantage Regulatory or other environmental constraints Regulations or other things about the environment make adopting new systems high risk Regulations require adopting new system to comply Money: How much will it cost to make changes? Customer has to pay lots of money to adopt Customer is paid to make changes Etc. © Kevin J Mireles

Editor's Notes

  • #4 The probability of successfully predicting the outcome of a specific task or an entire project is driven by the complexity, i.e. number of variables involved, and the probability of successfully achieving the goals for the task or project
  • #5 The probability of successfully predicting the outcome of a specific task or an entire project is driven by the complexity, i.e. number of variables involved, and the probability of successfully achieving the goals for the task or project
  • #6 The probability of successfully predicting the outcome of a specific task or an entire project is driven by the complexity, i.e. number of variables involved, and the probability of successfully achieving the goals for the task or project
  • #7 The probability of successfully predicting the outcome of a specific task or an entire project is driven by the complexity, i.e. number of variables involved, and the probability of successfully achieving the goals for the task or project
  • #8 The probability of successfully predicting the outcome of a specific task or an entire project is driven by the complexity, i.e. number of variables involved, and the probability of successfully achieving the goals for the task or project