Downloaded 10 times


![The exposures,
Binary response and data set
The exposures: Patient-specific and implant-specific
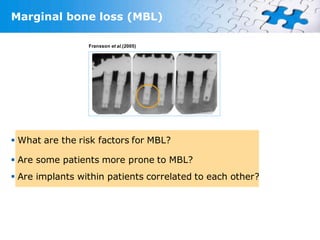
Clustered response: MBL measurement at implant level
Binary response: Acceptable vs. advanced bone loss
Cut point at MBL=0.2 mm/year
The data set: Multilevel data set
195 Patients as the primary sample units (clusters)
721 Implants as the Elementary units
No. of implants per patient [1,16], mode=3](https://image.slidesharecdn.com/istanbul-final-1272487583-phpapp01/85/Statistical-Analysis-of-Clustered-Binary-Response-in-Oral-Health-Research-20-320.jpg)


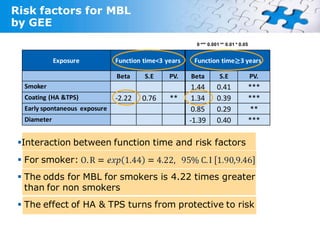


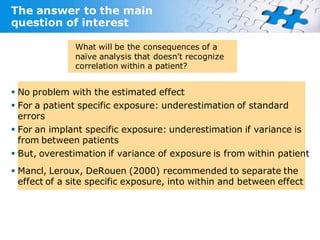
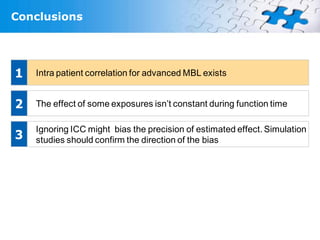


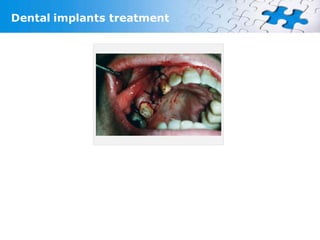
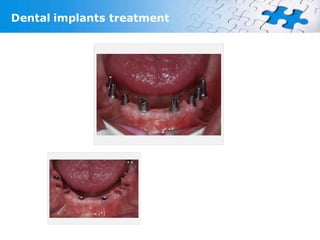
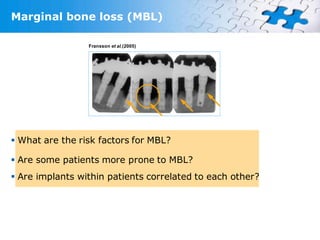
This study analyzes risk factors for marginal bone loss (MBL) in dental implants, focusing on the intra-patient correlation of responses. Utilizing a historical prospective cohort design, the study highlights the impact of various patient-specific and implant-specific exposures on MBL over time. The findings suggest that naive analysis may underestimate standard errors and bias inference regarding the estimated effects, emphasizing the importance of recognizing intra-patient correlations.


