Download to read offline
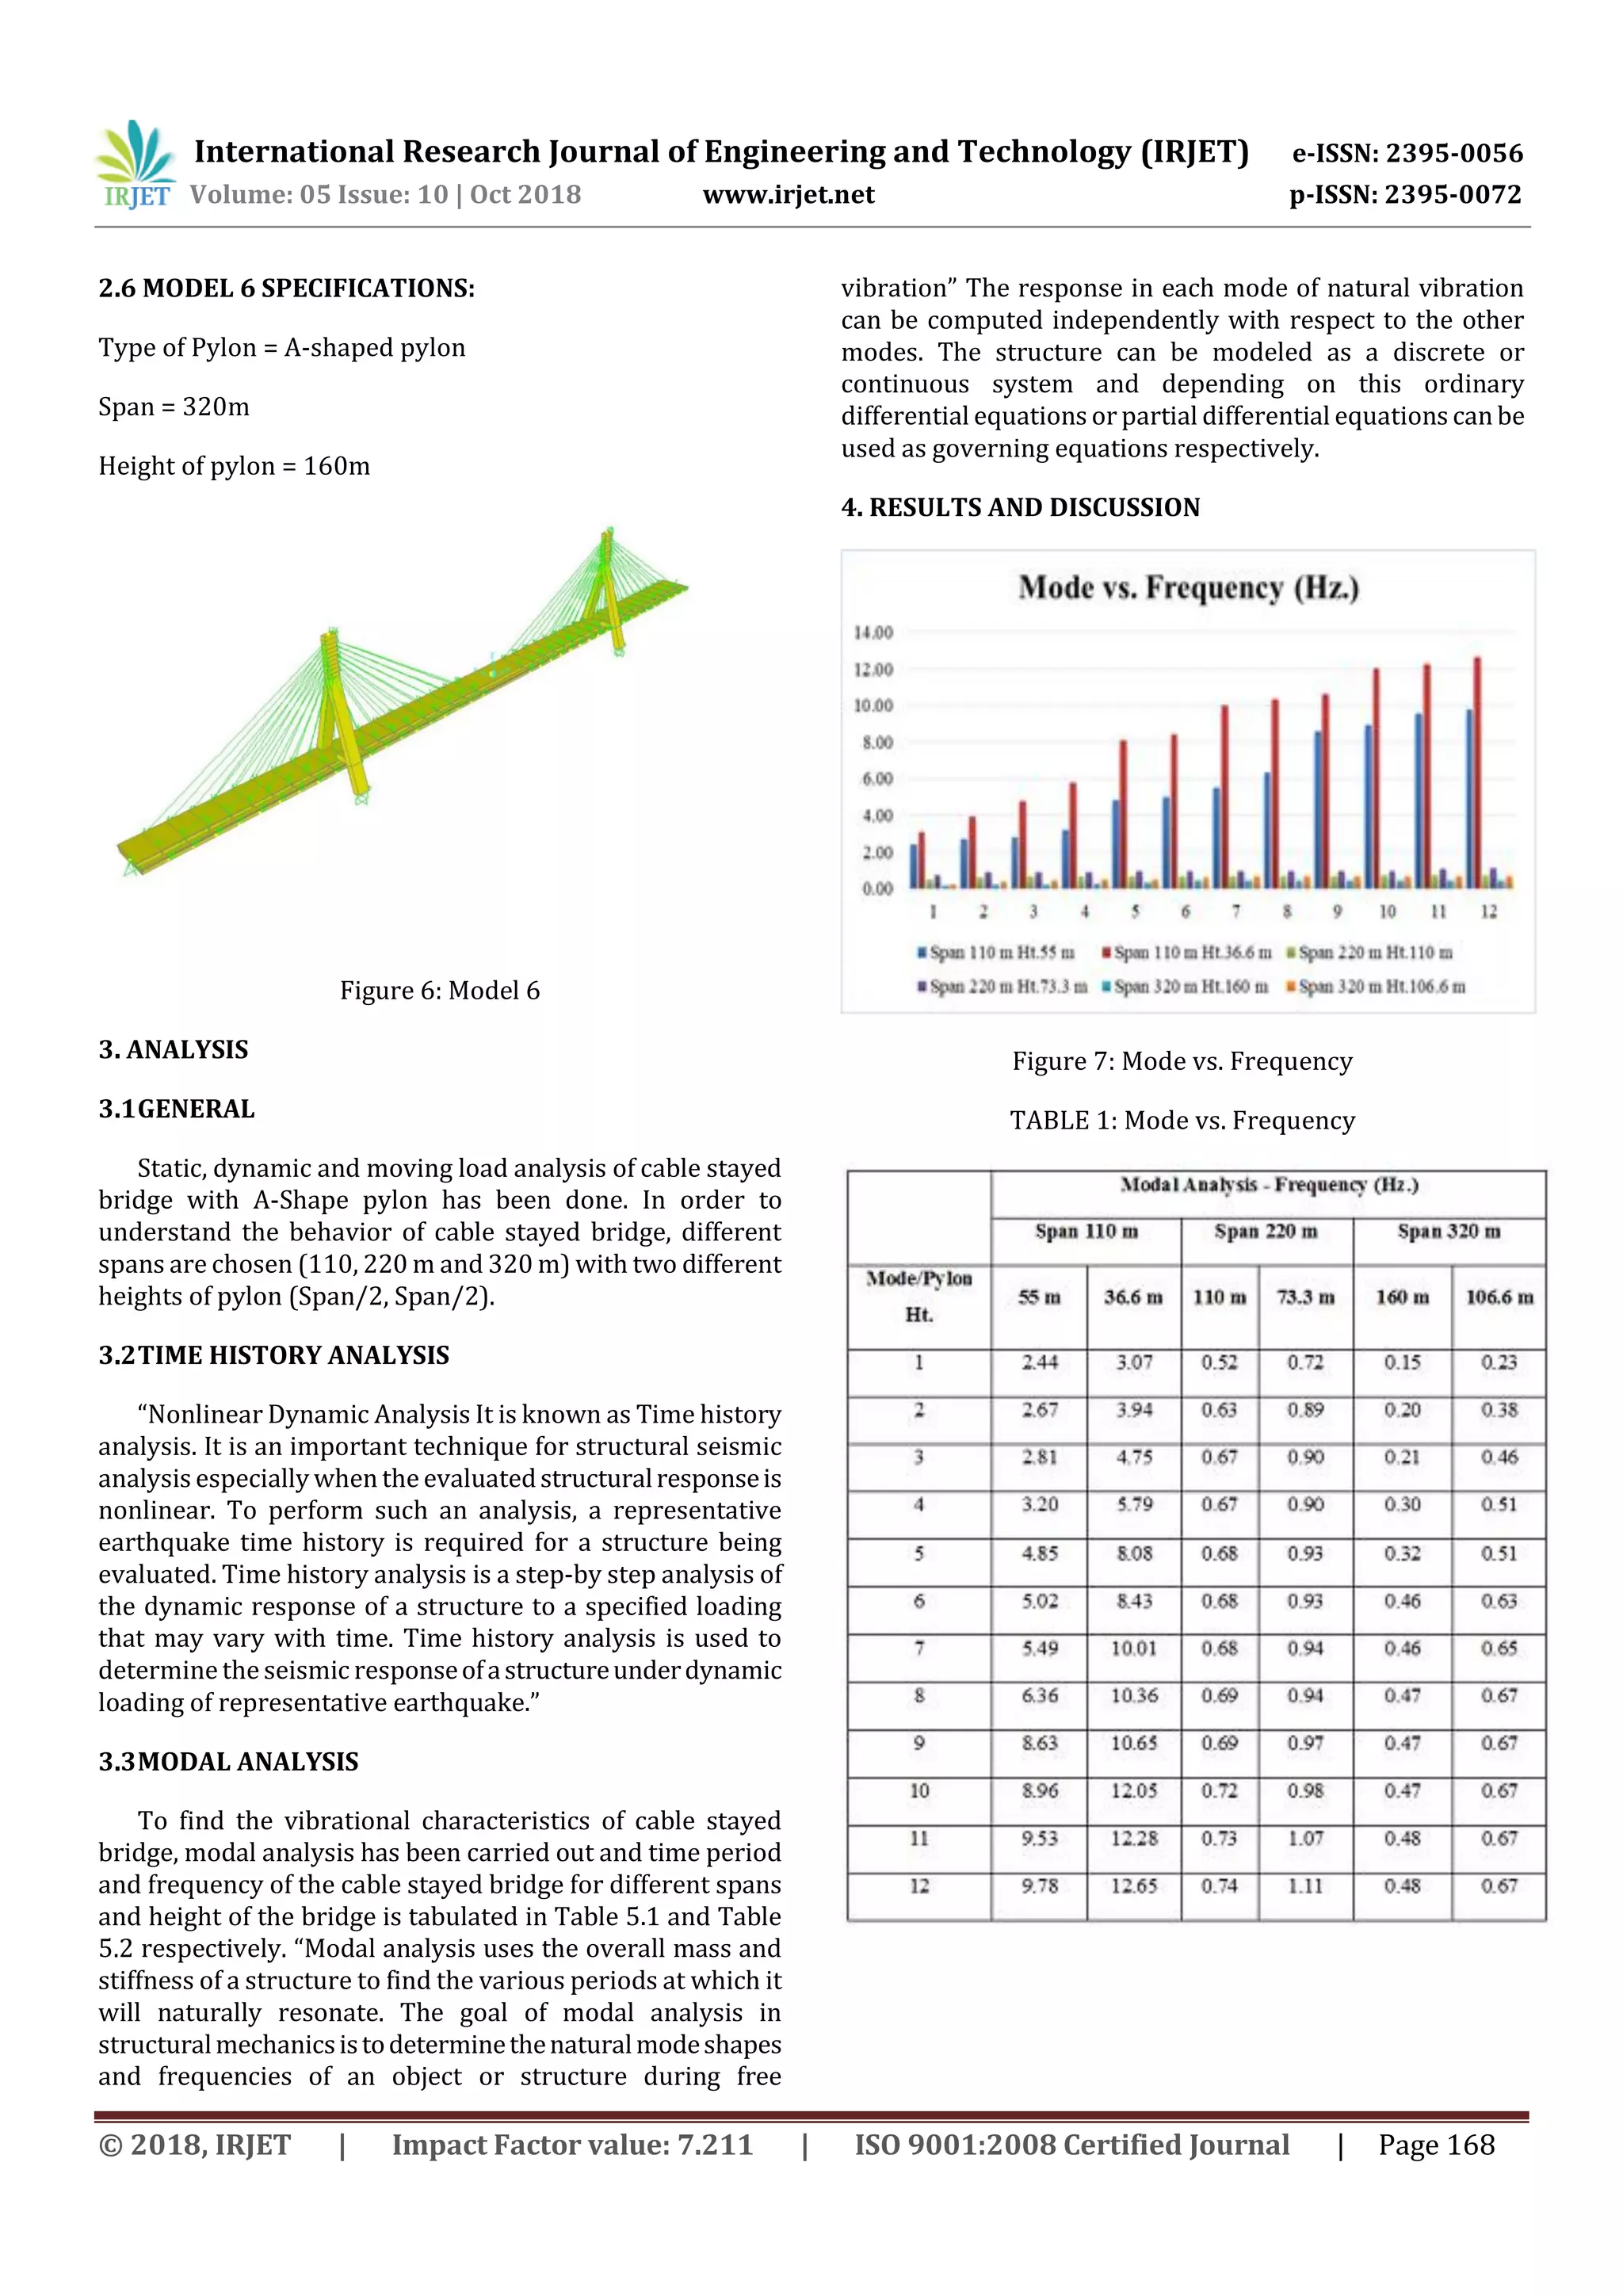
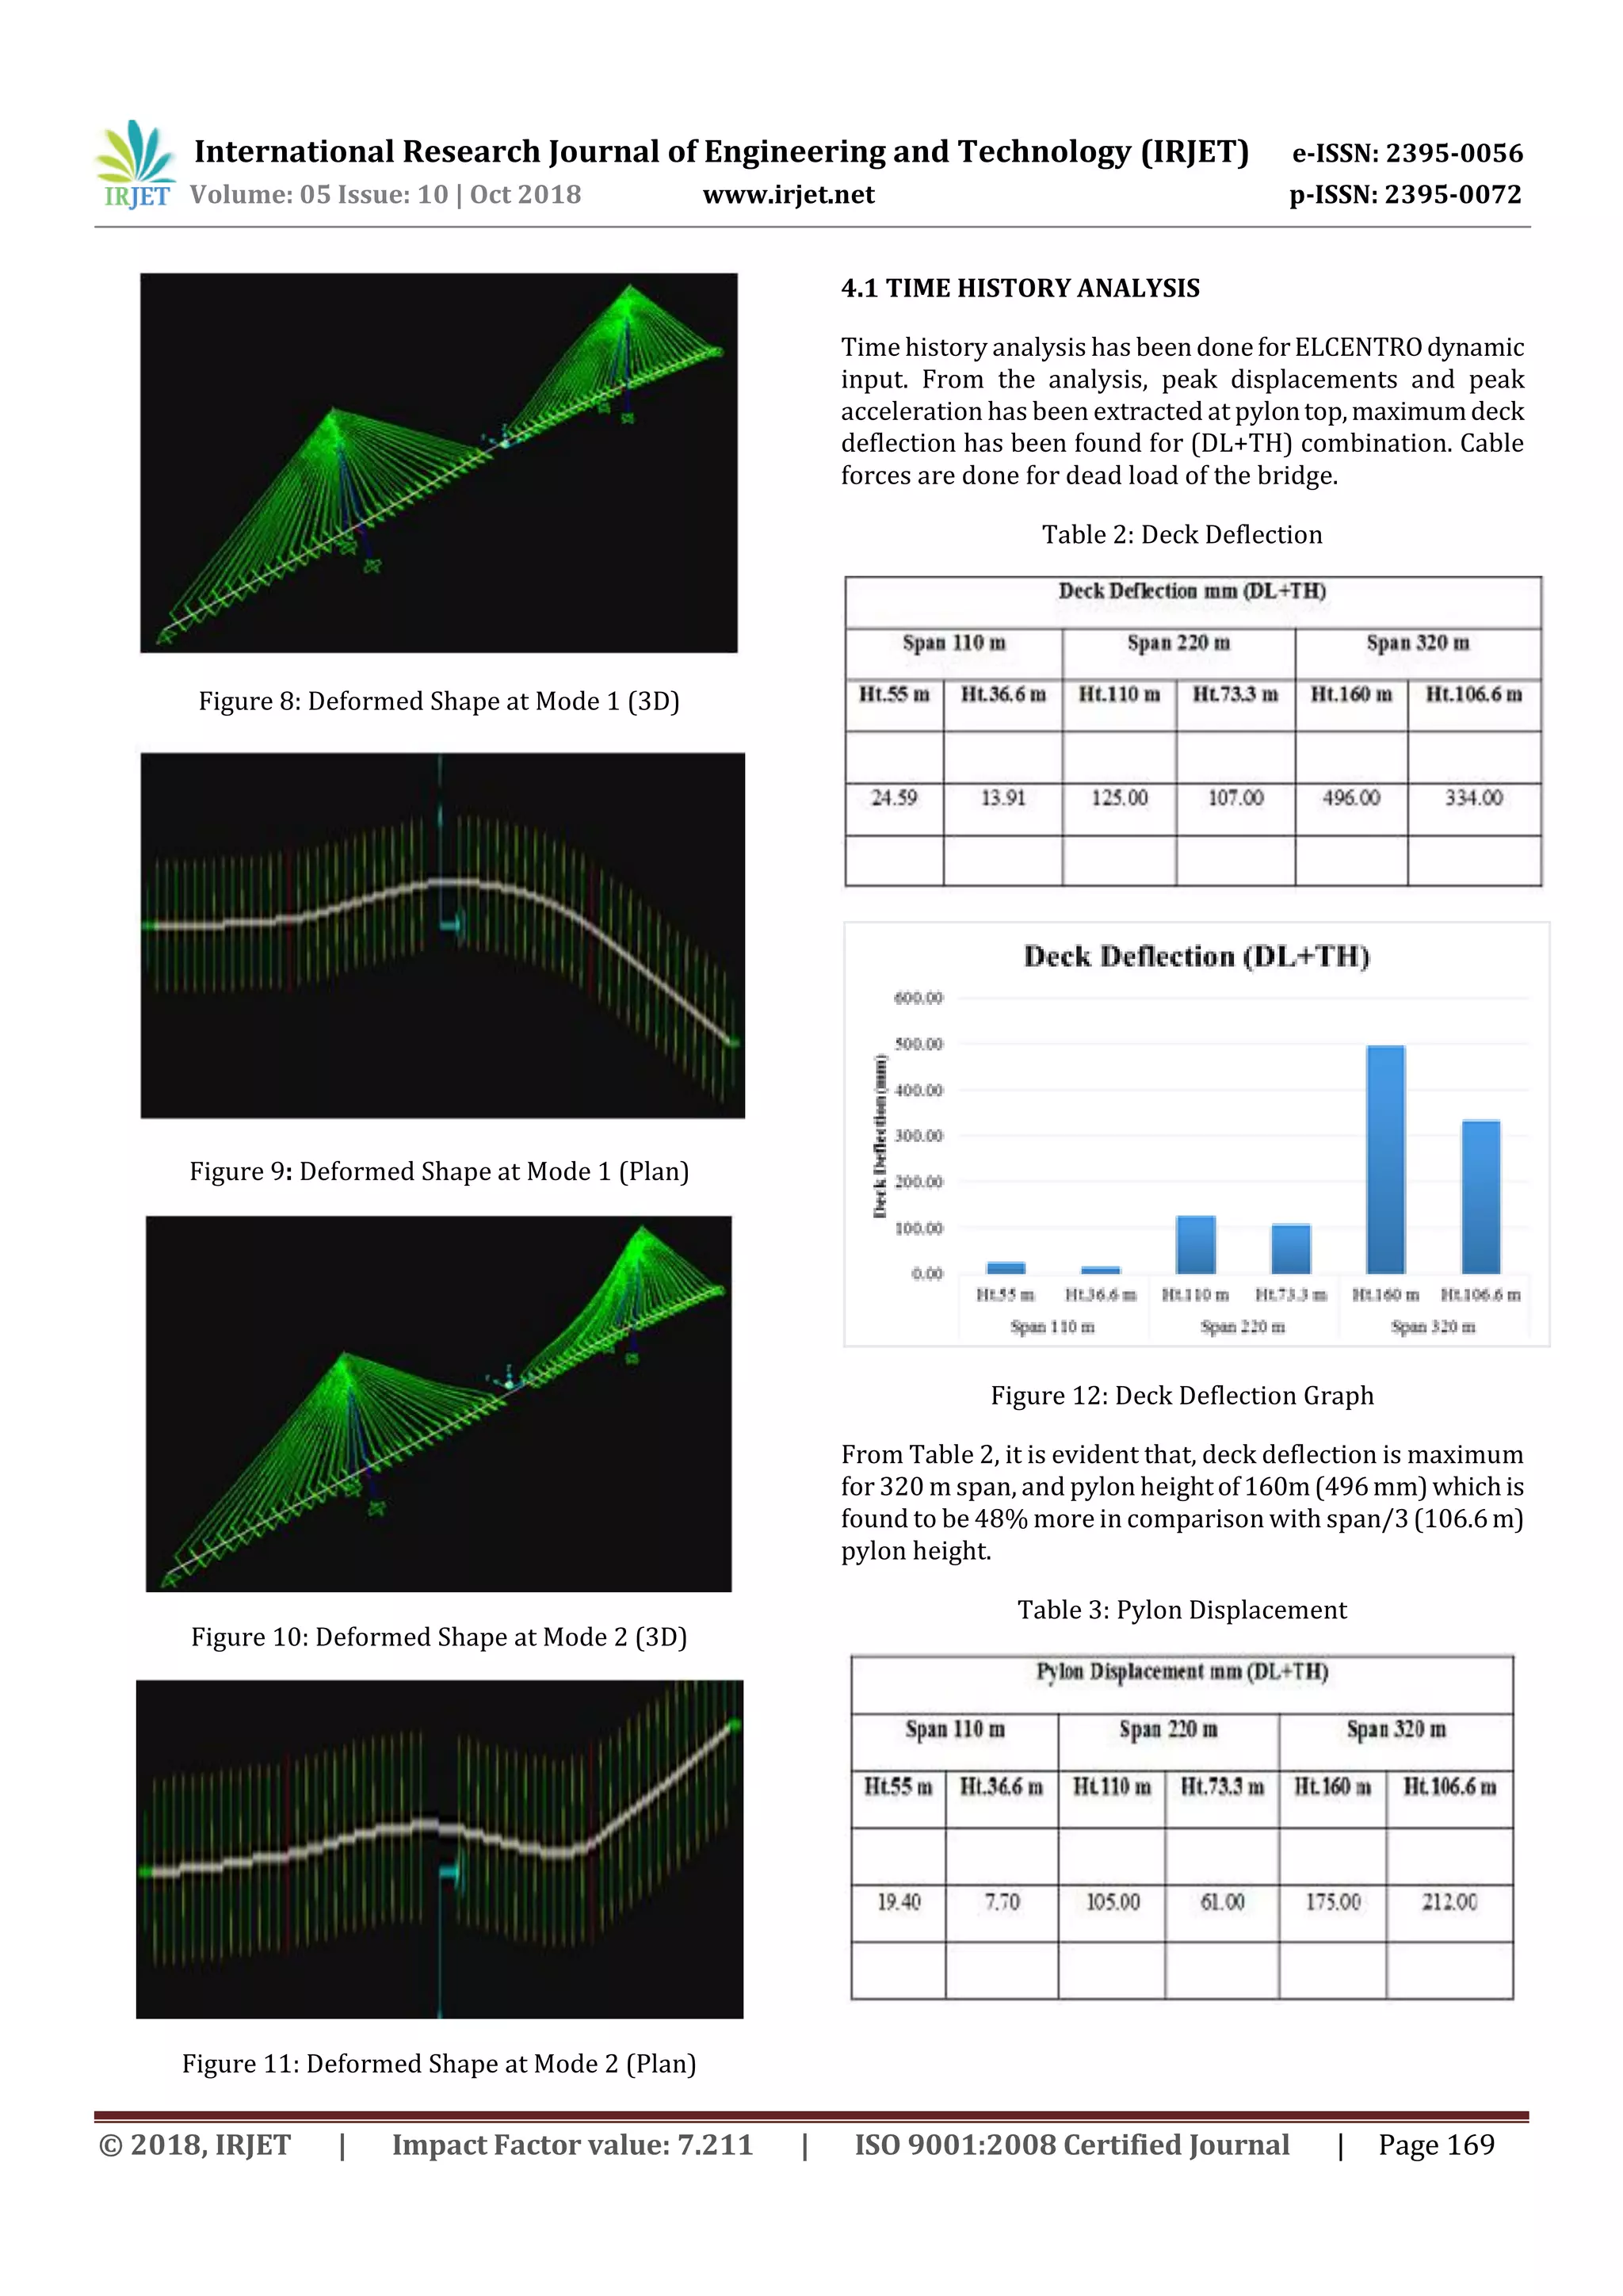
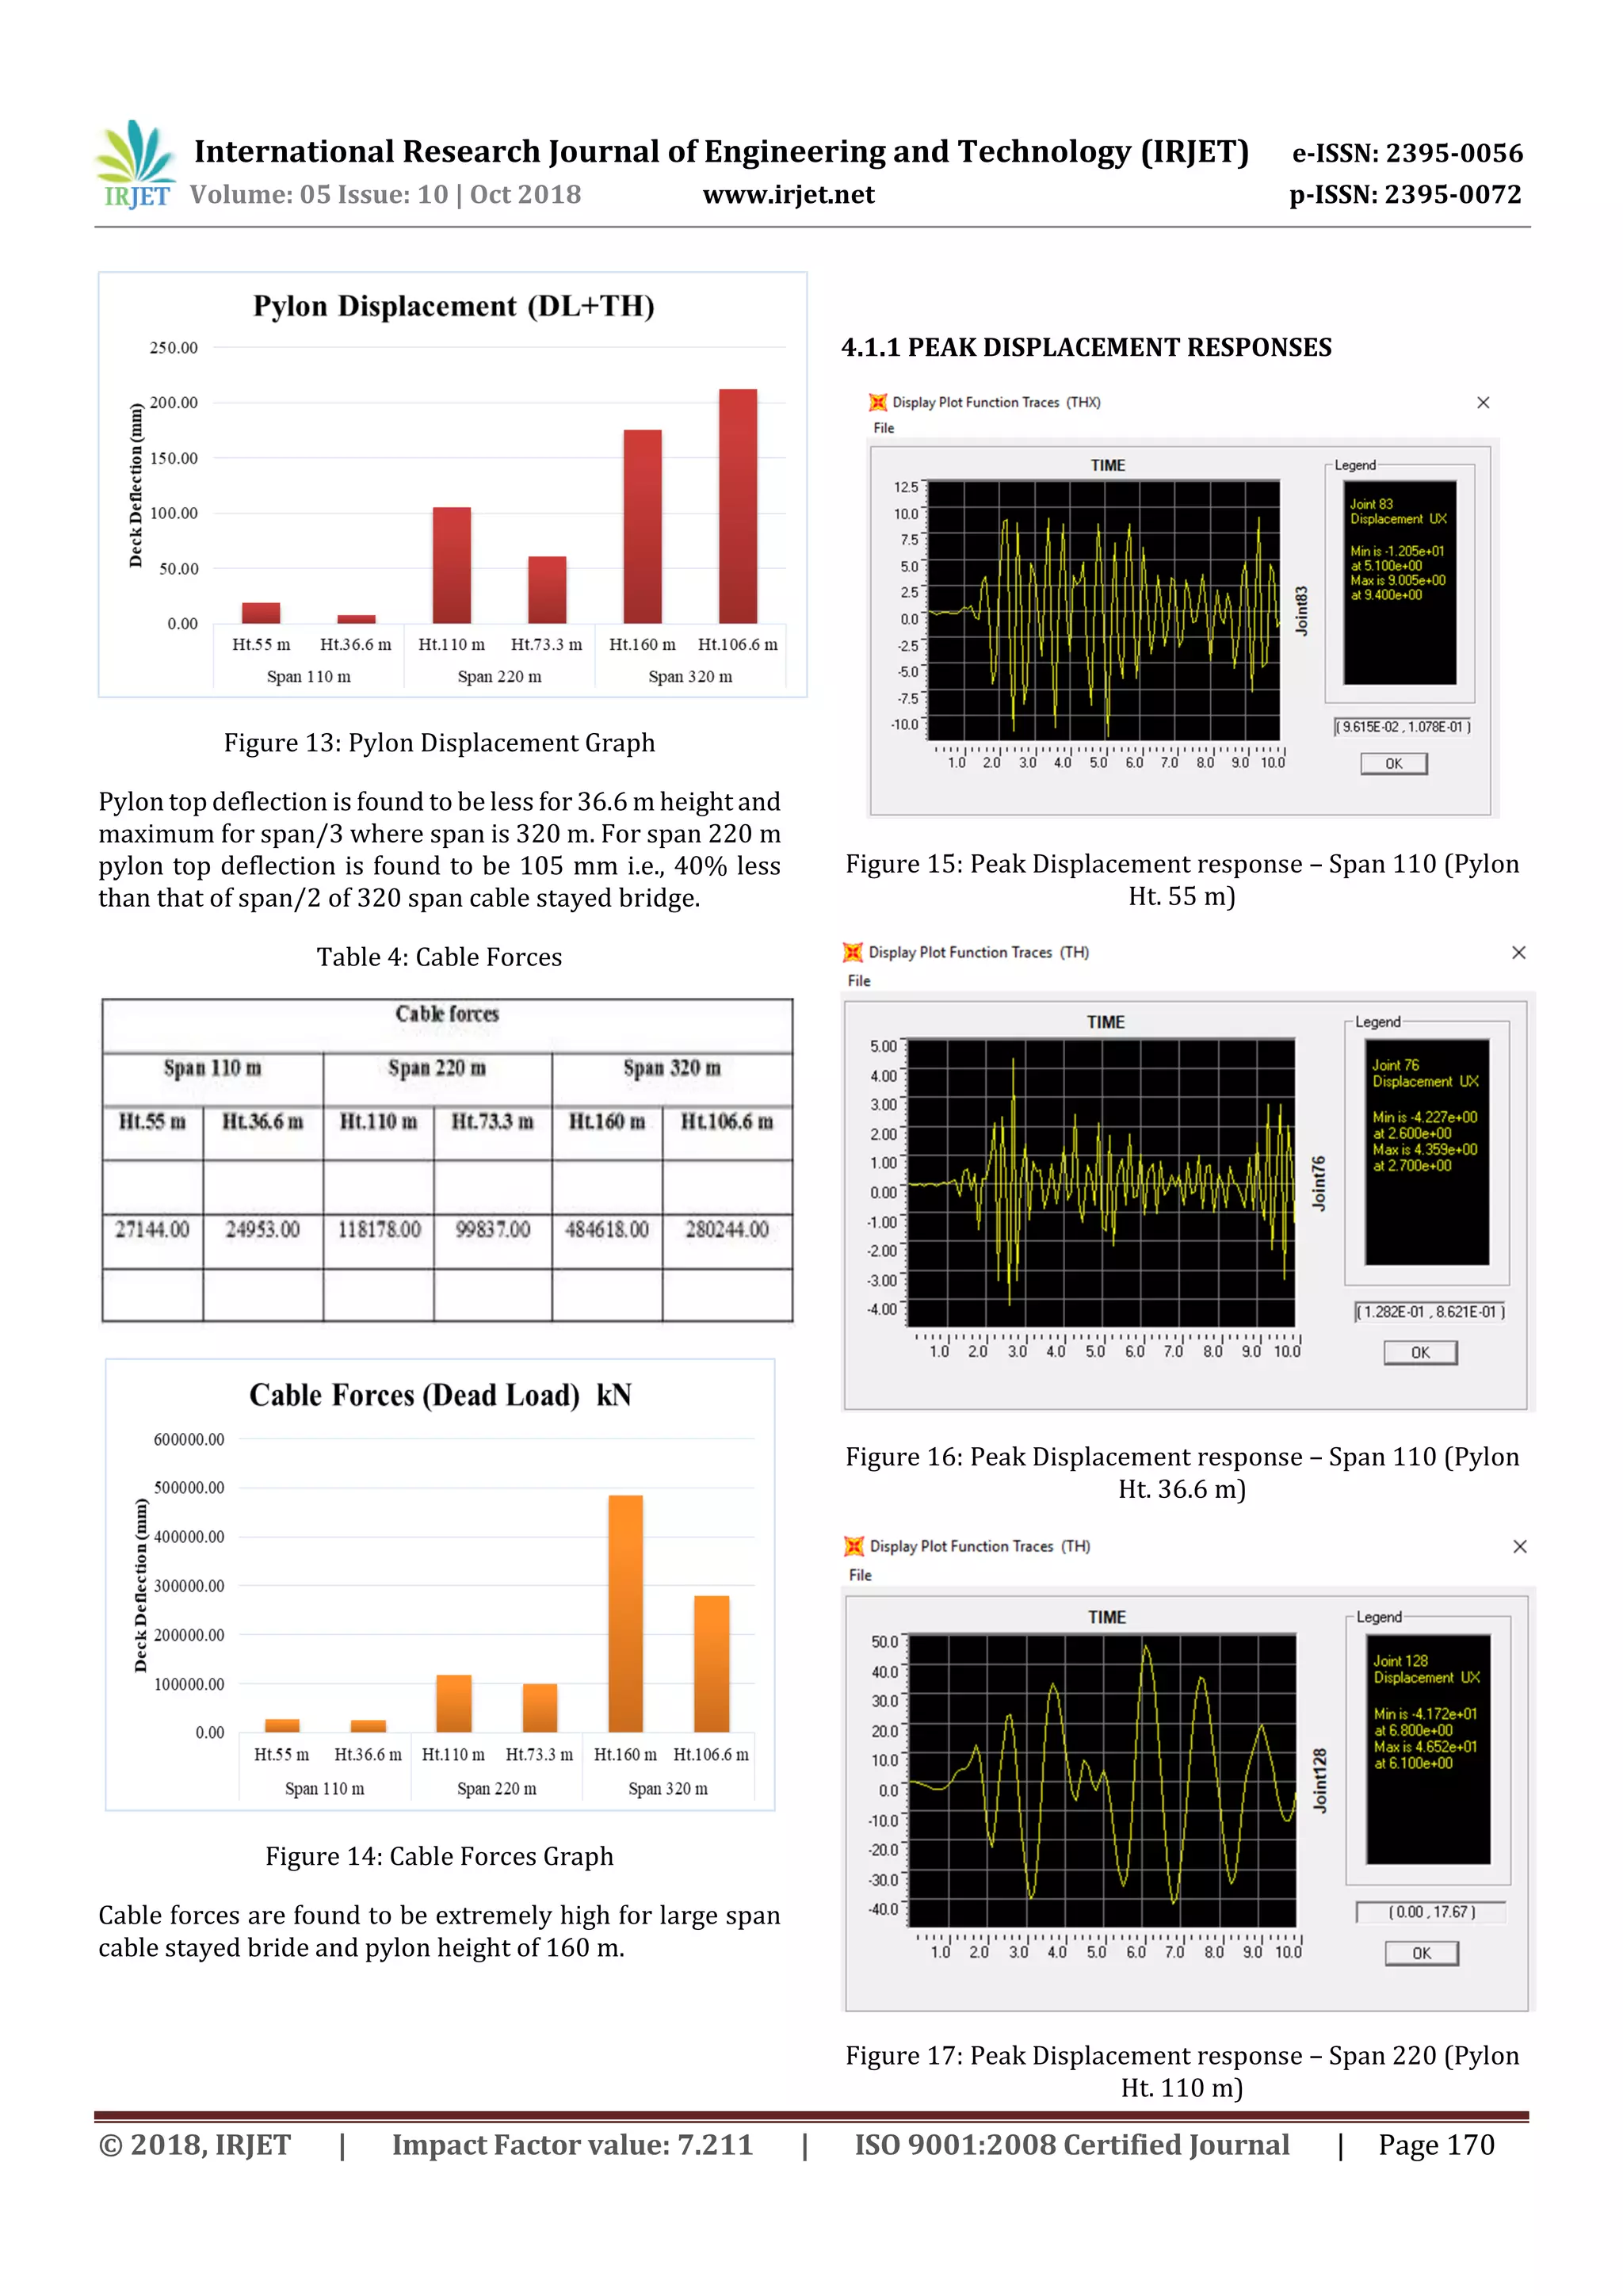
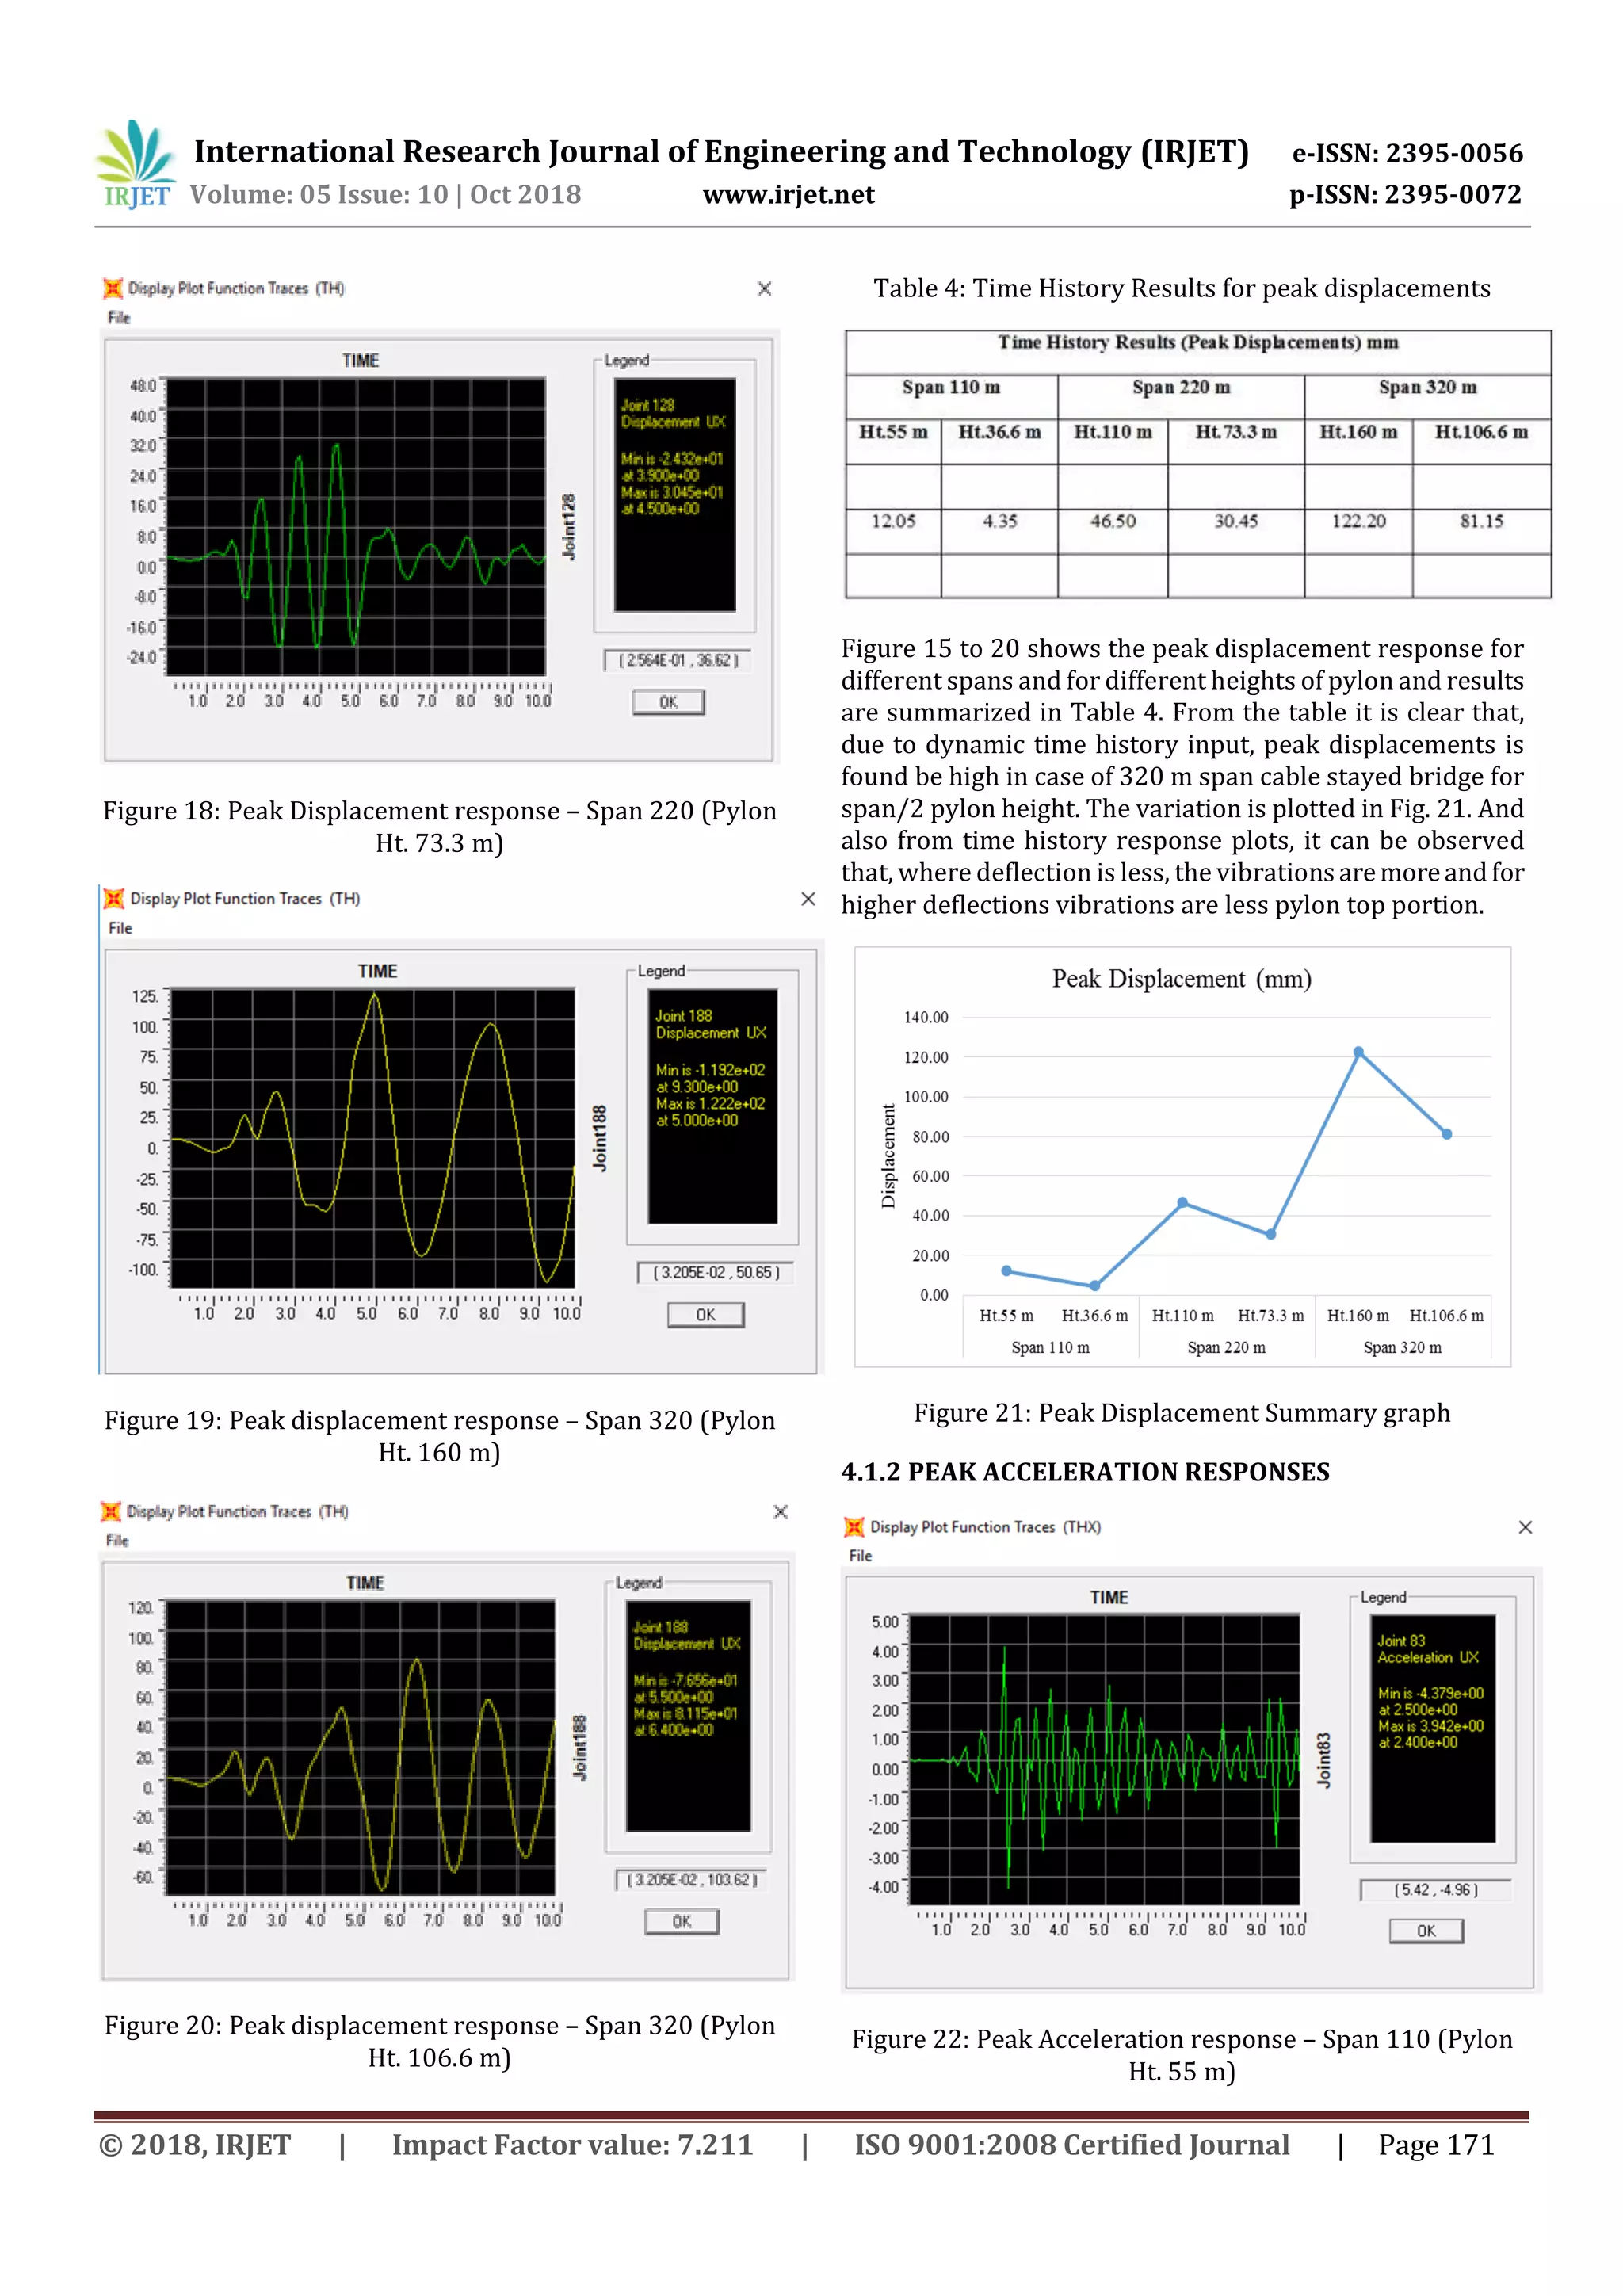
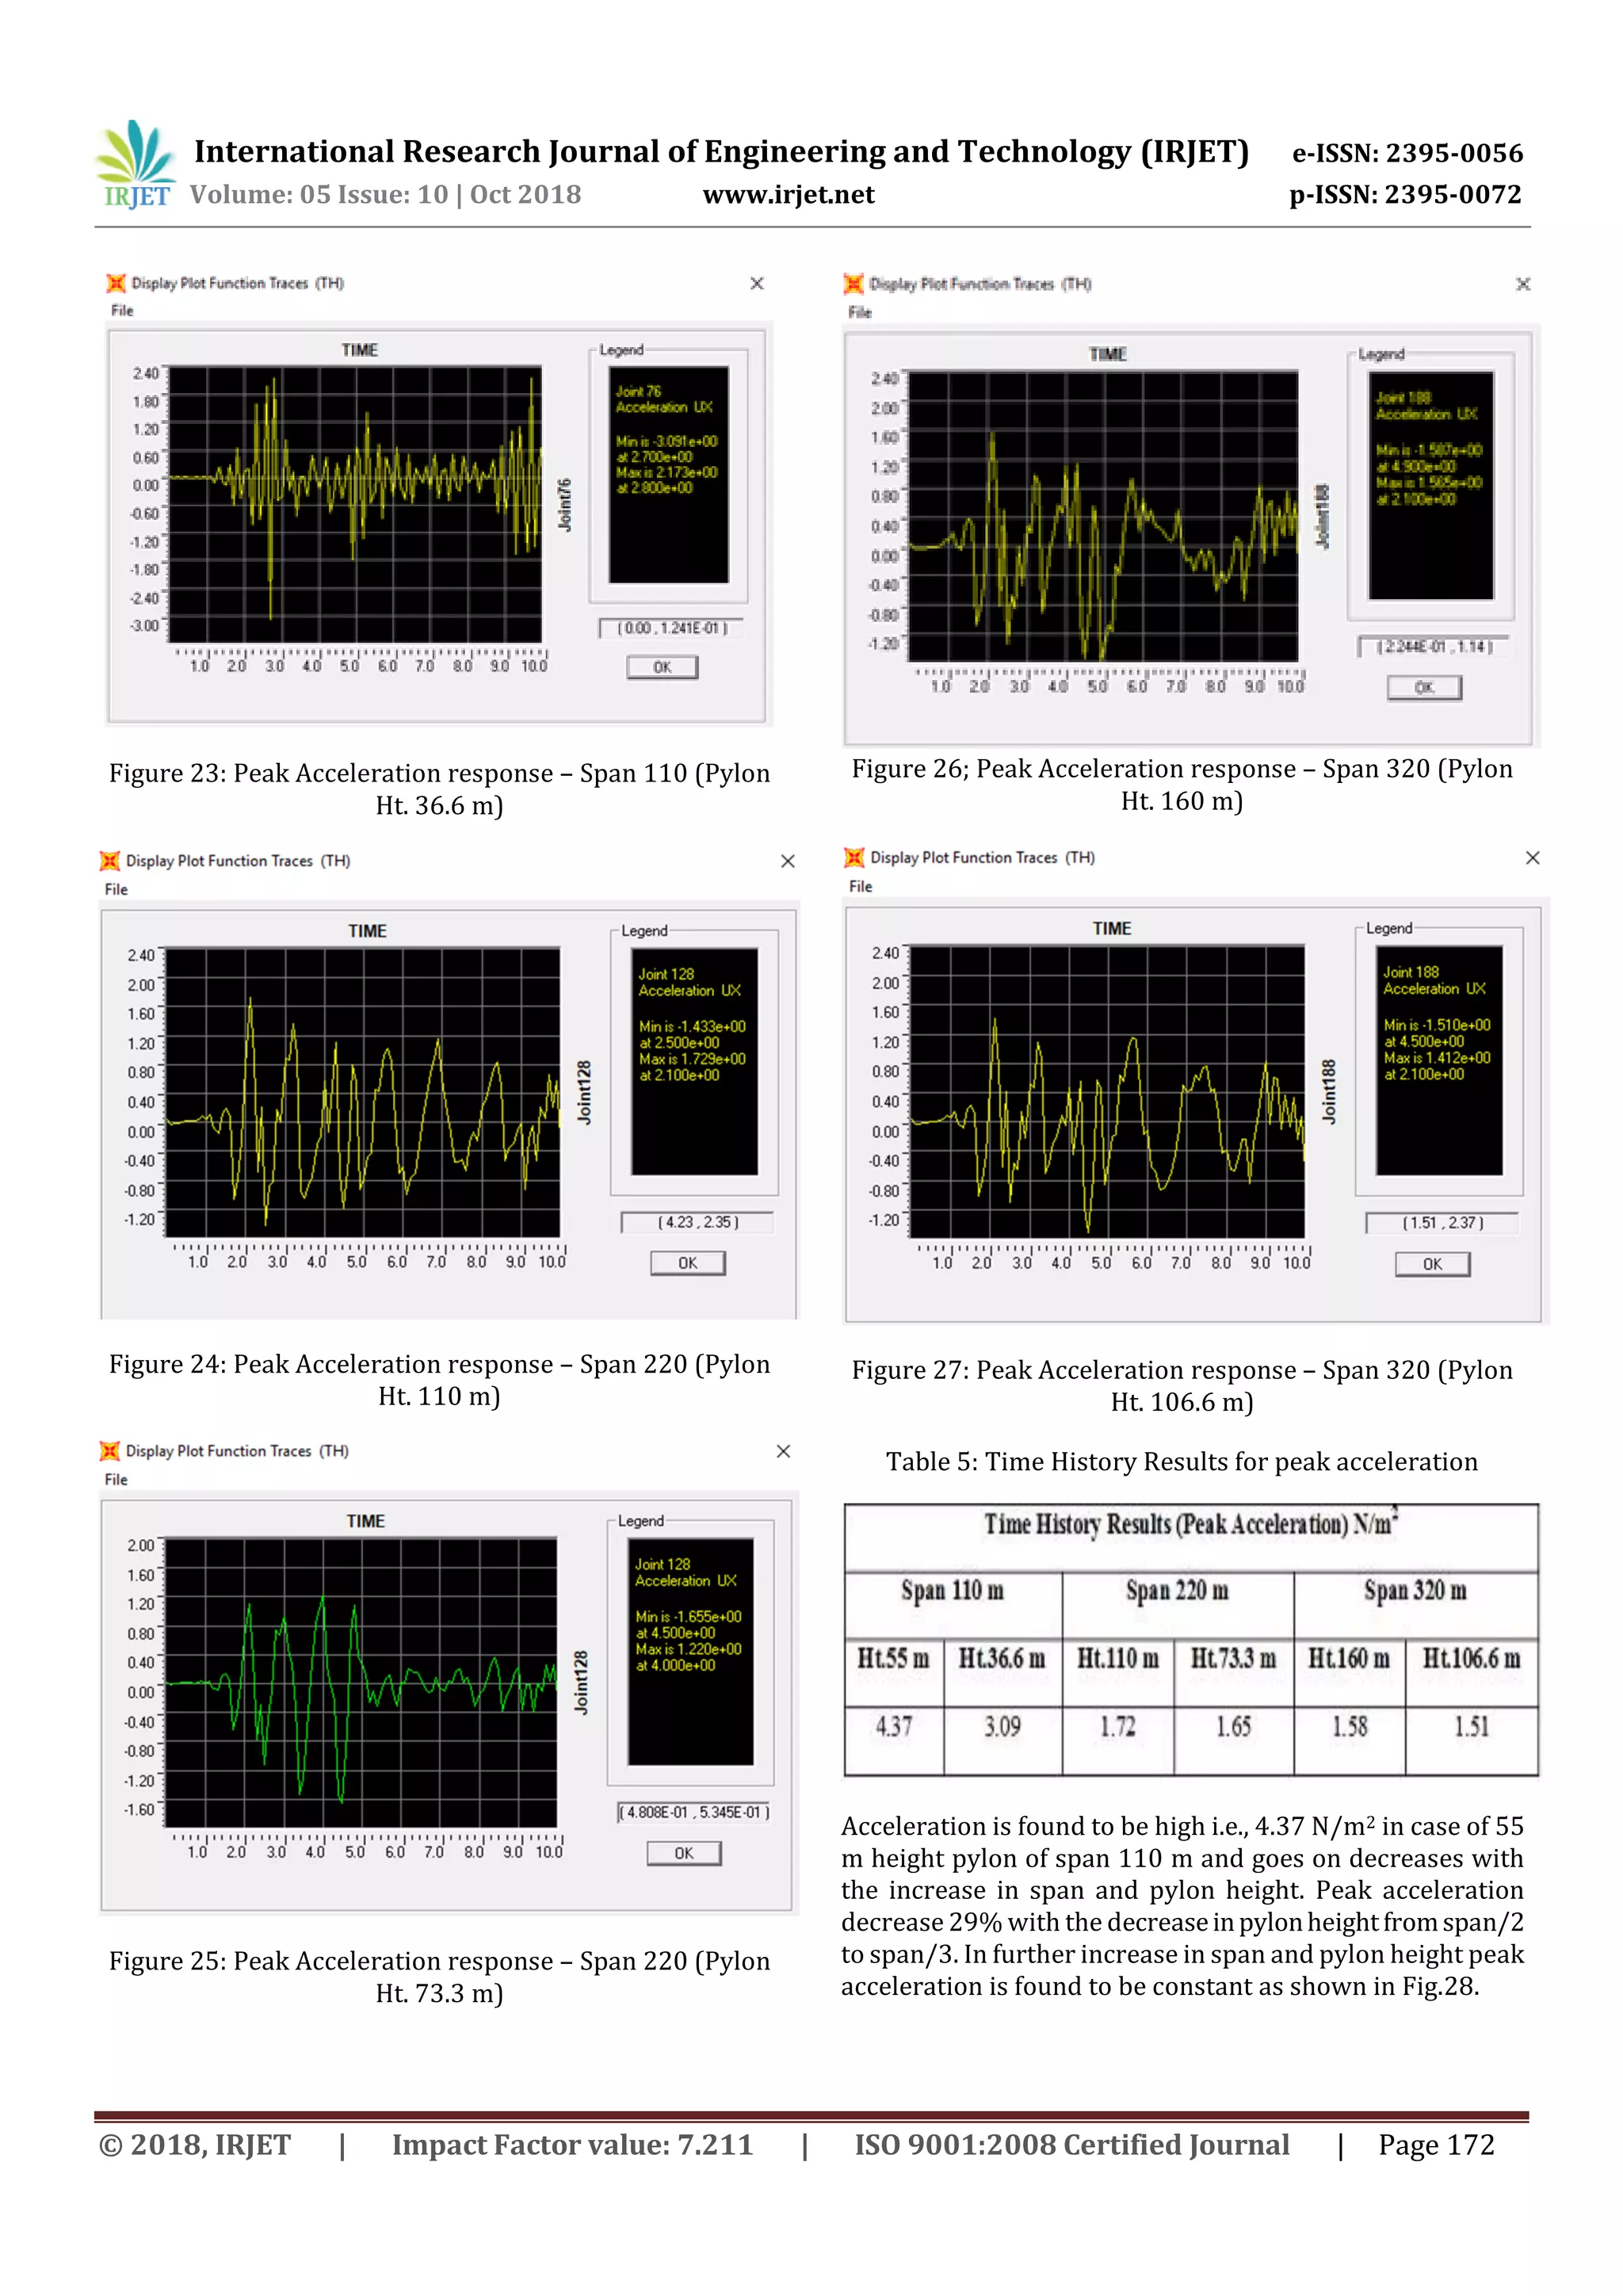
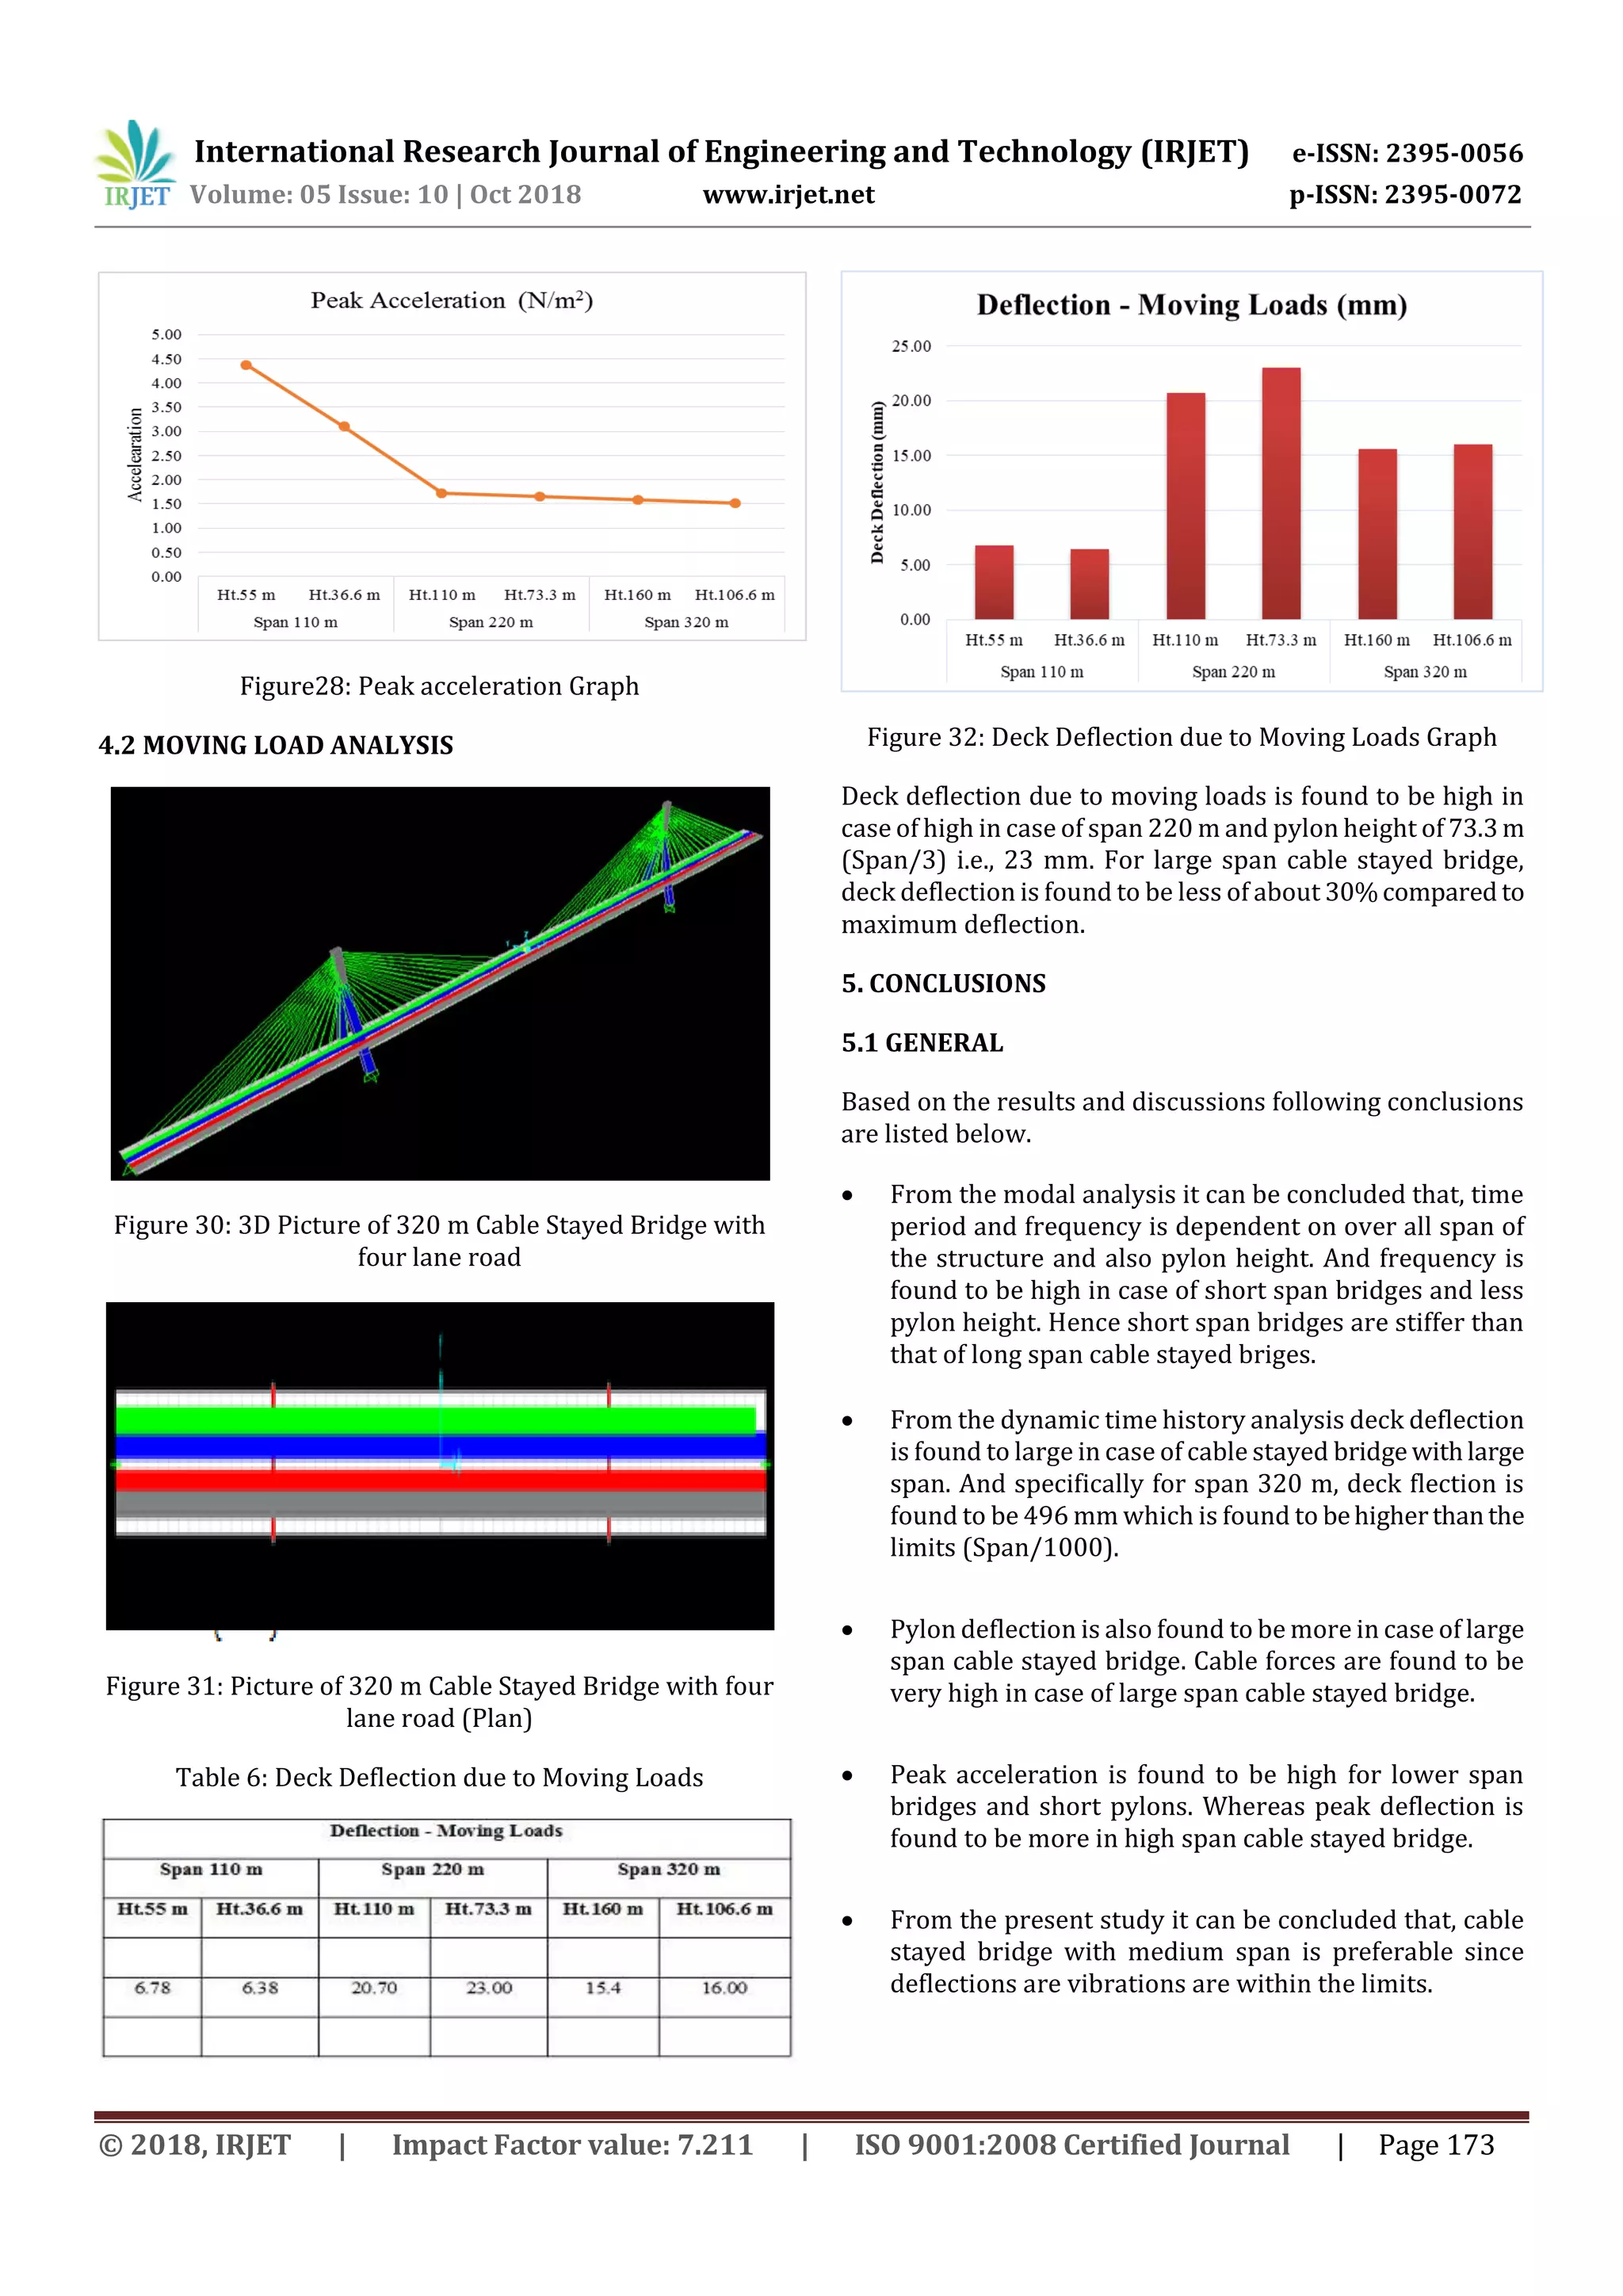

This document discusses time-history analysis of cable-stayed bridges with varying spans and pylon heights. Six bridge models were analyzed: three spans (110m, 220m, 320m) with two pylon heights for each (Span/3 and Span/2). Dynamic time-history analysis was performed using the El Centro earthquake record. Results showed that deck deflection, pylon displacement, and cable forces all increased with larger spans and taller pylon heights. Peak displacements under dynamic loading also tended to be highest for the longest (320m) span bridges. Modal analysis determined the natural frequencies decreased with increasing span size.


