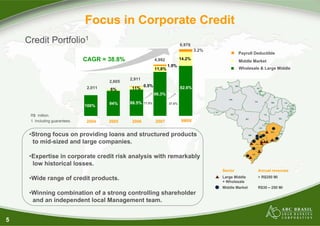
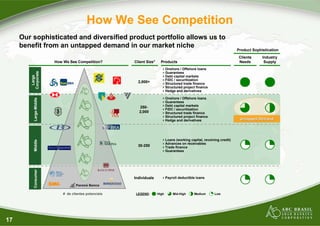
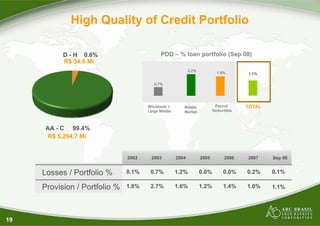
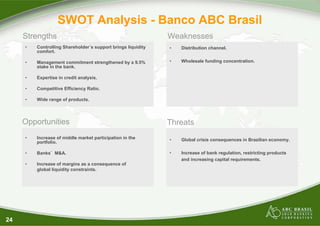
- Banco ABC Brasil is a mid-sized Brazilian bank focused on providing loans and structured products to mid-sized and large companies, with expertise in corporate credit risk analysis and low historical losses.
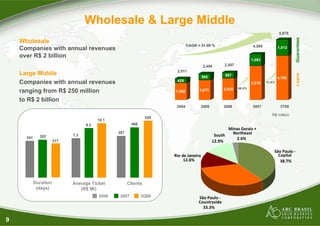
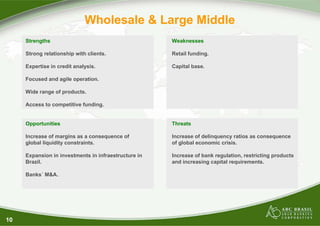
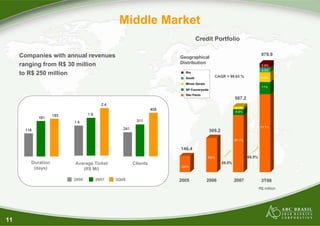
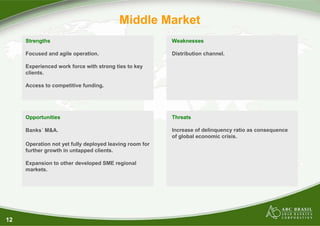
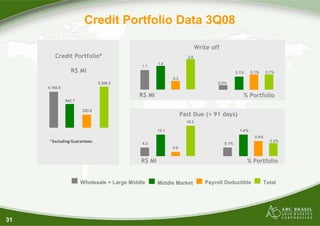
- The bank has three business segments: Wholesale & Large Middle (companies over R$250M revenues), Middle Market (companies R$30-250M revenues), and Payroll Deductible loans.
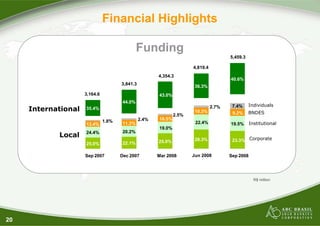
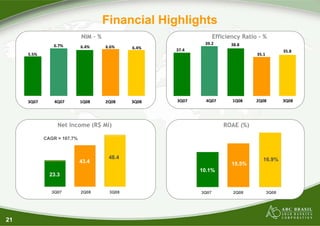
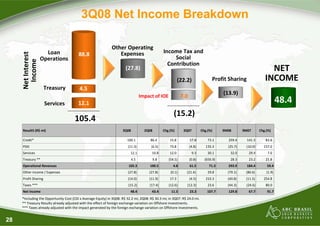
- In 3Q08, the bank reported net income of R$48.4M, with its main revenue sources being credit operations, payroll deductible loans, and services.