Download as PDF, PPTX
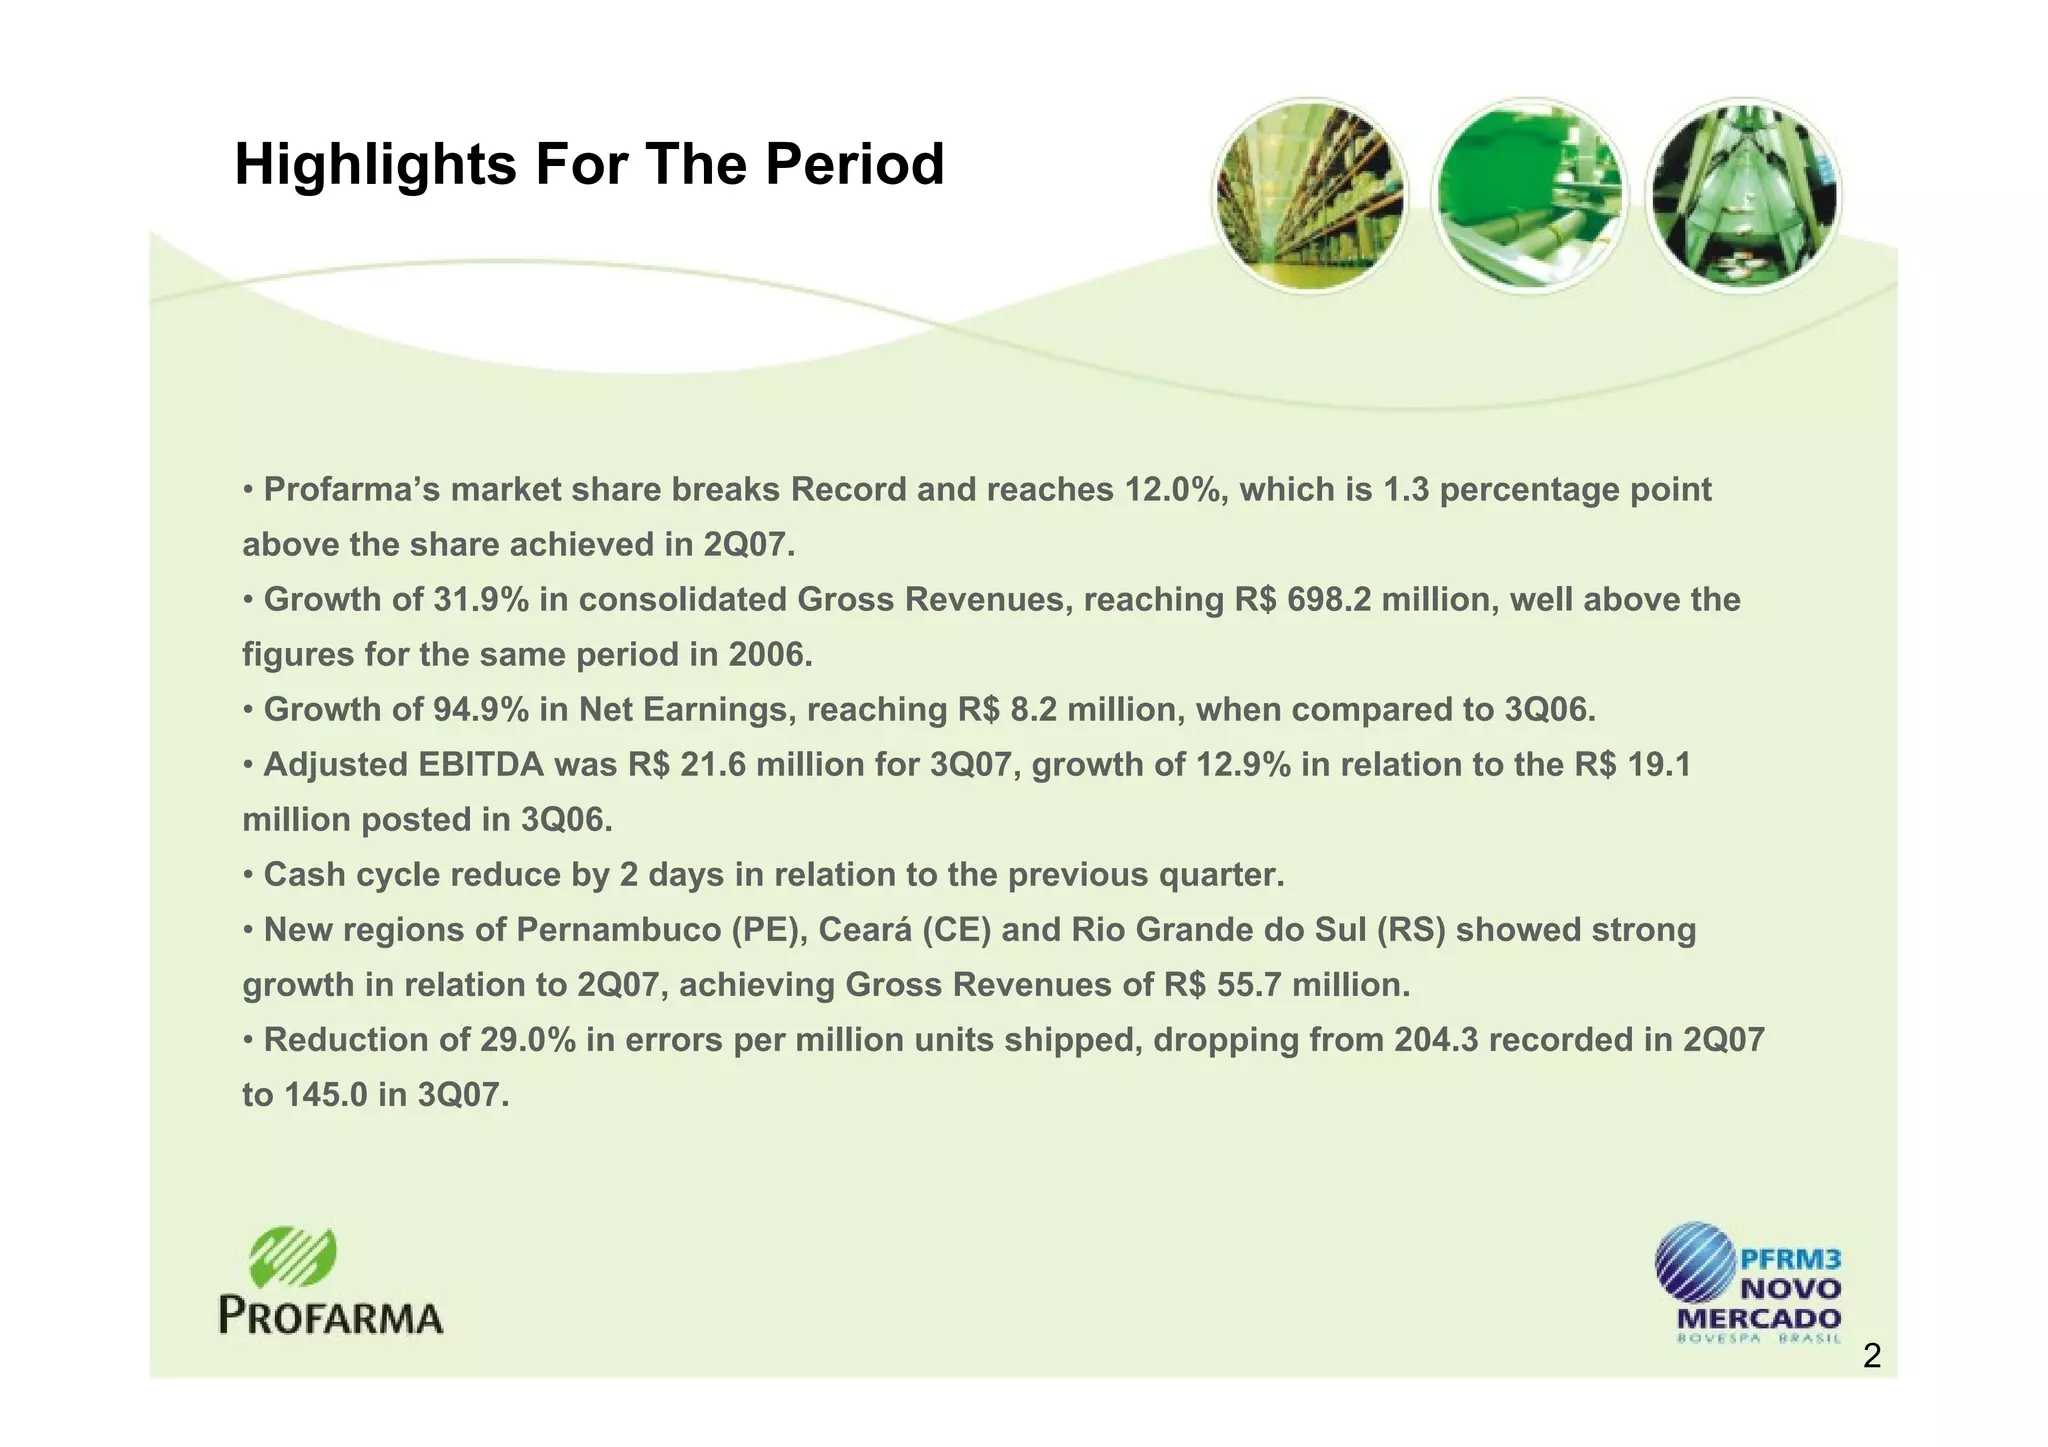
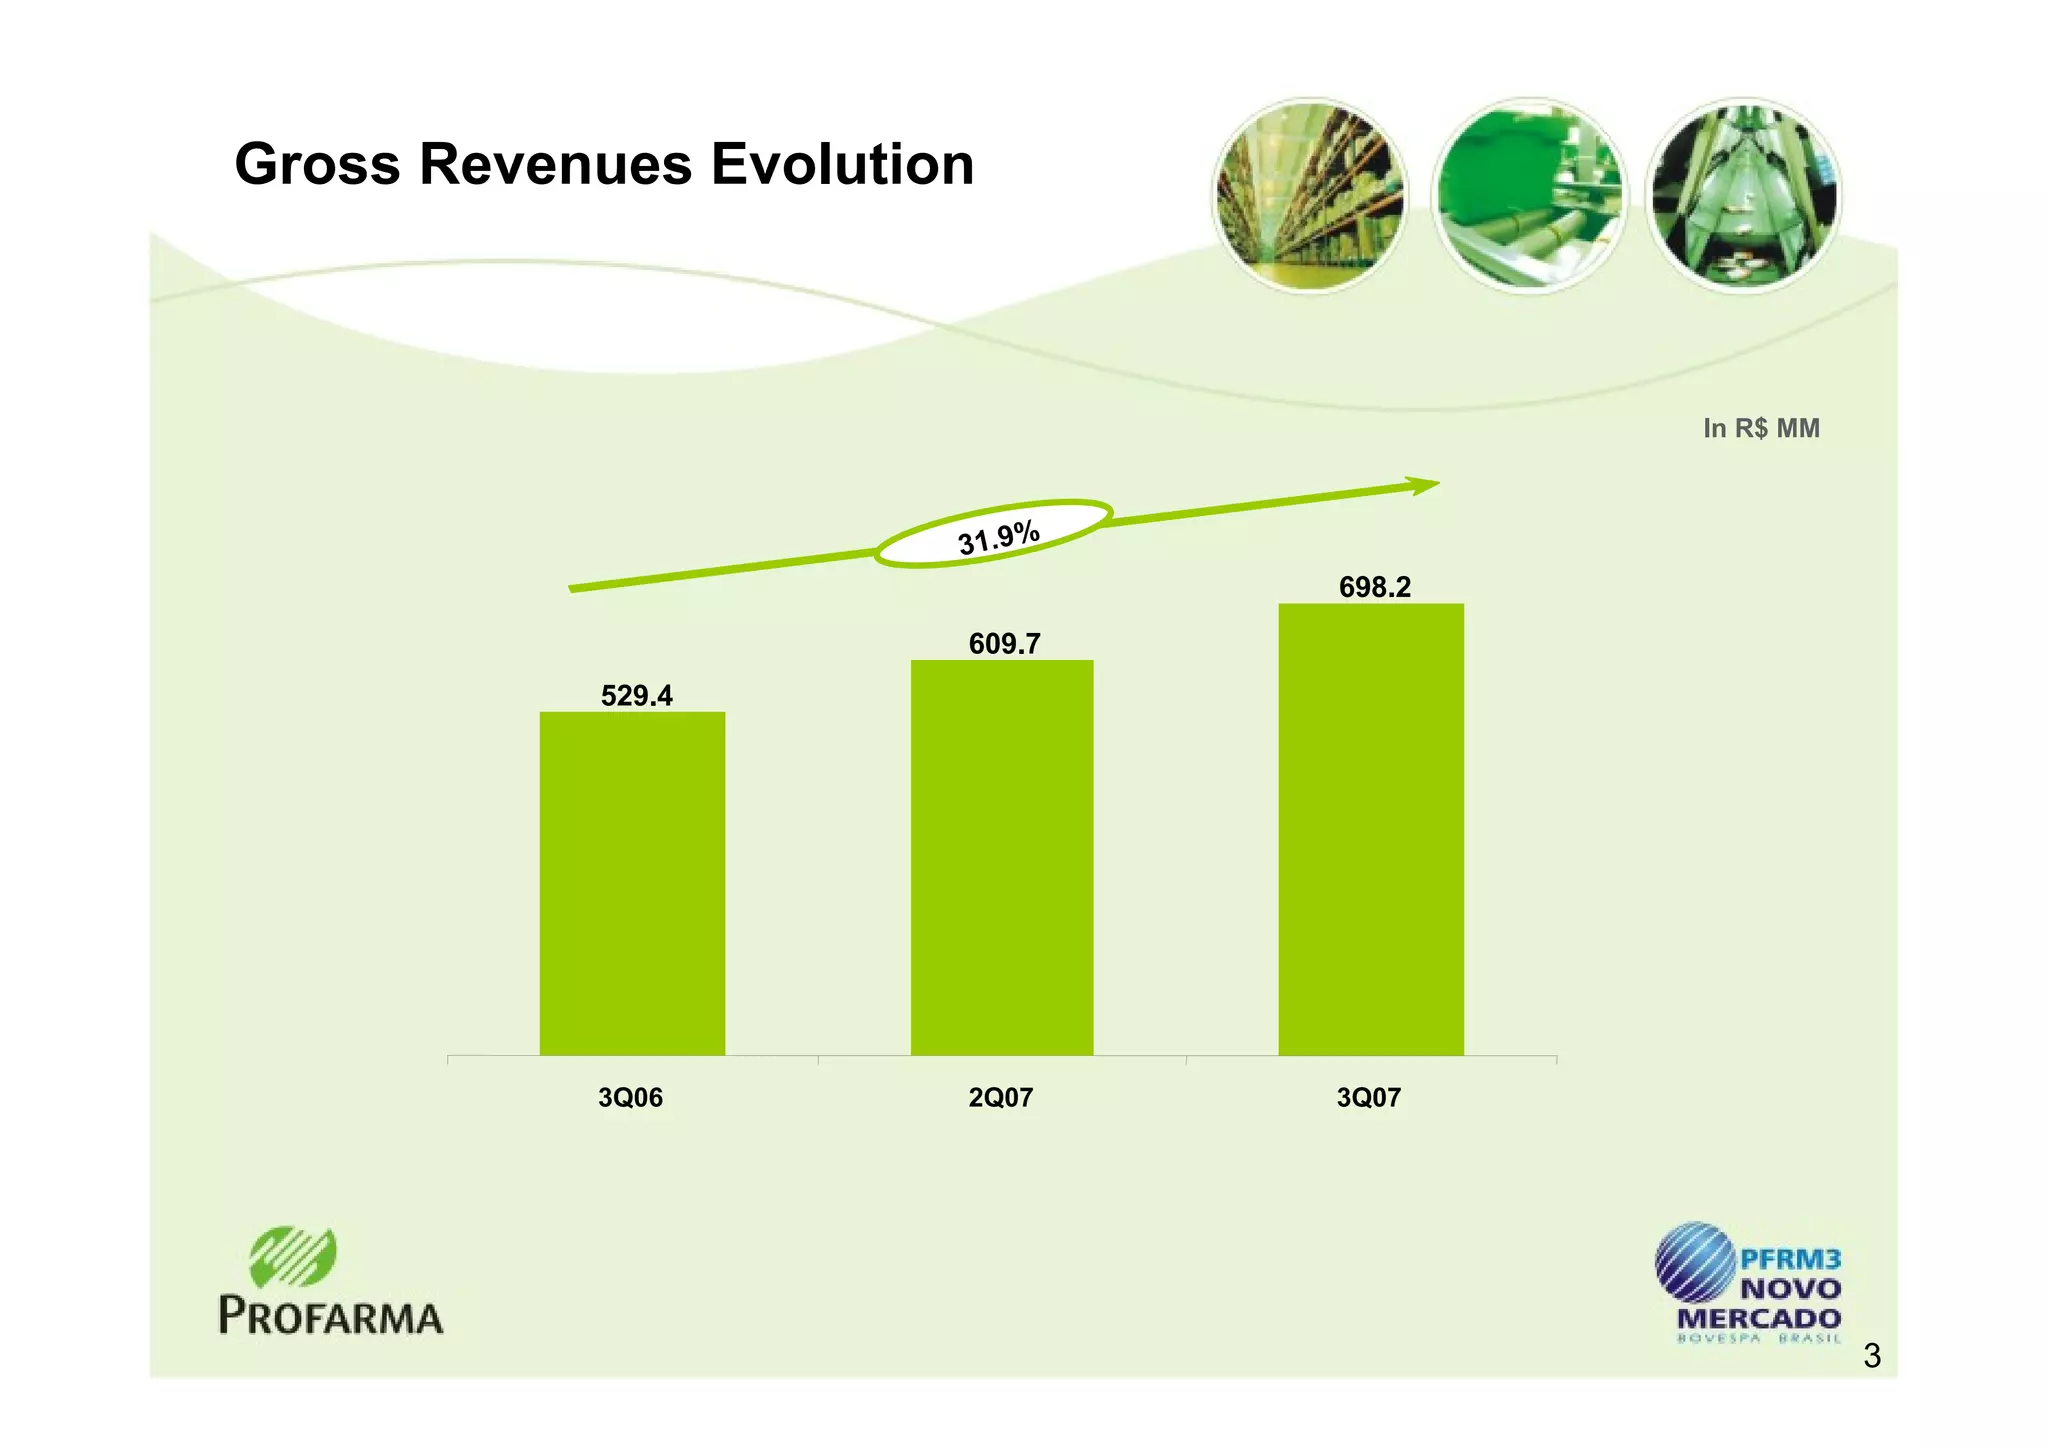
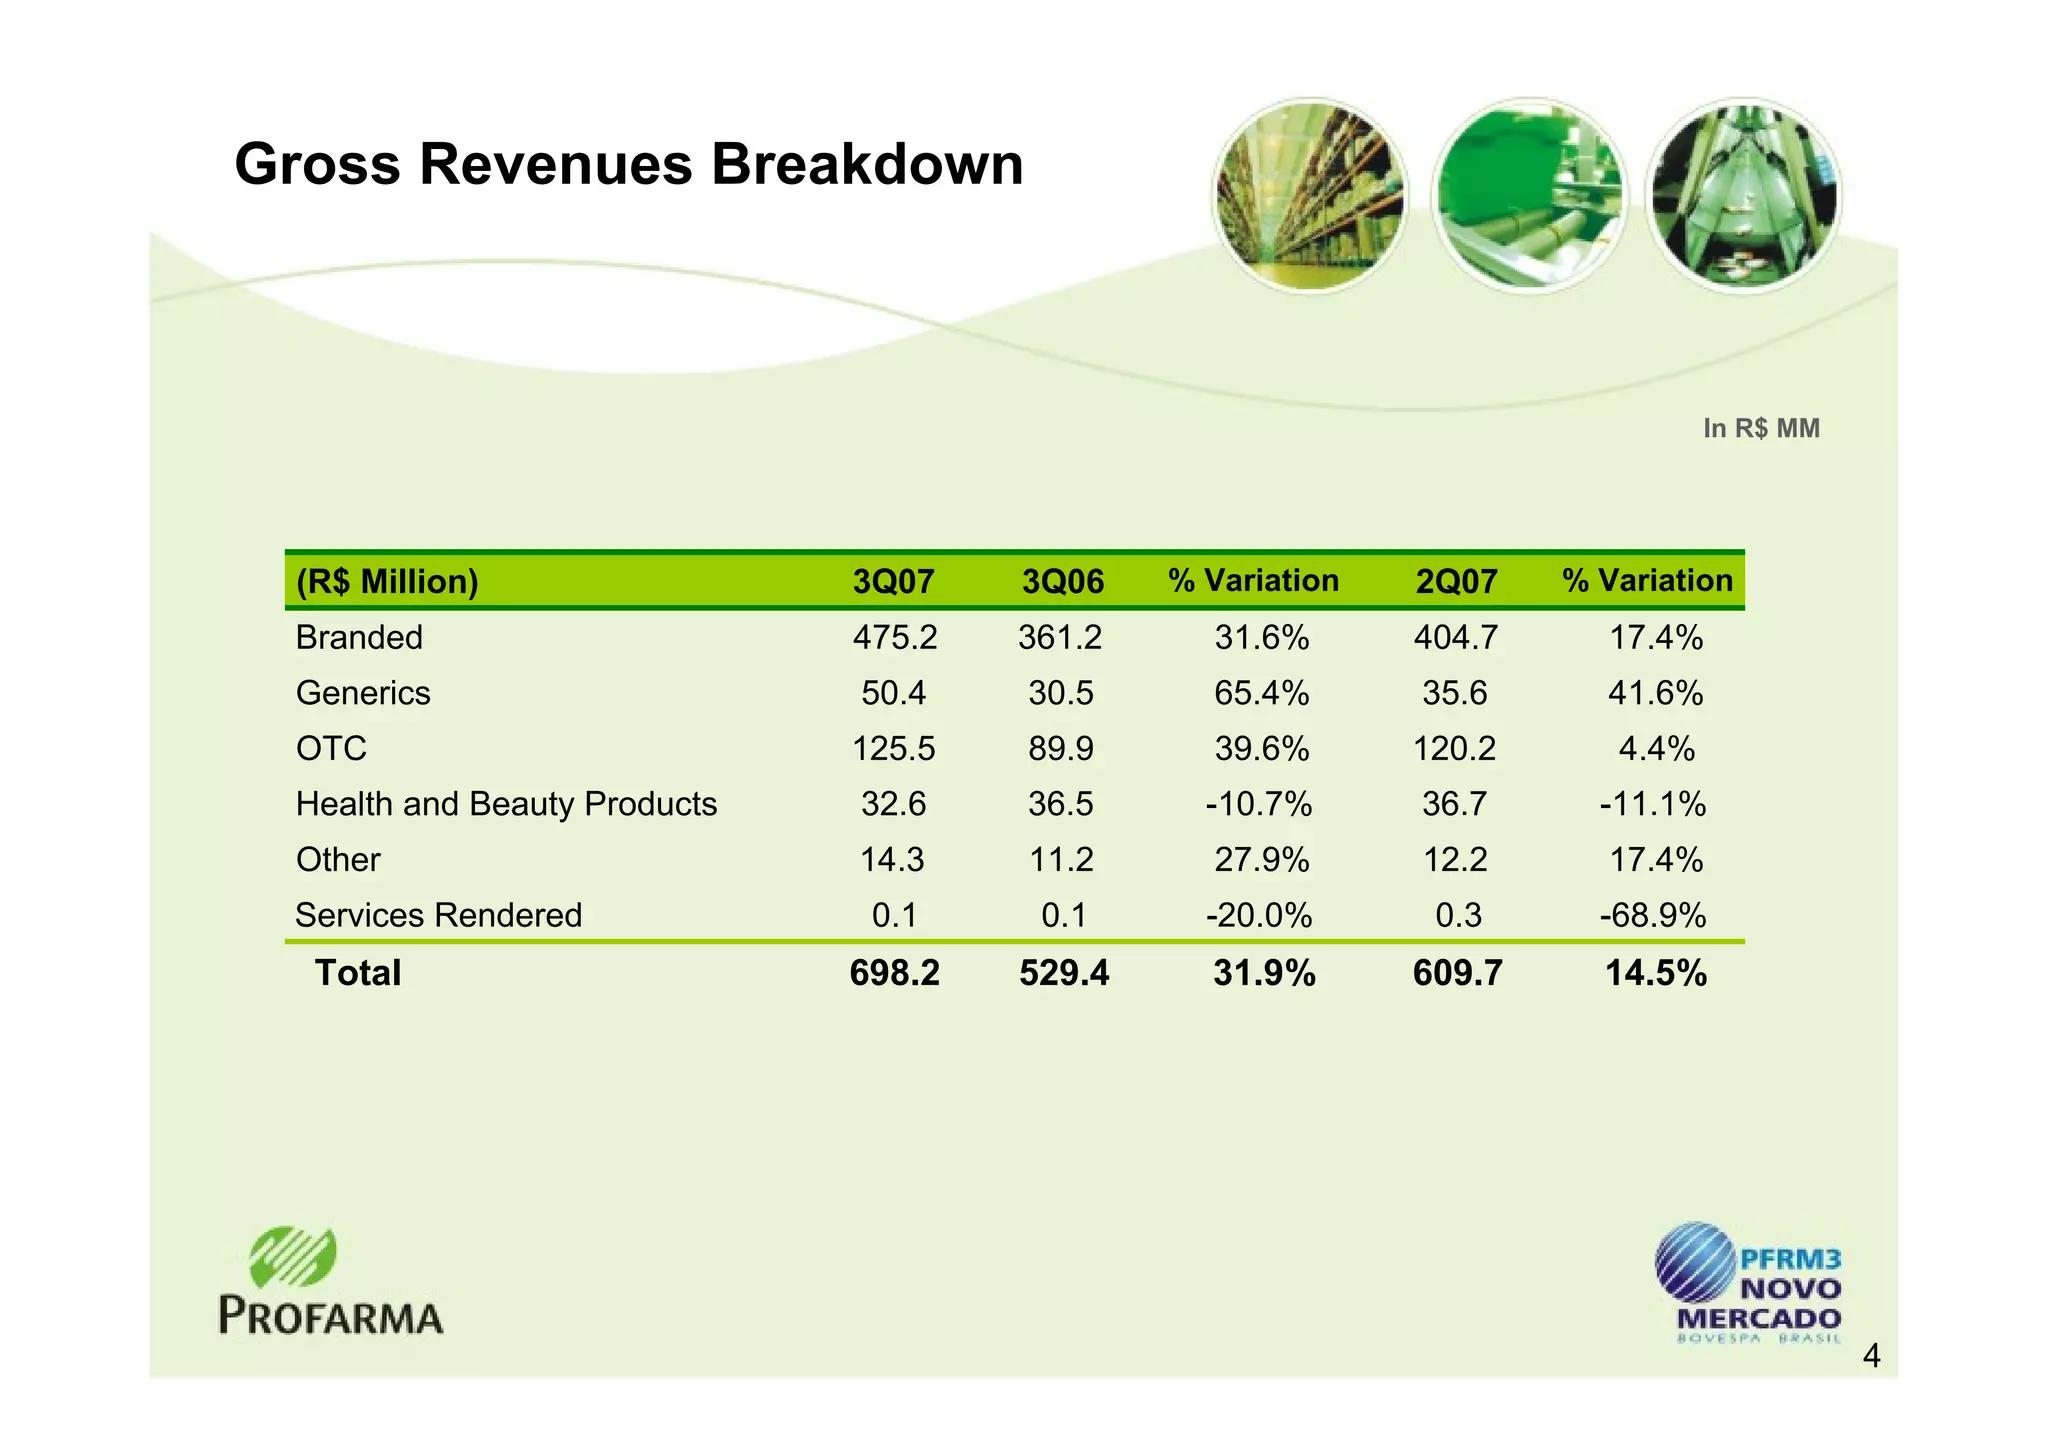
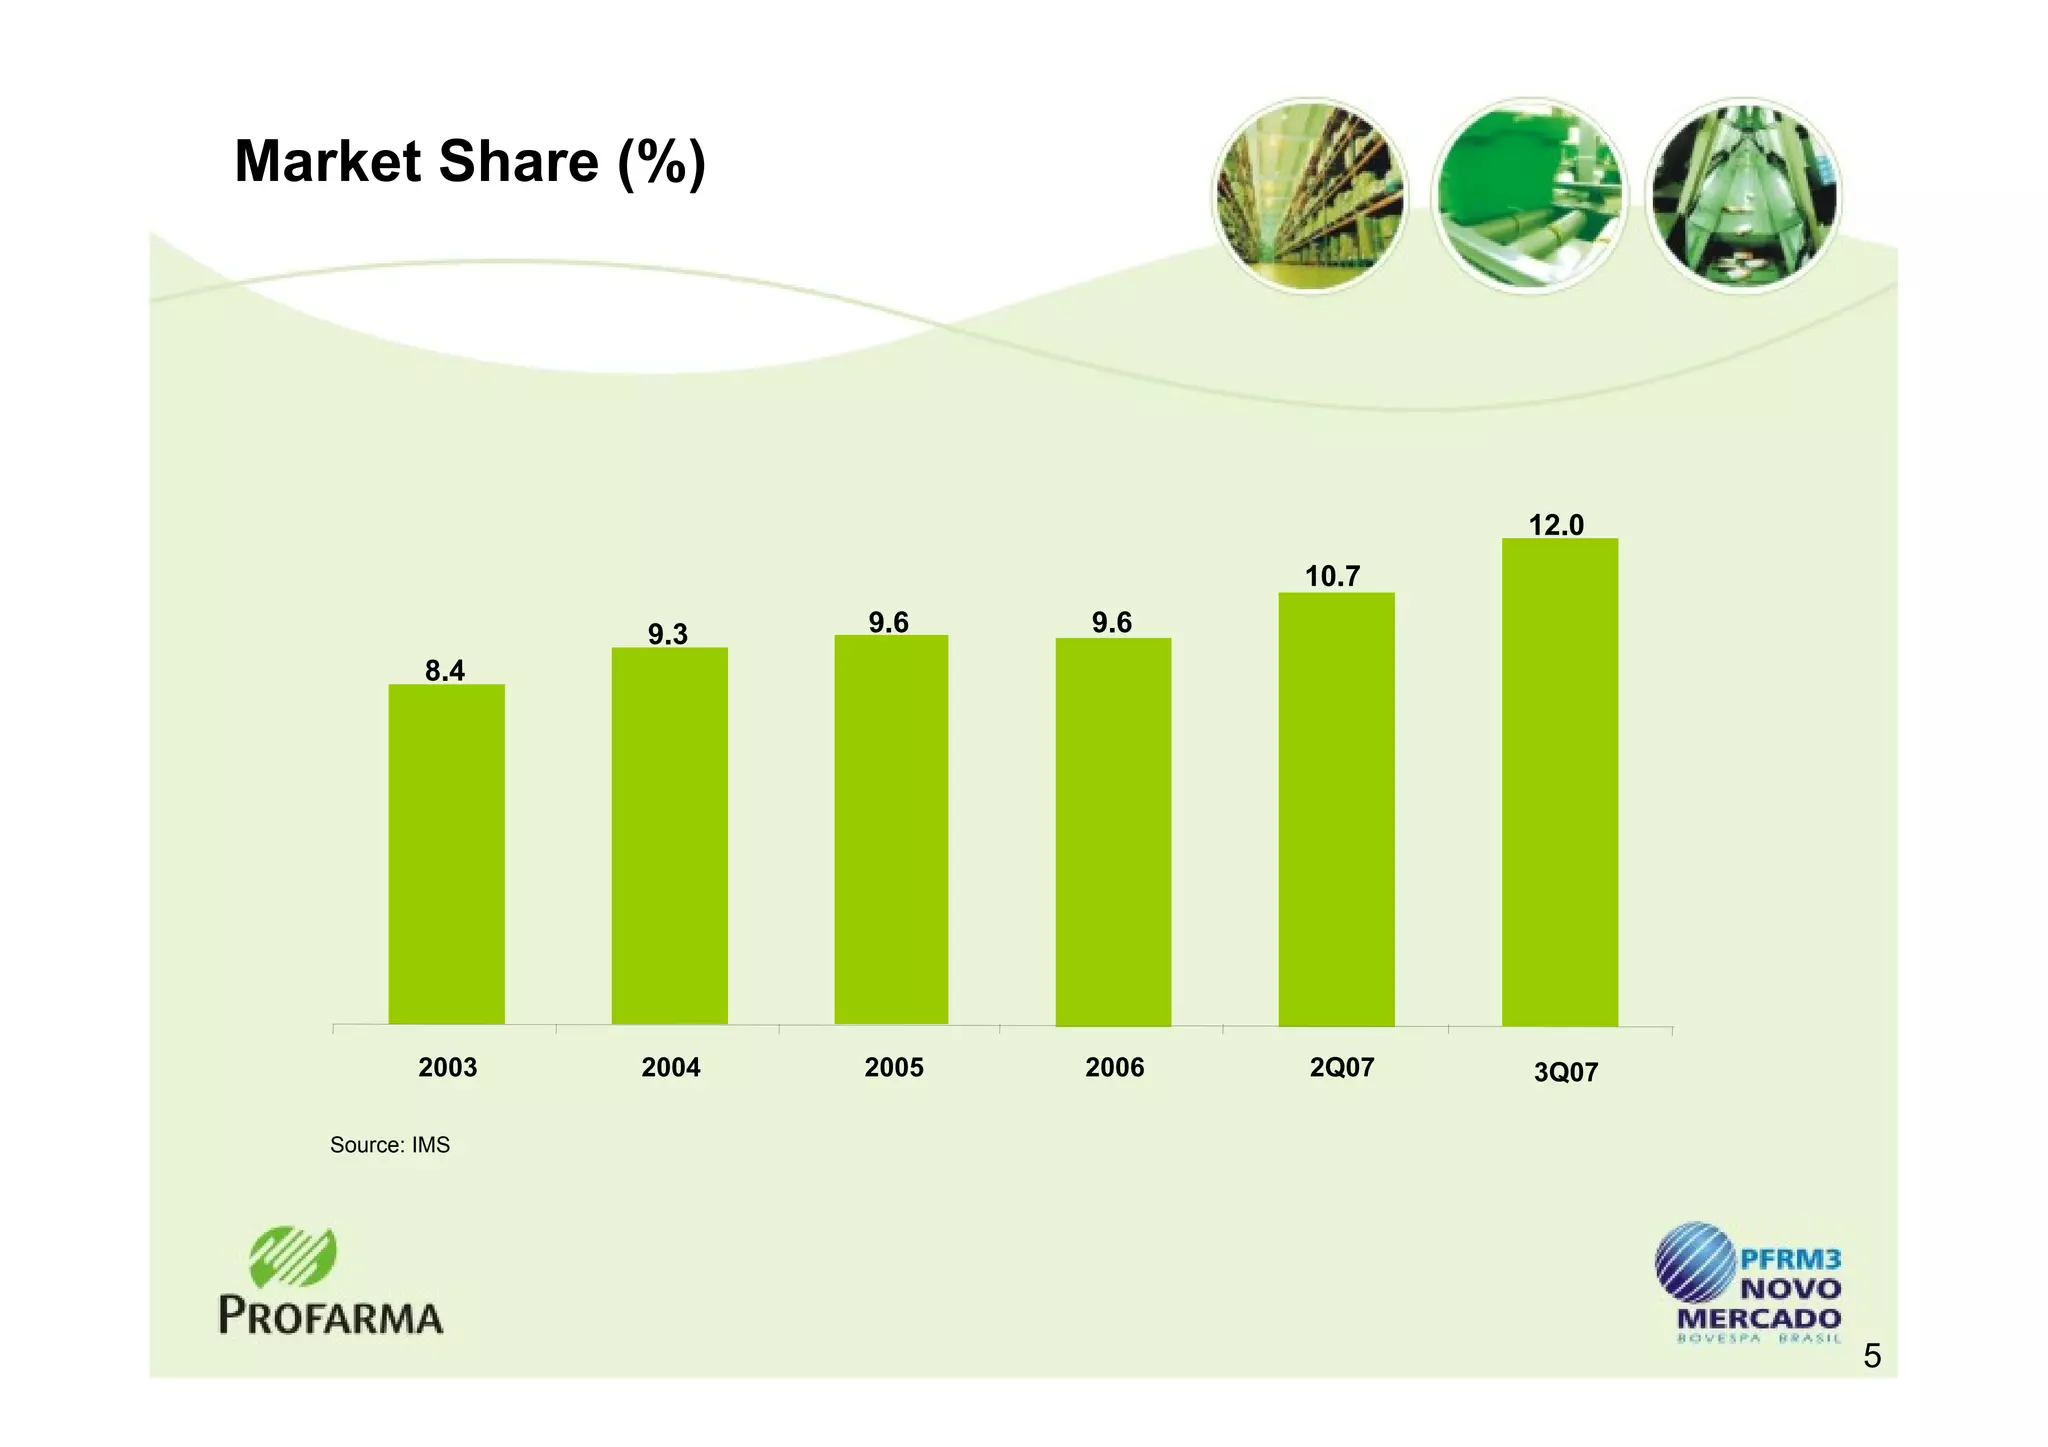
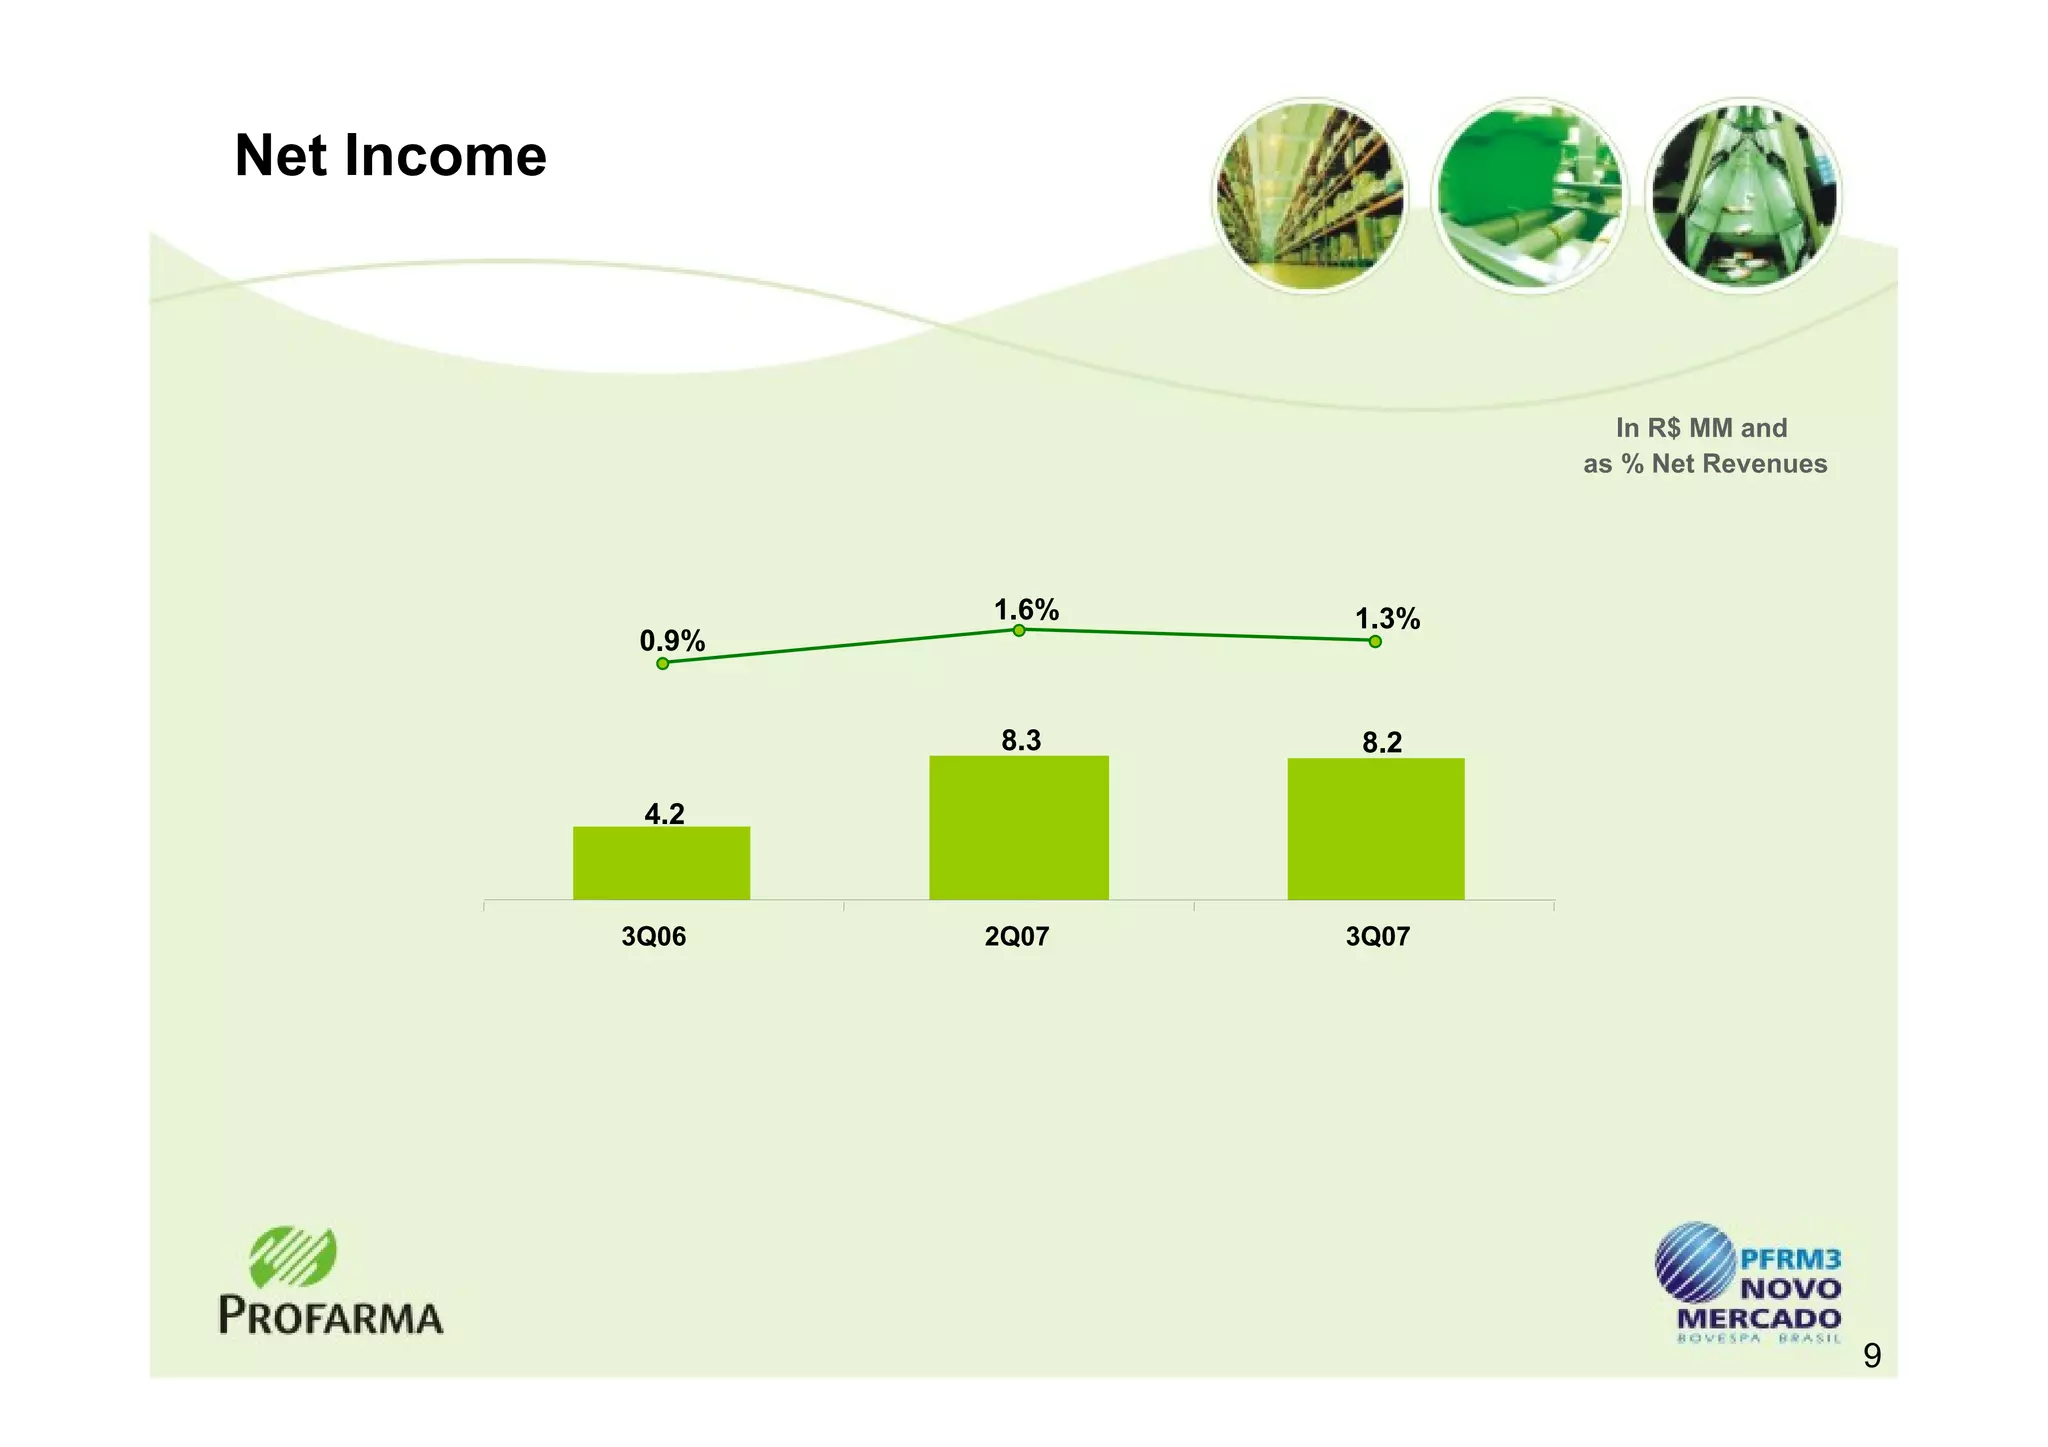
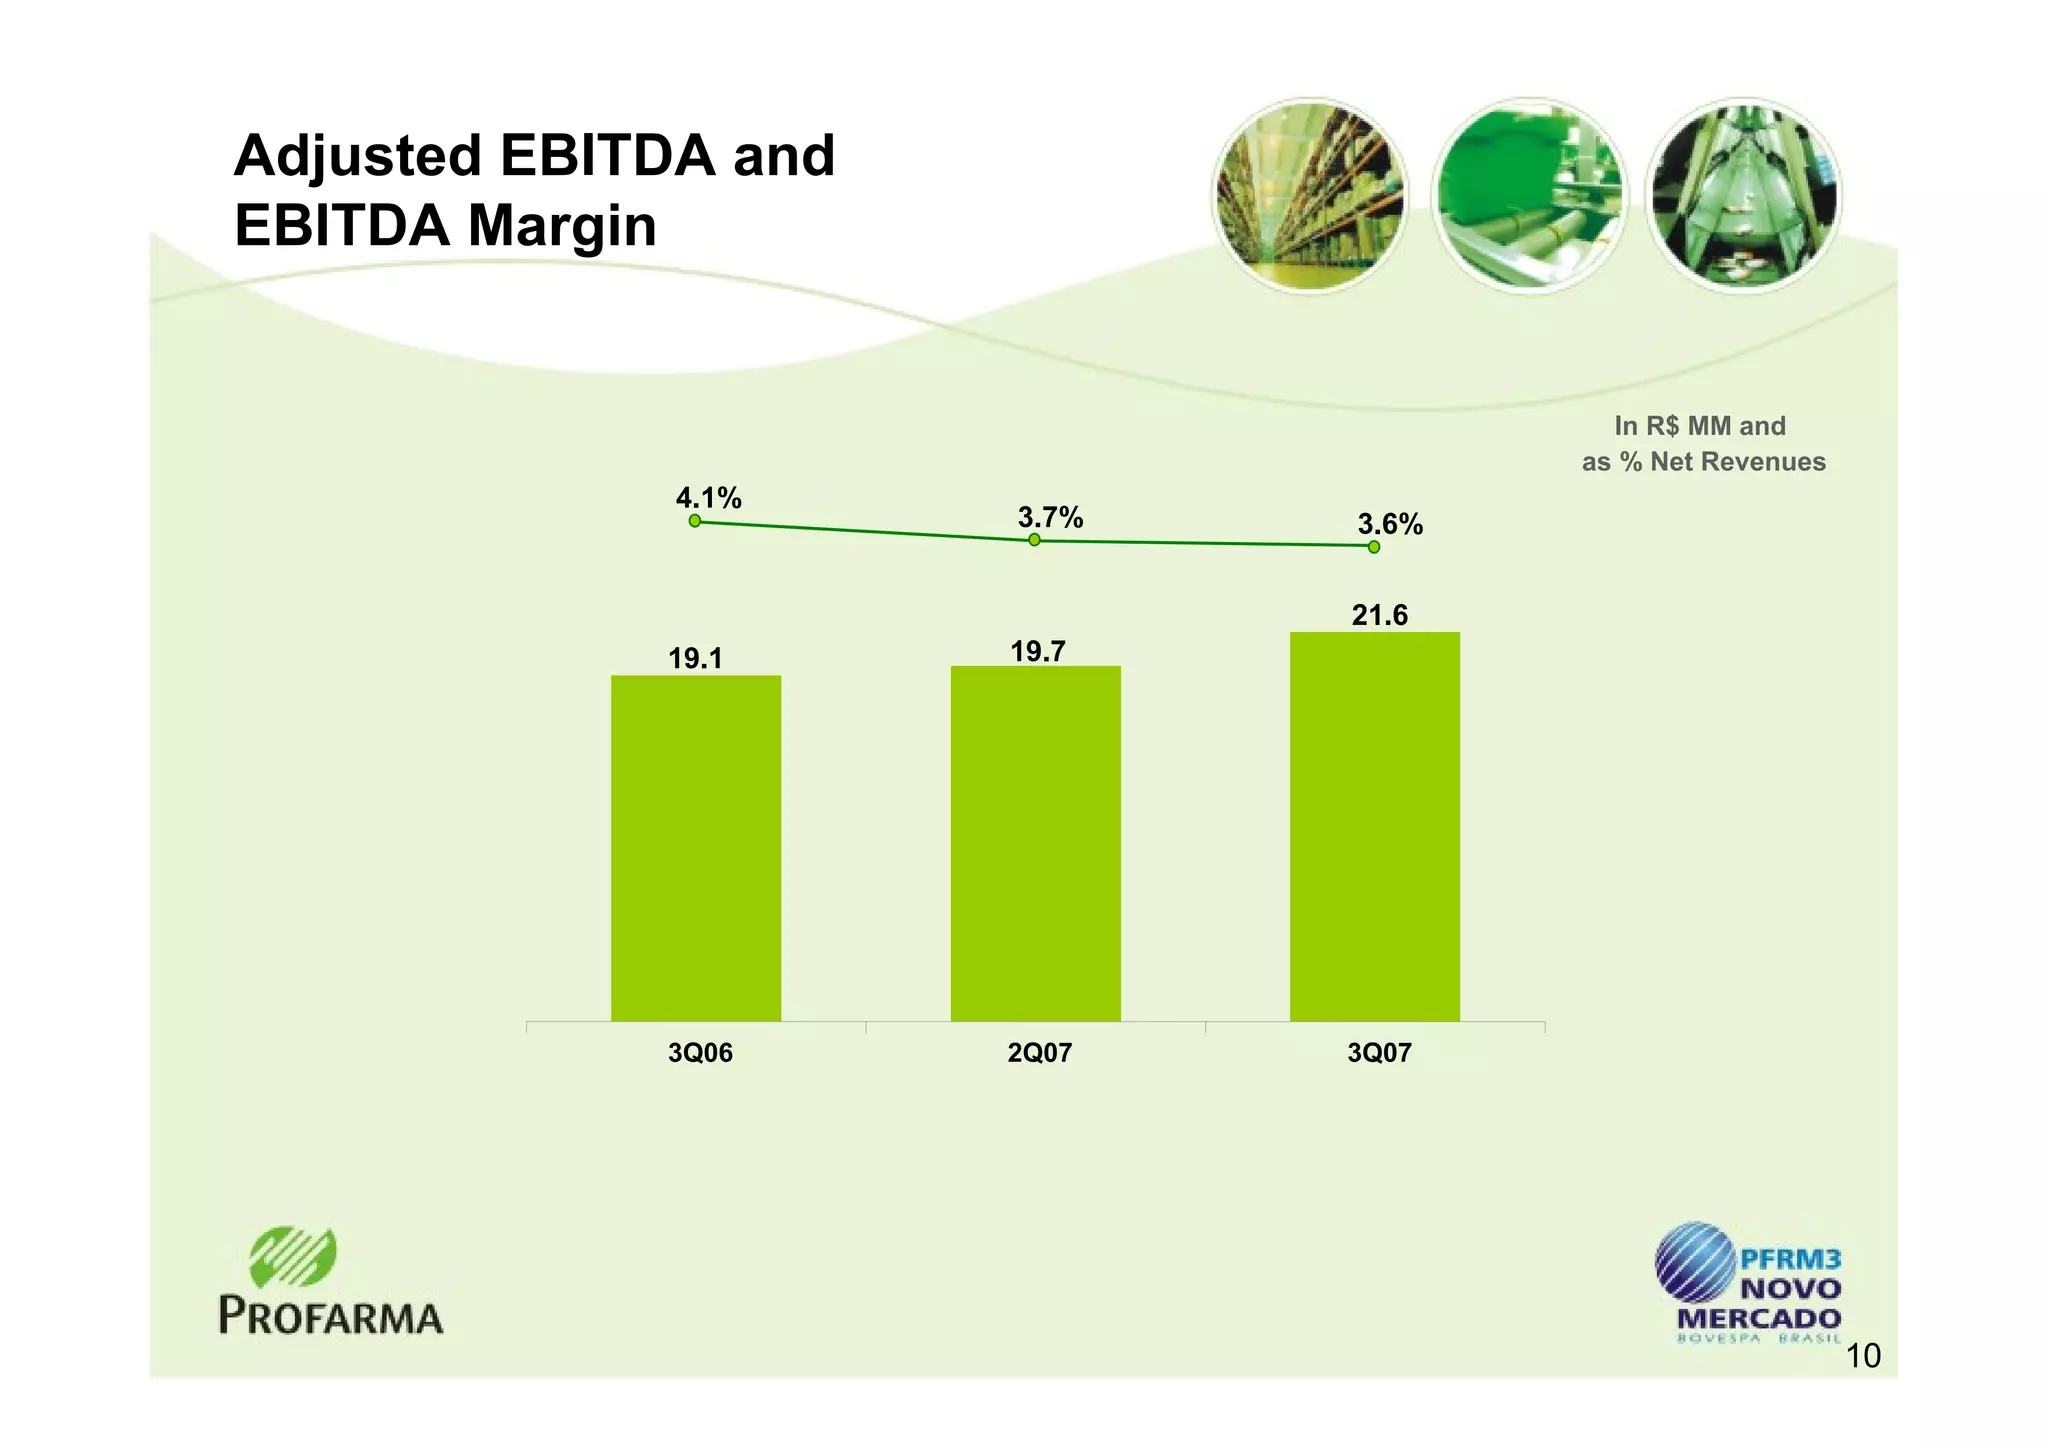

Profarma's market share reached a record 12.0% in 3Q07, with gross revenues growing 31.9% to R$698.2 million compared to 3Q06. Net earnings increased 94.9% to R$8.2 million due to strong sales growth across branded, generic, and OTC products. Adjusted EBITDA was R$21.6 million for 3Q07, a 12.9% increase over 3Q06, demonstrating improved profitability.


