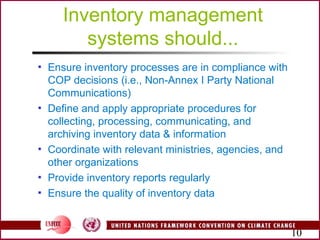
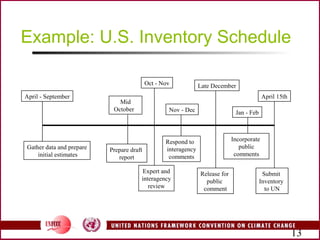
2
CGE Greenhouse Gas Inventory
Hands-on Training Workshop
for the African Region
- Building an Inventory Management System -
Pretoria, South Africa
18-22 September 2006
Michael Gillenwater
3
What is an GHG Inventory
Program for?
▪ Meet international obligations and expectations
▪ Inform international, national, & local policy making
▪ Enhance credibility of national climate policies
through timely, transparent, and effective analysis &
communication
▪ Foster consistent estimation approaches across
government & private sector programs
▪ Respond to requests for information
▪ Champion for high quality & objective inventory
information
4
What is quality?
▪ Transparency
▪ Completeness
▪ Comparability
▪ Consistency
▪ Accuracy
Transparency is the most fundamental. If you
do not document, then there is no way to
demonstrate any of the other principles have
been met.
5
Who cares?
▪ A wide audience of stakeholders...
▪ Decision makers & policy advisors
▪ International climate change community
▪ Provincial & local agencies
▪ The public & interest groups
▪ Businesses
▪ Scientists
6
National government
▪ Are national inventories verifiable?
▪ What are current & projected emissions and
removals from key industries?
▪ What are the effects of existing or planned
policies and measures (including policies that
aggravate emissions)?
▪ Is there consensus among government agencies
and key stakeholders on our emission
estimates?
▪ What are the relationships between reducing
greenhouse gas emissions and other
environmental pollutants?
7
International community
▪ What is the your country’s contribution to
global emissions and removals?
▪ Are your GHG estimates credible and
transparent?
▪ Is your country meeting its UNFCCC
obligations?
8
Scientists
Businesses & NGOs
▪ How do we quantify and get credit for activities that
reduce emissions or sequester carbon?
▪ What activities, industries, companies, or policies
have been responsible for significant increases or
decreases in GHG emissions or removals?
▪ What are the priorities for research and measurement?
▪ What are the scientific uncertainties in the emission and sink
estimates?
Inventory
Program
Trading and projects
Research & international
scientific community
LU/LUCF
(Sinks policies)
Corporate, regional, &
other inventories
Emission projections, climate
& economic modeling
Domestic emission
reduction programs
Negotiations
& IPCC
Interest groups
& the public
Linkages
9
10
▪ Ensure inventory processes are in compliance with
COP decisions (i.e., Non-Annex I Party National
Communications)
▪ Define and apply appropriate procedures for
collecting, processing, communicating, and
archiving inventory data & information
▪ Coordinate with relevant ministries, agencies, and
other organizations
▪ Provide inventory reports regularly
▪ Ensure the quality of inventory data
Inventory management
systems should...
11
Inventory management system
1. Inventory planning
2. Inventory preparation
3. Inventory management
12
Inventory planning
▪ Establish national inventory agency
▪ Assign responsibilities for inventory preparation and
management
▪ Develop schedule
▪ Make arrangements to collect data from statistical
agencies, companies, industry associations, etc.
▪ Create QA/QC plan
▪ Define formal approval process within government
▪ Develop review processes
▪ Integrate continuous improvement
13
Example: U.S. Inventory Schedule
Submit
Inventory
to UN
April 15thApril - September
Gather data and prepare
initial estimates
Jan - Feb
Incorporate
public
comments
Late December
Release for
public
comment
Nov - Dec
Respond to
interagency
comments
Oct - Nov
Expert and
interagency
review
Mid
October
Prepare draft
report
14
Inventory preparation
▪ Identify key categories
▪ Select methods and emission factors
(e.g., GPG decision trees)
▪ Collect activity data
▪ Manage recalculations
▪ Implement QA/QC plan
▪ Basic checks should be completed on entire inventory
(Tier 1) (see GPG Ch. 8)
▪ More in-depth investigations into key sources (Tier 2)
▪ Documentation
15
Key categories
▪ A key category has a significant influence on a
country’s total inventory in terms of level or trend
in emissions (GPG, Ch.7)
▪ A key category may also be determined through
a qualitative assessment.
▪ A key category is one that is prioritized within the
national inventory system
▪ In general, countries should focus on key
categories for resources and improvements
16
Inventory management
▪ Implement inventory review processes (e.g., expert
review, public review)
▪ Obtain formal approval of final results and report
within government
▪ Submit report to UNFCCC
▪ Make inventory information available to stakeholders
and respond to information requests
▪ Archive all documentation and results
▪ Continuous improvement feedback
17
Uncertainty
▪ Uncertainty analysis is a subjective exercise, as
it relies to a large extent on expert judgment
▪ Therefore, it is not a valid basis to compare
inventories between countries
▪ Uncertainty analysis should be used as a way to
investigate the quality of your inventory data and
identify ways to improve data quality
▪ You achieve by communicating with data
suppliers (e.g., statistical agencies)
Uncertainty investigations should be integrated
within your QA/QC plan!
18
Resources
▪ IPCC Guidelines
▪ Revised 1996 IPCC Guidelines
▪ IPCC Good Practice Guidance
▪ IPCC LULUCF GPG
▪ New 2006 IPCC Guidelines
▪ UNFCCC reporting guidelines
▪ IPCC Emission Factor Database (EFDB)
▪ IPCC software
▪ NCSP booklet on "Managing the GHG inventories
process (March 2005)
19
Other resources…
▪Inventory reports from other
Parties
UNFCCC website/GHG Data
www.unfccc.int
▪Inventory related reports from
other Parties
▪GHG Inventory Experts Network
www.ghgnetwork.org
20
Closing remarks…
▪ A greenhouse gas inventory is more than just a
report. It should be viewed as an broader
analytical program.
▪ A “cookbook” approach to developing a GHG
inventory is not practical. There will always be a
large and essential need for expert judgment at
all levels of the process.
▪ A well constructed inventory should include
enough documentation to allow readers to
understand the underlying assumptions and to
reconstruct the calculations.
21
Please feel free to email me in
the future:
Michael Gillenwater
gillenwater@alum.mit.edu
– Thank you –
22
ACTIVITY DATA
ENERGY
US EPA
Energy Use
EIA, Dept. of
Energy
Bureau of
Transportation
Statistics, Dept. of
Transportation
Bureau of Economic
Analysis, Dept. of
Commerce
Bureau of the
Census, Dept.
of Commerce
Petroleum and Natural Gas
Industry Associations, Trade
Groups, and Review PanelsUS EPA, National Risk
Research Management
Research Laboratory
Industry
Journals
Department of
Defense
Minerals
Management
Service, Dept. of
Interior
International
Bunker Fuels
The EIA collects national and
worldwide fuel production and
consumption data for all energy-
related activities, including
stationary combustion.
The EIA publishes a variety of
monthly and annual reports and
maintains databases which are
accessible via the Web.
Provide mine-specific
historical information
about methane gas-
recovery and gas
usage.
State Petroleum and
Natural Gas
Agencies
Mine Safety and
Health Administration
Mining
Companies
Supply information about
mine-specific ventialtion
systems and gas sales
data.
to US
EPA
The DoD maintains data
on fuel consumption for
the military. Data is
usually acquired via
communications with
each branch.
Center for Transportation
Analysis, ORNL, Dept. of
Energy
Federal Highway
Administration
Federal Aviation
Administration
Compile data on vehicle numbers
and types and provide estimates for
domestic transportation fuel
consumption.
to US
EPA
Collect data on transportation
fuel combustion, including fuel
consumed by jets and sailing
vessels travelling
internationally.
Coal Mining
Provide information about
natural gas and petroleum
industries, including
production, infrastructure
statistics, and consumption.
Mobile
Combustion
Petroleum
and Natural
Gas
EPA
Flow of
Energy
Data
23
Emission Inventory Basics
▪ An emission inventory is an accounting of the amount
of air pollutants discharged into the atmosphere. It is
generally characterized by the following factors:
▪ The chemical or physical identity of the pollutants
included
▪ The geographic area covered
▪ The institutional entities covered
▪ The time period over which emissions are
estimated
▪ The types of activities that cause emissions
24
Inventory Agency
Responsibilities
▪ A single national entity to be responsible for the overall
inventory
▪ Arrangements with collaborating entities that contribute data,
research, estimate emissions or provide expert reviews
▪ Define legal authority to collect and disseminate data
necessary for the preparation of the inventory
▪ Ensure inventory processes are in compliance with COP
decisions
▪ Define and apply procedures for collecting data, preparing
inventory, communicating results, submitting report, and
archiving
▪ Liaise among government departments, national agencies,
▪ Ensure the implementation of QA/QC
25
Goals
 Develop high quality inventory at regular intervals (e.g.,
annually, every 2-4 years, etc).
 Resources are focused on the most significant
emission sources in the country
26
Atmospheric Concentrations
Source: CDIAC
270
290
310
330
350
370
1740 1790 1840 1890 1940 1990
ppmv
Keeling and Whorf, 1999
Mauna Loa, Hawaii
Neftel, et al., 1994.
Siple Station ice core
CO2
700
900
1,100
1,300
1,500
1,700
1830 1870 1910 1950 1990
ppbv
Kalil and Rasmussen, 1994.
Record from six globally
distributed locations.
Etheridge, Pearman,
and Fraiser, 1994.
Law Dome ice core.
CH4
0
1
2
3
4
1965 1970 1975 1980 1985 1990 1995 2000
pptv
Sturges et al.,
Dome Concordia, 2000
SF6

Inventory management system

  • 2.
    2 CGE Greenhouse GasInventory Hands-on Training Workshop for the African Region - Building an Inventory Management System - Pretoria, South Africa 18-22 September 2006 Michael Gillenwater
  • 3.
    3 What is anGHG Inventory Program for? ▪ Meet international obligations and expectations ▪ Inform international, national, & local policy making ▪ Enhance credibility of national climate policies through timely, transparent, and effective analysis & communication ▪ Foster consistent estimation approaches across government & private sector programs ▪ Respond to requests for information ▪ Champion for high quality & objective inventory information
  • 4.
    4 What is quality? ▪Transparency ▪ Completeness ▪ Comparability ▪ Consistency ▪ Accuracy Transparency is the most fundamental. If you do not document, then there is no way to demonstrate any of the other principles have been met.
  • 5.
    5 Who cares? ▪ Awide audience of stakeholders... ▪ Decision makers & policy advisors ▪ International climate change community ▪ Provincial & local agencies ▪ The public & interest groups ▪ Businesses ▪ Scientists
  • 6.
    6 National government ▪ Arenational inventories verifiable? ▪ What are current & projected emissions and removals from key industries? ▪ What are the effects of existing or planned policies and measures (including policies that aggravate emissions)? ▪ Is there consensus among government agencies and key stakeholders on our emission estimates? ▪ What are the relationships between reducing greenhouse gas emissions and other environmental pollutants?
  • 7.
    7 International community ▪ Whatis the your country’s contribution to global emissions and removals? ▪ Are your GHG estimates credible and transparent? ▪ Is your country meeting its UNFCCC obligations?
  • 8.
    8 Scientists Businesses & NGOs ▪How do we quantify and get credit for activities that reduce emissions or sequester carbon? ▪ What activities, industries, companies, or policies have been responsible for significant increases or decreases in GHG emissions or removals? ▪ What are the priorities for research and measurement? ▪ What are the scientific uncertainties in the emission and sink estimates?
  • 9.
    Inventory Program Trading and projects Research& international scientific community LU/LUCF (Sinks policies) Corporate, regional, & other inventories Emission projections, climate & economic modeling Domestic emission reduction programs Negotiations & IPCC Interest groups & the public Linkages 9
  • 10.
    10 ▪ Ensure inventoryprocesses are in compliance with COP decisions (i.e., Non-Annex I Party National Communications) ▪ Define and apply appropriate procedures for collecting, processing, communicating, and archiving inventory data & information ▪ Coordinate with relevant ministries, agencies, and other organizations ▪ Provide inventory reports regularly ▪ Ensure the quality of inventory data Inventory management systems should...
  • 11.
    11 Inventory management system 1.Inventory planning 2. Inventory preparation 3. Inventory management
  • 12.
    12 Inventory planning ▪ Establishnational inventory agency ▪ Assign responsibilities for inventory preparation and management ▪ Develop schedule ▪ Make arrangements to collect data from statistical agencies, companies, industry associations, etc. ▪ Create QA/QC plan ▪ Define formal approval process within government ▪ Develop review processes ▪ Integrate continuous improvement
  • 13.
    13 Example: U.S. InventorySchedule Submit Inventory to UN April 15thApril - September Gather data and prepare initial estimates Jan - Feb Incorporate public comments Late December Release for public comment Nov - Dec Respond to interagency comments Oct - Nov Expert and interagency review Mid October Prepare draft report
  • 14.
    14 Inventory preparation ▪ Identifykey categories ▪ Select methods and emission factors (e.g., GPG decision trees) ▪ Collect activity data ▪ Manage recalculations ▪ Implement QA/QC plan ▪ Basic checks should be completed on entire inventory (Tier 1) (see GPG Ch. 8) ▪ More in-depth investigations into key sources (Tier 2) ▪ Documentation
  • 15.
    15 Key categories ▪ Akey category has a significant influence on a country’s total inventory in terms of level or trend in emissions (GPG, Ch.7) ▪ A key category may also be determined through a qualitative assessment. ▪ A key category is one that is prioritized within the national inventory system ▪ In general, countries should focus on key categories for resources and improvements
  • 16.
    16 Inventory management ▪ Implementinventory review processes (e.g., expert review, public review) ▪ Obtain formal approval of final results and report within government ▪ Submit report to UNFCCC ▪ Make inventory information available to stakeholders and respond to information requests ▪ Archive all documentation and results ▪ Continuous improvement feedback
  • 17.
    17 Uncertainty ▪ Uncertainty analysisis a subjective exercise, as it relies to a large extent on expert judgment ▪ Therefore, it is not a valid basis to compare inventories between countries ▪ Uncertainty analysis should be used as a way to investigate the quality of your inventory data and identify ways to improve data quality ▪ You achieve by communicating with data suppliers (e.g., statistical agencies) Uncertainty investigations should be integrated within your QA/QC plan!
  • 18.
    18 Resources ▪ IPCC Guidelines ▪Revised 1996 IPCC Guidelines ▪ IPCC Good Practice Guidance ▪ IPCC LULUCF GPG ▪ New 2006 IPCC Guidelines ▪ UNFCCC reporting guidelines ▪ IPCC Emission Factor Database (EFDB) ▪ IPCC software ▪ NCSP booklet on "Managing the GHG inventories process (March 2005)
  • 19.
    19 Other resources… ▪Inventory reportsfrom other Parties UNFCCC website/GHG Data www.unfccc.int ▪Inventory related reports from other Parties ▪GHG Inventory Experts Network www.ghgnetwork.org
  • 20.
    20 Closing remarks… ▪ Agreenhouse gas inventory is more than just a report. It should be viewed as an broader analytical program. ▪ A “cookbook” approach to developing a GHG inventory is not practical. There will always be a large and essential need for expert judgment at all levels of the process. ▪ A well constructed inventory should include enough documentation to allow readers to understand the underlying assumptions and to reconstruct the calculations.
  • 21.
    21 Please feel freeto email me in the future: Michael Gillenwater gillenwater@alum.mit.edu – Thank you –
  • 22.
    22 ACTIVITY DATA ENERGY US EPA EnergyUse EIA, Dept. of Energy Bureau of Transportation Statistics, Dept. of Transportation Bureau of Economic Analysis, Dept. of Commerce Bureau of the Census, Dept. of Commerce Petroleum and Natural Gas Industry Associations, Trade Groups, and Review PanelsUS EPA, National Risk Research Management Research Laboratory Industry Journals Department of Defense Minerals Management Service, Dept. of Interior International Bunker Fuels The EIA collects national and worldwide fuel production and consumption data for all energy- related activities, including stationary combustion. The EIA publishes a variety of monthly and annual reports and maintains databases which are accessible via the Web. Provide mine-specific historical information about methane gas- recovery and gas usage. State Petroleum and Natural Gas Agencies Mine Safety and Health Administration Mining Companies Supply information about mine-specific ventialtion systems and gas sales data. to US EPA The DoD maintains data on fuel consumption for the military. Data is usually acquired via communications with each branch. Center for Transportation Analysis, ORNL, Dept. of Energy Federal Highway Administration Federal Aviation Administration Compile data on vehicle numbers and types and provide estimates for domestic transportation fuel consumption. to US EPA Collect data on transportation fuel combustion, including fuel consumed by jets and sailing vessels travelling internationally. Coal Mining Provide information about natural gas and petroleum industries, including production, infrastructure statistics, and consumption. Mobile Combustion Petroleum and Natural Gas EPA Flow of Energy Data
  • 23.
    23 Emission Inventory Basics ▪An emission inventory is an accounting of the amount of air pollutants discharged into the atmosphere. It is generally characterized by the following factors: ▪ The chemical or physical identity of the pollutants included ▪ The geographic area covered ▪ The institutional entities covered ▪ The time period over which emissions are estimated ▪ The types of activities that cause emissions
  • 24.
    24 Inventory Agency Responsibilities ▪ Asingle national entity to be responsible for the overall inventory ▪ Arrangements with collaborating entities that contribute data, research, estimate emissions or provide expert reviews ▪ Define legal authority to collect and disseminate data necessary for the preparation of the inventory ▪ Ensure inventory processes are in compliance with COP decisions ▪ Define and apply procedures for collecting data, preparing inventory, communicating results, submitting report, and archiving ▪ Liaise among government departments, national agencies, ▪ Ensure the implementation of QA/QC
  • 25.
    25 Goals  Develop highquality inventory at regular intervals (e.g., annually, every 2-4 years, etc).  Resources are focused on the most significant emission sources in the country
  • 26.
    26 Atmospheric Concentrations Source: CDIAC 270 290 310 330 350 370 17401790 1840 1890 1940 1990 ppmv Keeling and Whorf, 1999 Mauna Loa, Hawaii Neftel, et al., 1994. Siple Station ice core CO2 700 900 1,100 1,300 1,500 1,700 1830 1870 1910 1950 1990 ppbv Kalil and Rasmussen, 1994. Record from six globally distributed locations. Etheridge, Pearman, and Fraiser, 1994. Law Dome ice core. CH4 0 1 2 3 4 1965 1970 1975 1980 1985 1990 1995 2000 pptv Sturges et al., Dome Concordia, 2000 SF6

Editor's Notes

  • #2 If you think your job is difficult… This is what folks think of greenhouse gas inventory reports back in the United States.
  • #3 Welcome. Suggest trainees to ask questions during presentation.
  • #5 <number>
  • #10 I call this, we are the center of the universe slide
  • #14 <number>
  • #23 <number> On this slide, we are attempting to illustrate the complexity of the information web that underlies our system of gathering data from primary producers and key sources, and then the steps the data goes through before we develop a complete accounting of energy use. The blue ovals represent key sources of information, whether it be a federal agency, national lab, research center, or trade association. The white boxes describe the types of data that is being handled. This slide is only portraying energy related data - this is duplicated for every other category. It is unfortunately the case that although other categories may represent smaller portions of our total emissions, the complexity and level of effort may not be proportionate to the size of emissions. Source categories like agricultural soils, waste handling, and industrial sources are very data intensive.
  • #24 <number>
  • #25 <number>
  • #26 <number>