Download to read offline


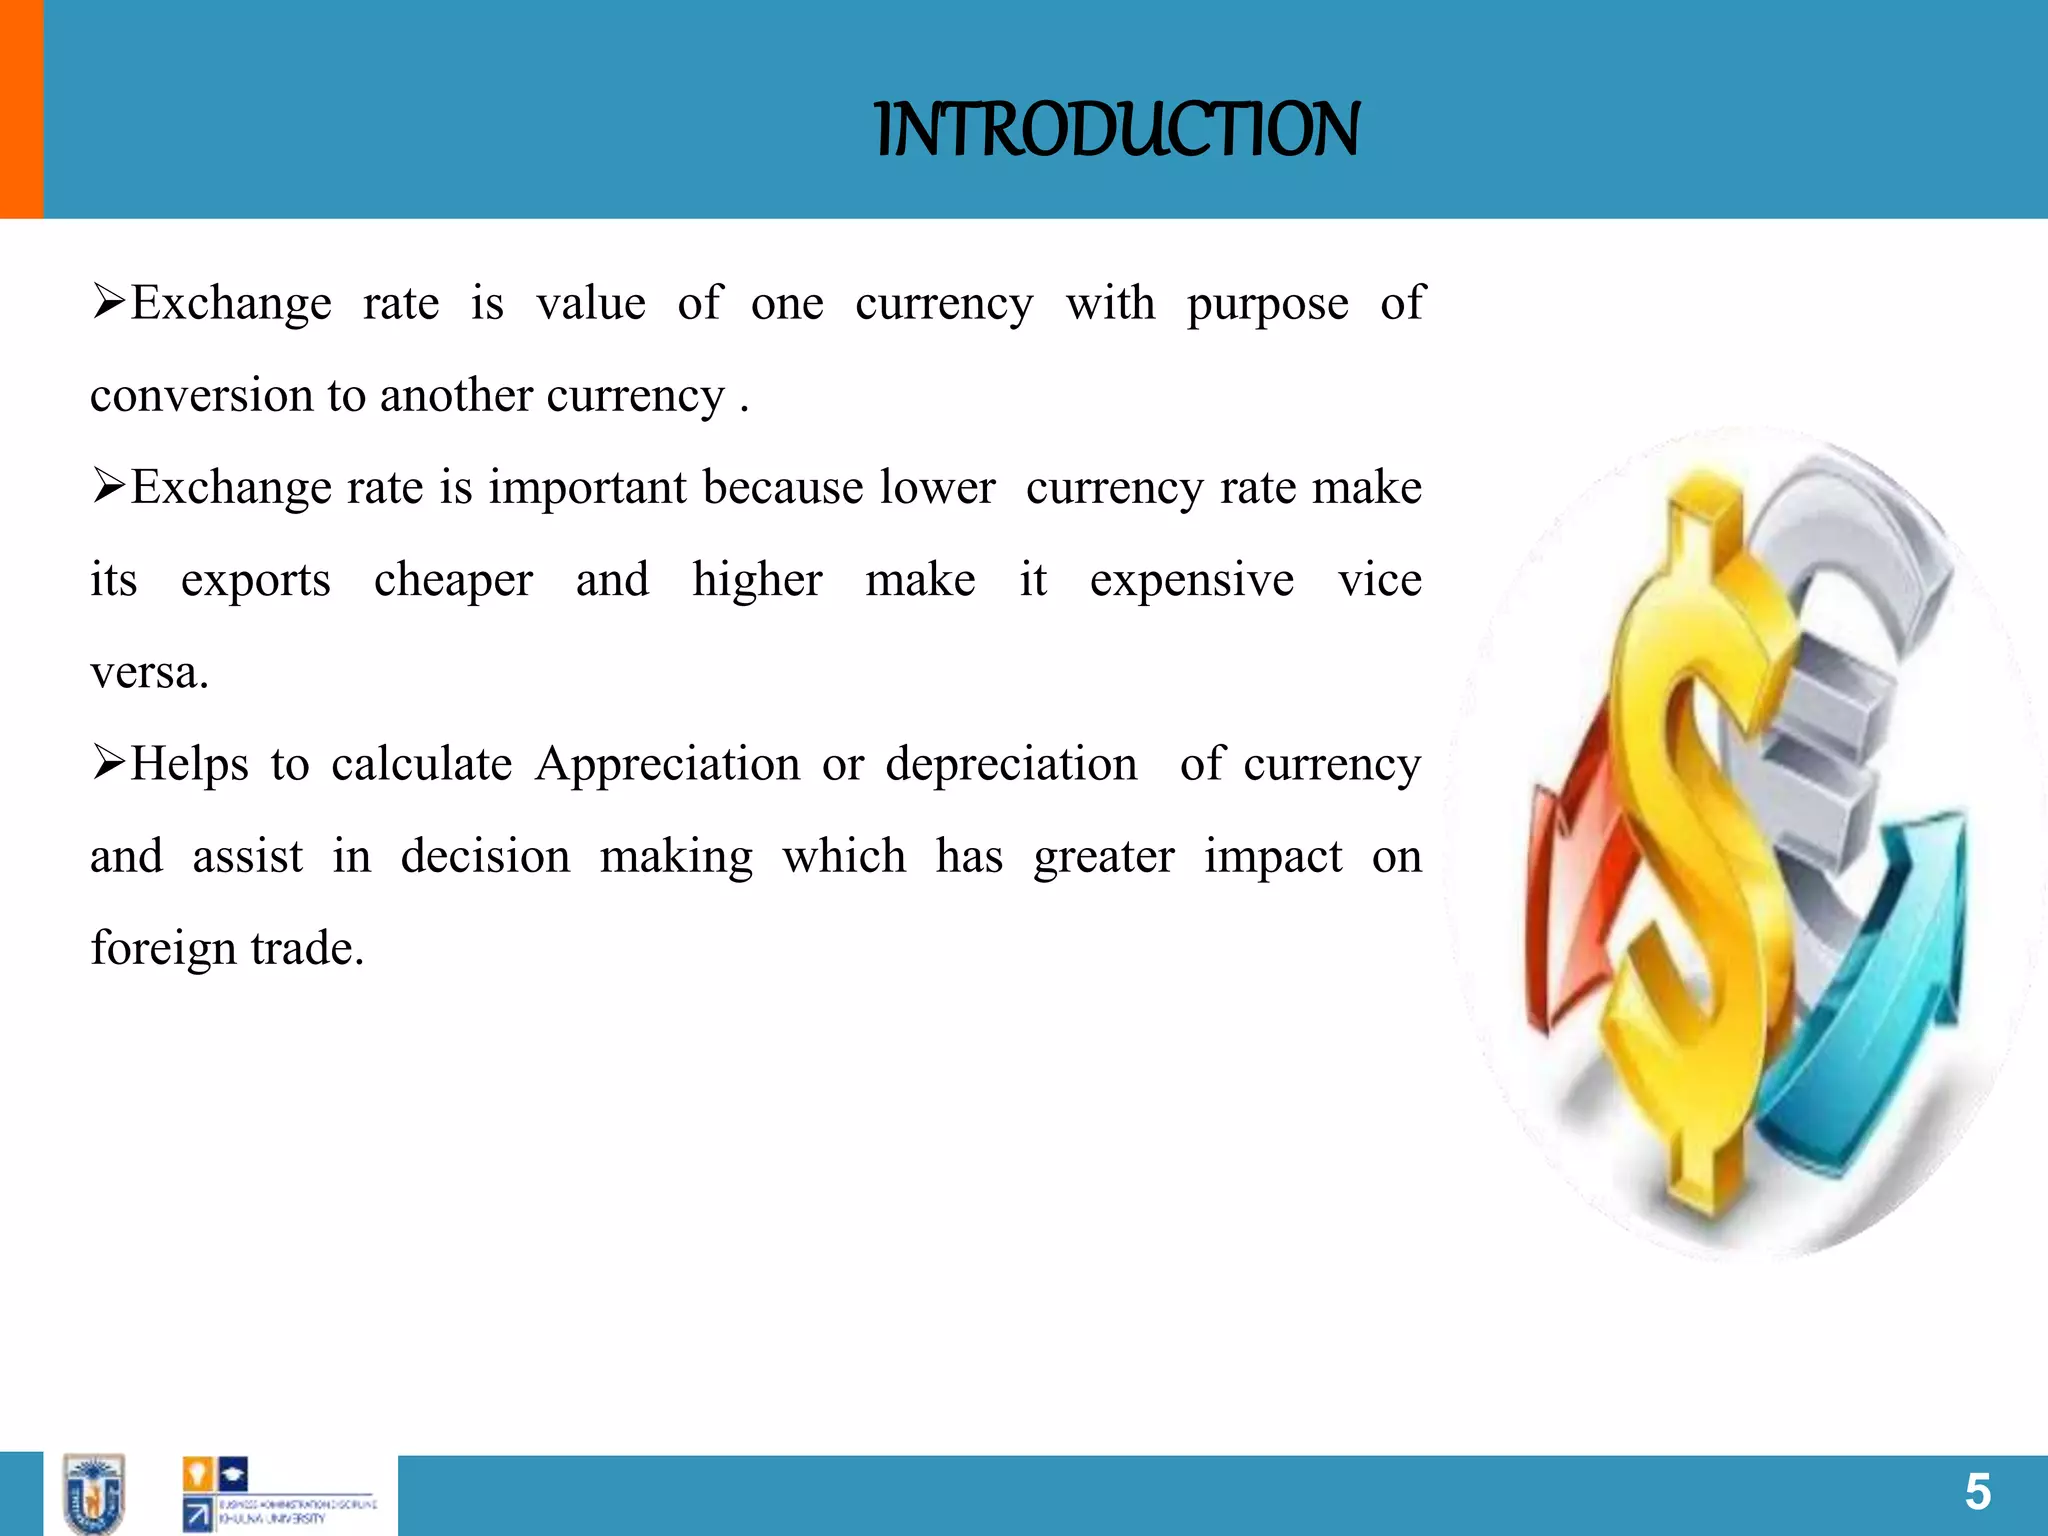


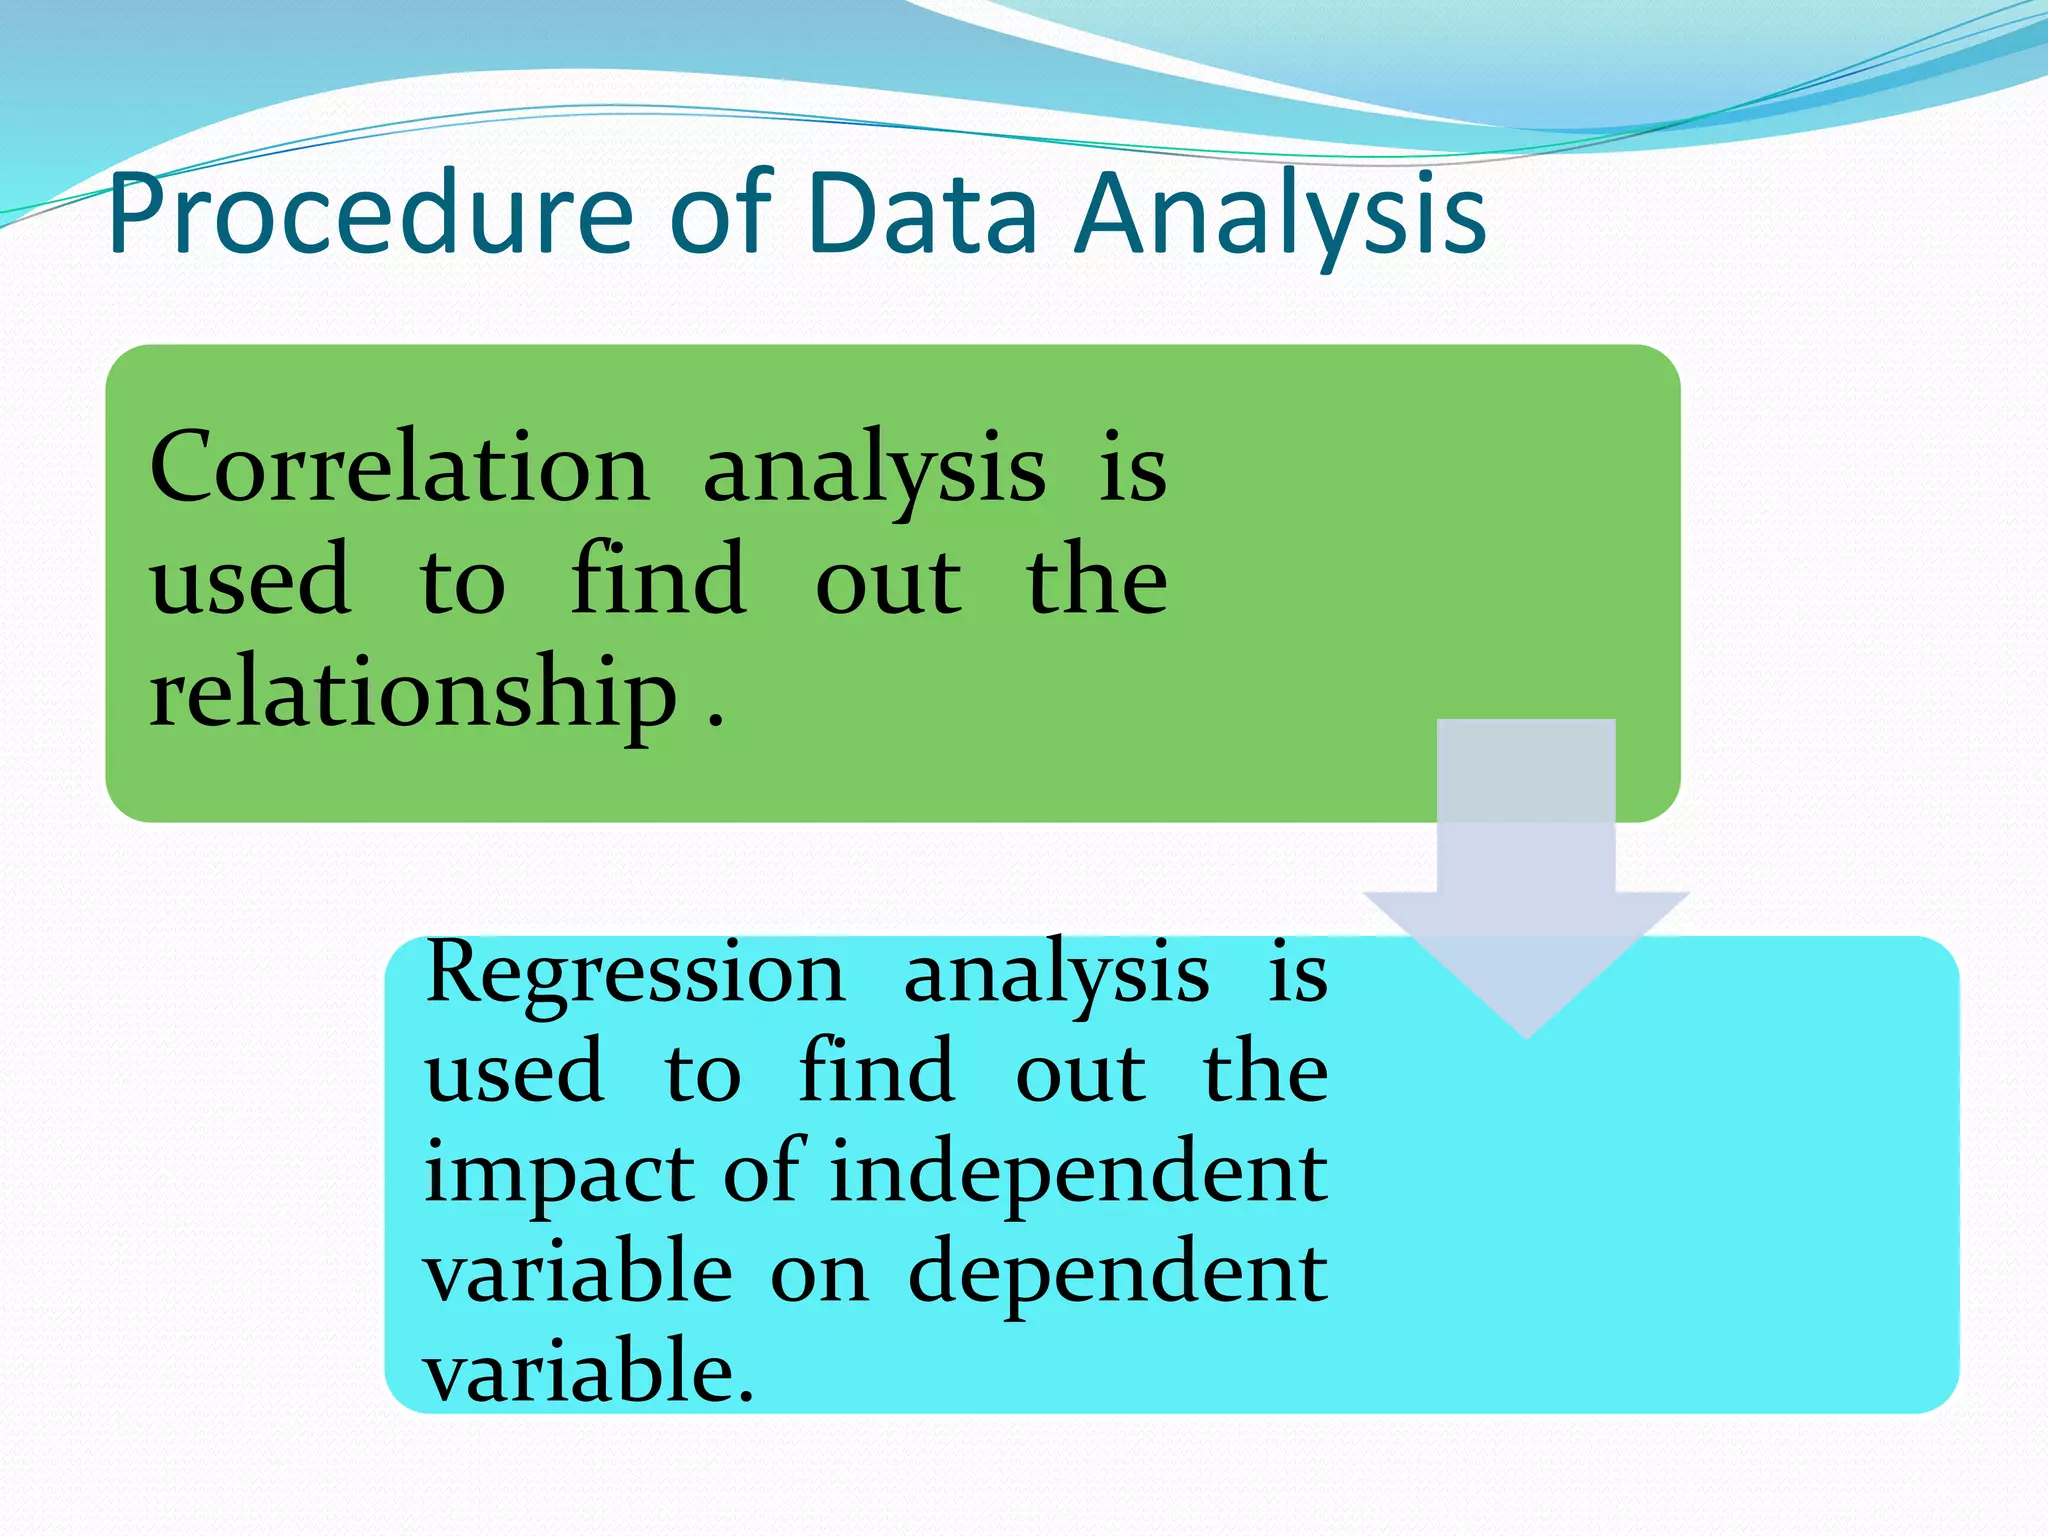

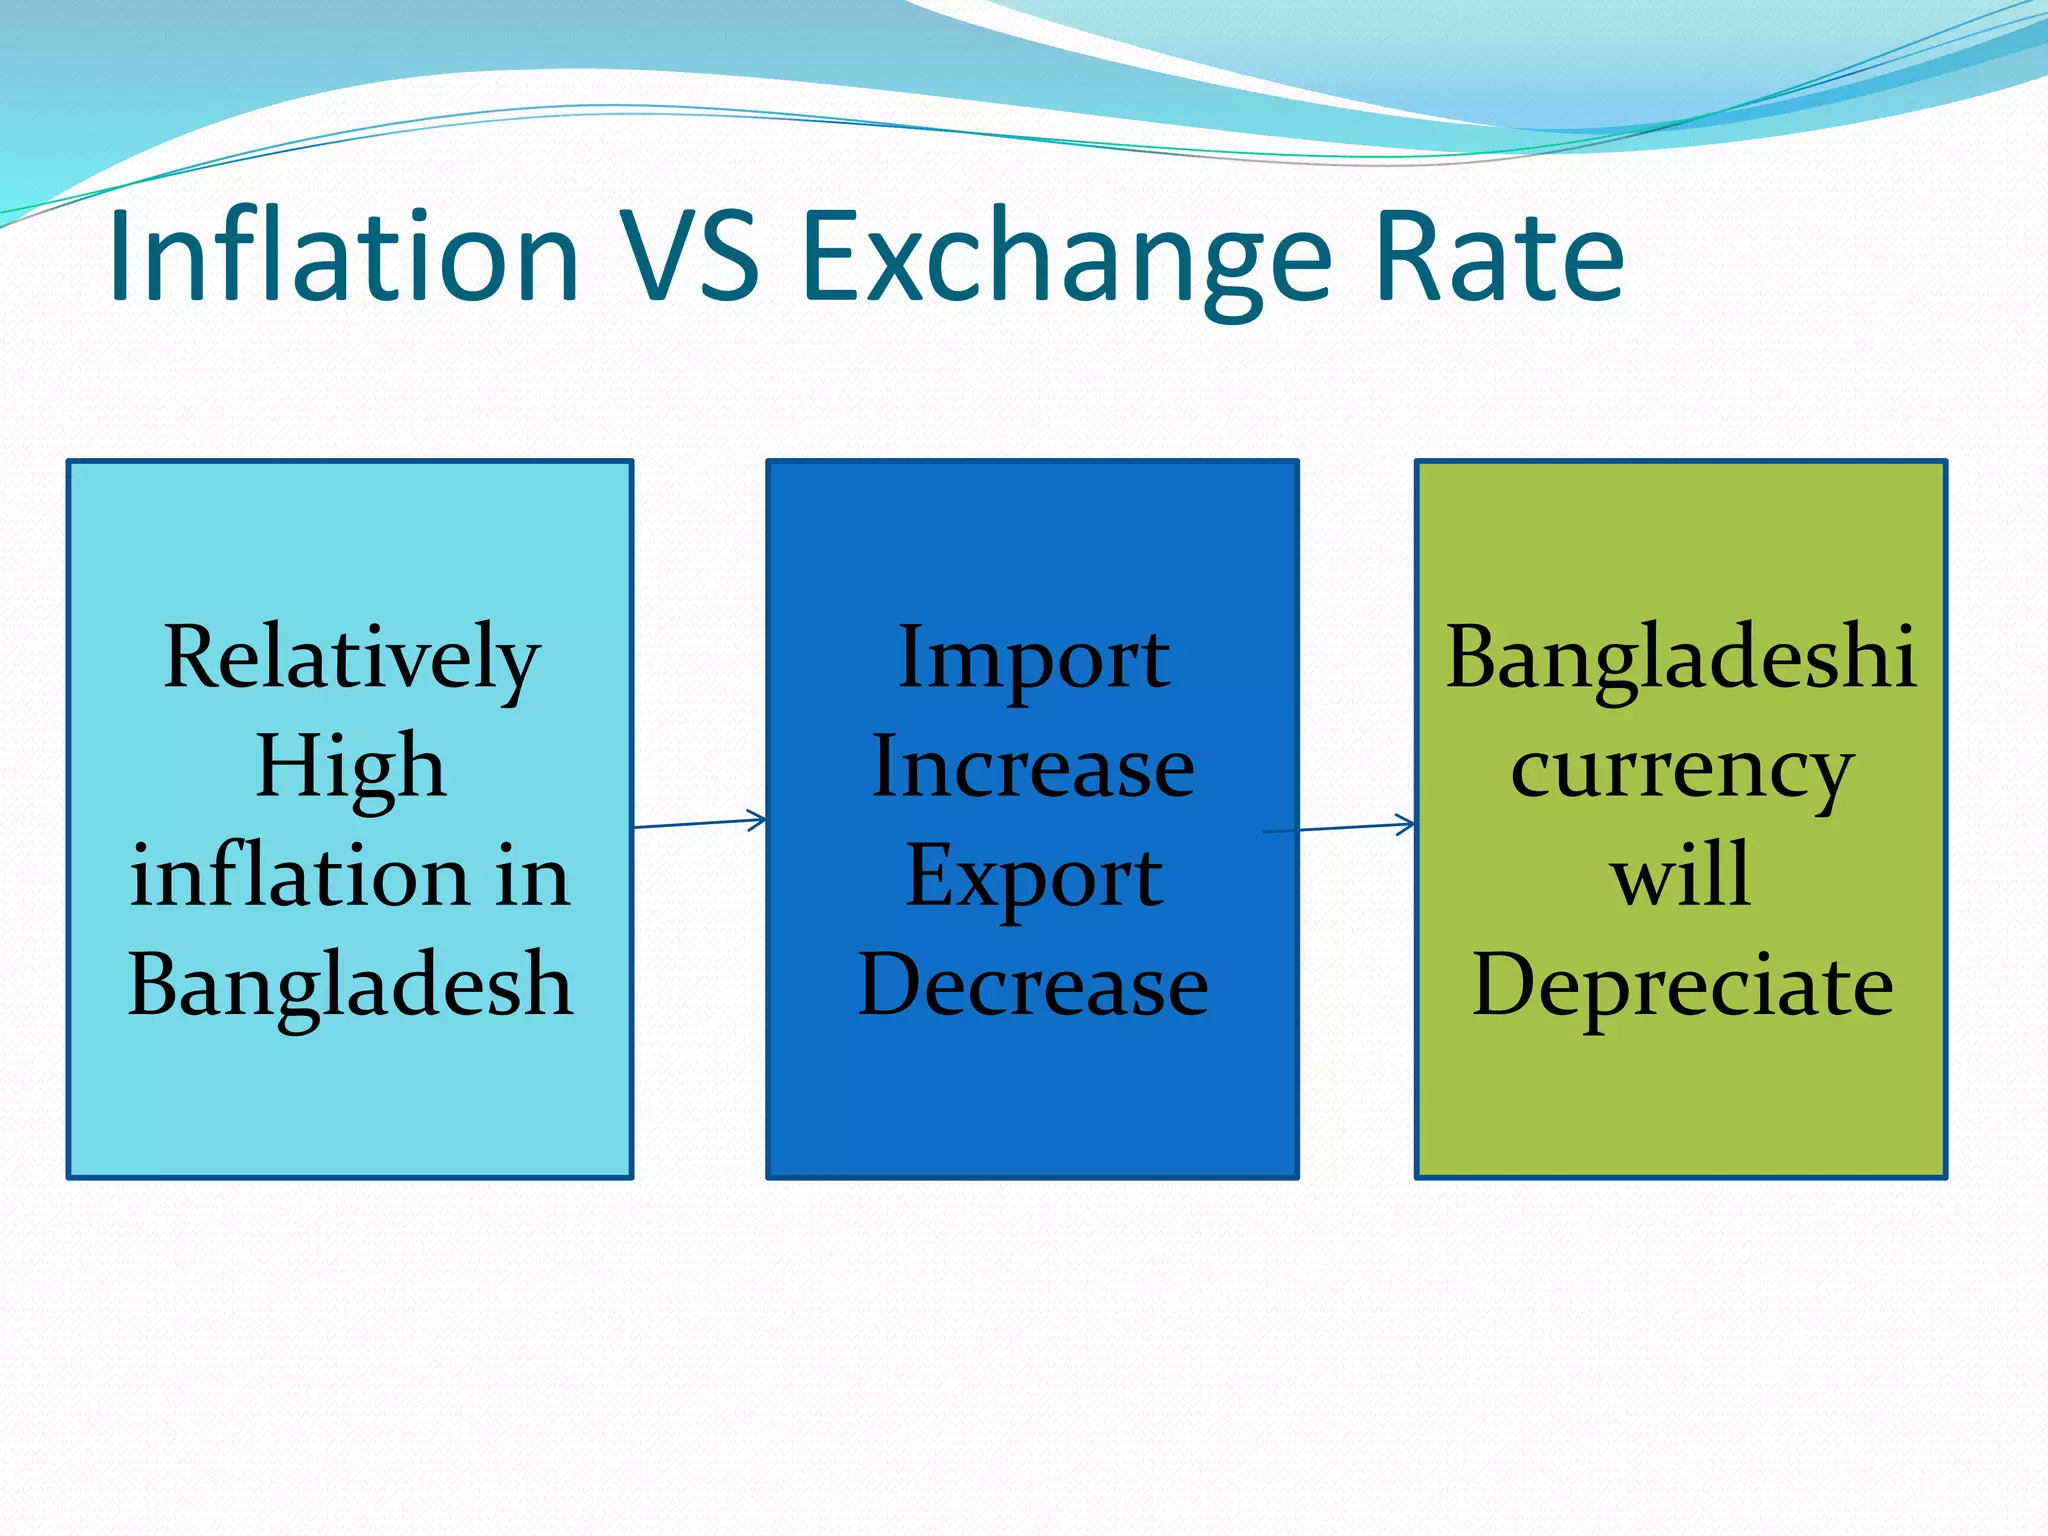
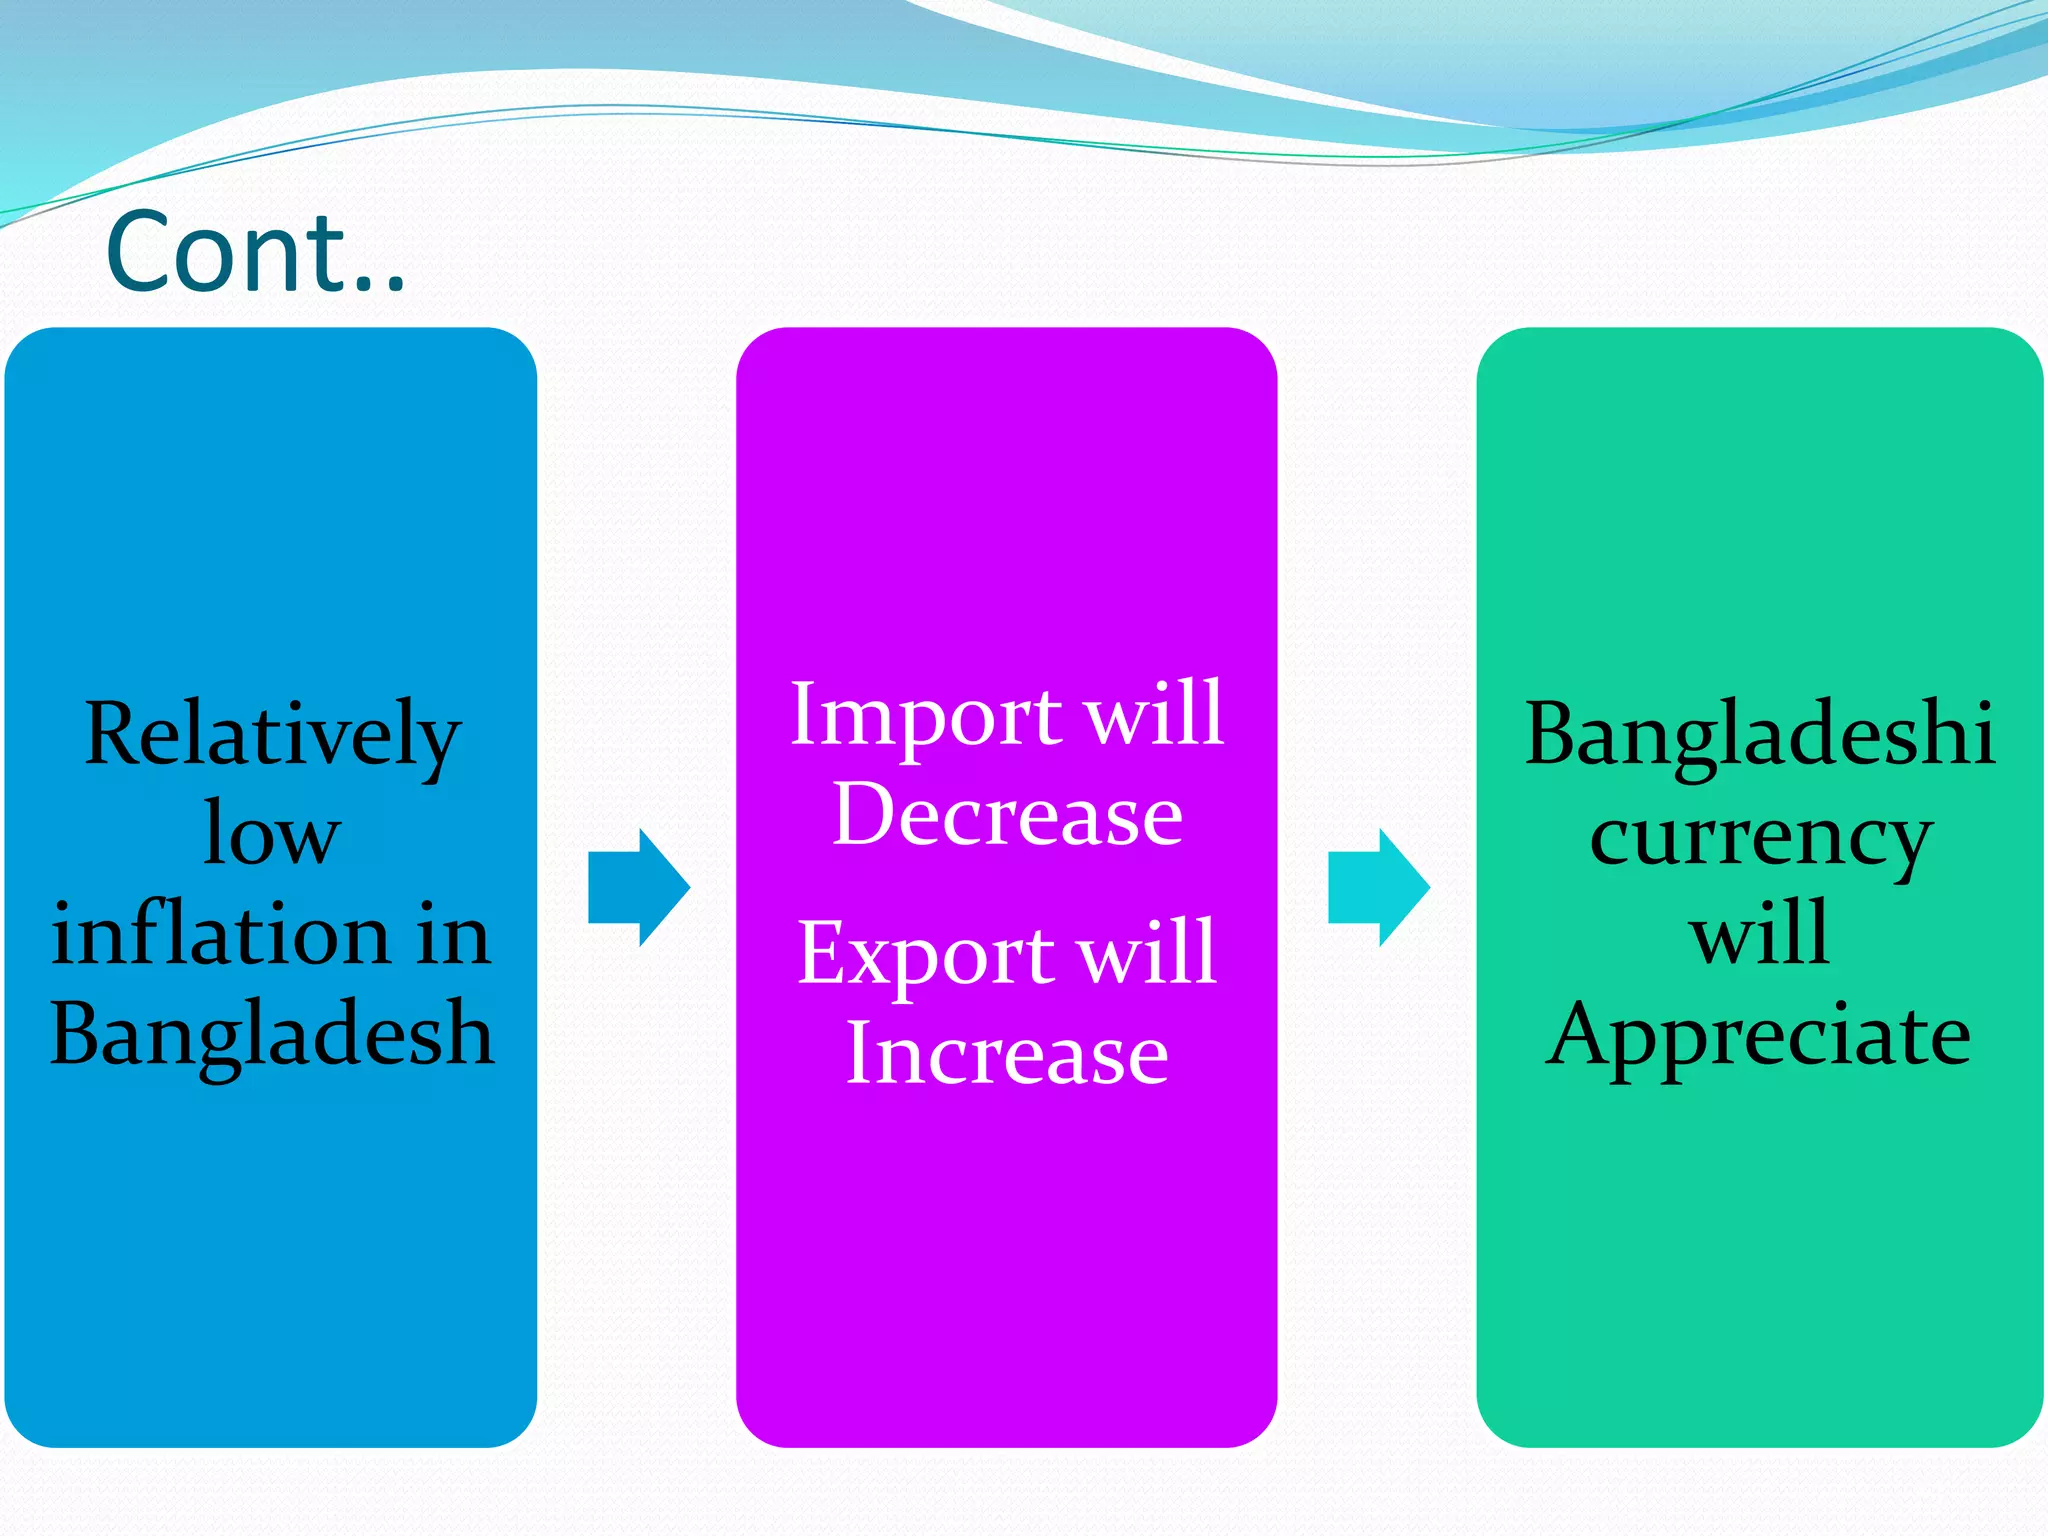


The document discusses factors affecting the exchange rate in Bangladesh. It analyzes data from 2000-2016 to examine the relationship between the exchange rate and inflation, interest rates, GDP, and per capita income. The regression analysis shows that per capita income and inflation positively impact the exchange rate the most, while GDP has a negative impact. It concludes that higher inflation, interest rates, and per capita income increase Bangladesh's exchange rate, while increased GDP decreases the exchange rate.


