Contents
2 Infineon keydata
3 Infineon at a glance
4 Management Board and
Supervisory Board
4 Letter to shareholders
10 The Management Board
12 Report of the Supervisory Board
to the Annual General Meeting
Navigation in the report per mouse click
Last page viewed
Search
Main table of contents
Previous page
Next page
Further information
Page reference
Chart reference
(Chart overview on p. 184)
Reference
(List of references on p. 87)
Reference to external documents
This interactive pdf is optimized for use
with Adobe Acrobat.
19 Combined Management Report
20 Business model
27 Group strategy
34 Research and development
37 Internal management system
40 Review of the semiconductor
industry
42 2023 fiscal year
58 Infineon on the capital market
61 Overall statement on Infineon’s
financial condition
62 Report on outlook, risk and
opportunity
79 Infineon Technologies AG
82 Corporate Governance
87 List of references
88 Consolidated Financial Statements
89 Consolidated Statement of
Profit or Loss
90 Consolidated Statement of
Comprehensive Income
91 Consolidated Statement of
Financial Position
92 Consolidated Statement of Cash Flows
93 Consolidated Statement of
Changes in Equity
95 Notes to the Consolidated
Financial Statements
172 Further information
172 Responsibility Statement by
the Management Board
173 Independent Auditor’s Report
180 Applications and product range
184 Chart overview
184 List of abbreviations
185 Financial calendar 2024
186 Imprint
Infineon | Annual Report 2023
1
3.
Fiscal year from1 October to
30 September
2023 2022
€ in
millions
in % of
revenue
€ in
millions
in % of
revenue
Change in
%
Revenue by segment 16,309 14,218 15
Automotive 8,242 51 6,516 45 26
Green Industrial Power 2,205 13 1,790 13 23
Power Sensor Systems 3,798 23 4,070 29 (7)
Connected Secure Systems 2,046 13 1,822 13 12
Other Operating Segments 18 0 20 0 (10)
Corporate and Eliminations – – – – –
Selected results of
operations key data
Gross profit/Gross margin 7,413 45.5 6,131 43.1 21
Research and
development expenses (1,985) 12.2 (1,798) 12.6 (10)
Selling, general and
administrative expenses (1,599) 9.8 (1,565) 11.0 (2)
Operating profit 3,948 2,845 39
Profit (loss) for the period 3,137 2,179 44
Segment Result/
Segment Result Margin 4,399 27.0 3,378 23.8 30
Basic earnings per share in € 2.38 1.65 44
Diluted earnings per share in € 2.38 1.65 44
Adjusted earnings per share
in € – diluted2 2.65 1.97 35
Dividend per share in €3 0.35 0.32 9
Infineon key data1
Fiscal year from 1 October to
30 September
2023 2022
€ in
millions
€ in
millions
Change in
%
Selected liquidity key data
Cash flows from operating activities
from continuing operations 3,962 3,986 (1)
Cash flows from investing activities (2,264) (2,441) 7
Cash flows from financing activities (1,301) (1,869) 30
Free Cash Flow4 1,158 1,648 (30)
Adjusted Free Cash Flow5 1,638
Adjusted Free Cash Flow as percentage of revenue 10.0%
Depreciation and amortization 1,754 1,664 5
Investments4 2,994 2,310 30
€ in millions (unless otherwise stated)
As of 30 Sep-
tember 2023
As of 30 Sep-
tember 2022
Change
in %
Gross cash position4 3,590 3,717 (3)
Net cash position4 (1,143) (1,945) 41
Selected financial condition key data
Total assets 28,439 26,912 6
Total equity 17,044 14,944 14
Equity ratio6 59.9% 55.5% 440bp
Return on Capital Employed (RoCE)4 16.6% 12.6% 400bp
Market capitalization7 40,879 29,574 38
Infineon employees (in total figures) 58,590 56,194 4
1 Percentage changes of more than +/–99.5% are shown as “+++” or “–––” in the tables in the Annual Report.
2 See the chapter “Review of results of operations” for definition. p. 52
3 A dividend per share of €0.35 for the 2023 fiscal year will be proposed to the Annual General Meeting on 23 February 2024.
4 See the chapter “Internal management system” for definition p. 37 ff.
5 See the chapter “Review of liquidity” for definition. p. 55 f.
6 Equity ratio = Total equity/Total assets.
7 The calculation is based on unrounded figures. Own shares were not taken into consideration for the calculation of market capitalization.
Infineon | Annual Report 2023
2
Further information
Consolidated Financial Statements
Combined Management Report
Management Board and Supervisory Board
4.
Infineon at
a glance
InfineonTechnologies AG is a world
leader in semiconductor solutions
that make life easier, safer and greener.
Microelectronics from Infineon is
the key to a better future. In the 2023
fiscal year (ending 30 September),
the Company reported revenue of
approximately €16.3 billion with
some 58,600 employees worldwide.
Infineon is listed on the Frankfurt
Stock Exchange (ticker symbol: IFX)
and in the USA on the over-the-counter
market OTCQX International Premier
(ticker symbol: IFNNY).
Dividend of
35 cents
per share planned
Revenue
€16.309 bn
+15%
Segment Result
and Margin
€4.399 bn
27.0%
58,590
employees
3
Further information
Consolidated Financial Statements
Combined Management Report
Management Board and Supervisory Board
Infineon | Annual Report 2023
5.
Infineon can lookback on a remarkable 2023 fiscal year. On the one hand, electromo
bility and renewable energy and the applications associated with them have ensured
a continuing high level of demand. On the other hand, demand for consumer applica-
tions, such as PCs and smartphones, has fallen in the wake of the Covid pandemic.
In this challenging market environment, your company has set new records for both
revenue and profitability. Our revenue rose to €16.3 billion, and we achieved a Segment
Result Margin of 27.0 percent.
Both figures exceeded our original annual forecast and are an initial confirmation
on the more ambitious course we have adopted as a company. A year ago, we raised
our long-term financial targets through the semiconductor cycle. Now we have proven
that we are also delivering at this higher level of expectation.
In our target markets, we are expecting strong growth drivers to continue and we
are anticipating big opportunities for Infineon. We want to grow and be sustainably
profitable, advance at a rapid rate, and make full use of strategic investments to lay
the important groundwork for Infineon’s future.
I would like to express my gratitude to all the 58,600 people working for Infineon for
their exceptional commitment in the past fiscal year. I would also like to thank you,
our shareholders, for your continuing confidence in our company. At our forthcoming
Annual General Meeting, we will propose an increase in the dividend payment to
€0.35 per share. Thus, we would like to ensure that you participate appropriately in
Infineon’s success while at the same time retaining the financial headroom we need
for the future development of your company.
Letter to shareholders
Neubiberg, November 2023
Jochen Hanebeck
Chief Executive Officer
4
Further information
Consolidated Financial Statements
Combined Management Report
Management Board and Supervisory Board
Letter to shareholders
6.
Following the lastAnnual General Meeting, the Supervisory Board elected a new
Chairman. On behalf of the Management Board, I would like to express my sincere
thanks to the long-standing Chairman, Dr. Wolfgang Eder, for the good working rela-
tion we have enjoyed over the past few years. Particular highlights include reorga
nizing the Management Board team, setting higher financial targets and preparing
for the expansion of our manufacturing facilities on our site in Dresden (Germany).
Dr. Wolfgang Eder was always a trusted guide and support to the Management Board.
With Dr. Herbert Diess, his successor as Chairman of the Supervisory Board, Infineon
has gained a proven expert in the major topics affecting the future of our business.
Our working relation with Dr. Herbert Diess is also respectful, constructive and built
on trust, which is very important to Infineon maintaining its successful course.
Having successfully established the Management Board position for Digital Trans
formation, our colleague Constanze Hufenbecher decided not to renew her expiring
contract and has handed over the baton to Elke Reichart on 1 November 2023.
Constanze Hufenbecher contributed significantly to the good progress made by
Infineon in the areas of digitalization and sustainability. She has laid important
foundations with the Digital Agenda and the Sustainability Strategy. Moreover, she
established a culture of cross-departmental collaboration at Infineon. I would like
to express my sincere personal gratitude for her achievements.
Digitalization is a crucial lever for our company. I am very much looking forward to
working together with Elke Reichart. She will bring new perspectives and impetus to
the Management Board team and use her extensive experience to help lead Infineon
into an even more successful future.
We are driving decarbonization and digitalization with our partners
Efforts to tackle the climate crisis are being intensified worldwide. At the same time,
we are seeing rapid development in the area of digitalization. Semiconductors are
essential in order to overcome the energy challenges of our time and help shape the
digital transformation. They are the building blocks of technological progress and
the engine of sustainable global development. At Infineon, we are actively doing
everything possible to drive forward decarbonization and digitalization. We are a
global leader in power systems and IoT. Together with our partners, we enable game-
changing solutions in three growth areas: green and efficient energy, clean and safe
mobility, and a smart and secure IoT.
Five core applications are particularly strong drivers for our business: electromobility,
renewable energy, automated driving, data centers – propelled by the ever-increasing
use of artificial intelligence – and IoT. These applications will account for around
60 percent of our expected revenue growth over the coming years. So that Infineon
can make the most of these major growth opportunities, we are setting the course
and laying the groundwork early on.
Investments in manufacturing capacities and security of supply
will set Infineon up for long-term growth
Our manufacturing strategy is based on clear principles. We focus on expanding our
in-house manufacturing in those areas in which added value for our customers
and differentiation for Infineon is created. This is the case, for example, for power
semiconductors and sensors. However, in the case of highly integrated digital
products such as microcontrollers and connectivity and security components, we
prefer to work together with contract manufacturers, as the design and software
are the main sources of differentiation in those areas. We also pursue this strategy
when
making our investment decisions.
Infineon | Annual Report 2023
5
Further information
Consolidated Financial Statements
Combined Management Report
Management Board and Supervisory Board
Letter to shareholders
7.
The groundbreaking ceremonyfor our “Smart Power Fab” at the Dresden site took
place at the beginning of May 2023. This factory will link our two major growth areas,
decarbonization and digitalization. We are strengthening our manufacturing base
for both analog mixed-signal technologies and power semiconductors. Analog mixed-
signal components are used in power supply systems (such as those in energy-efficient
chargers), in small motor control units for cars, in data centers and in IoT applications.
The interaction between power semiconductors and analog mixed-signal compo-
nents makes particularly energy-efficient and intelligent system solutions possible.
We therefore want to use our in-house manufacturing to create some of these prod-
ucts in the future, from both a differentiation and a resilience perspective.
The great importance of the project for Infineon, the region, Germany and Europe has
become clear, not least due to visits to the Dresden site by high-ranking politicians
– especially the President of the European Commission and the German Federal
Chancellor – and the resulting high level of media interest. Support provided by the
German Federal Government as funding body and the European Chips Act is giving
our project a tailwind. The additional capacity provided by the fab will enable us to
meet increasing demand from our customers in the second half of the decade and
will reinforce our position as a world-leading supplier of power systems.
Silicon chips of the type we make in Dresden will be the technically appropriate and
economically viable solution in many applications in the long term. Compound
semiconductors based on silicon carbide (SiC) and gallium nitride (GaN) expand the
options presented by silicon-based solutions. They enable particularly efficient,
fast-switching and compact system solutions that consume less power. We see rising
demand for these, especially for use in electric cars, charging stations and solar systems.
We want to lead the way across the whole range of power semiconductors – for
silicon
chips as well as for technologies based on SiC and GaN. We are therefore constantly
expanding our portfolio for different application areas. We are also increasing our
manufacturing capacity for both types of technology, while adopting an entrepreneur-
ial and long-term approach.
In August 2023, we therefore announced that we would be significantly increasing
the scope of the ongoing expansion of our manufacturing facilities on our Kulim site
(Malaysia). In a second expansion phase, we want to build the world’s largest and
most competitive SiC power semiconductor factory based on 200-millimeter manufac
turing technology there. Together with the planned conversion to 200-millimeter
production of our existing SiC manufacturing lines at the sites in Villach (Austria) and
Kulim, this investment offers Infineon annual revenue potential of around €7 billion
by the end of the decade.
Our investment decision is backed by numerous long-term agreements with high-
profile customers in the automotive sector and in the field of renewable energy.
Additional design wins worth €5 billion and associated advance payments of around
€1 billion are evidence of the great confidence our customers place in Infineon as
a reliable partner and driver of innovation.
In the global competition for the leading position in SiC technologies, certain strengths
differentiate Infineon from its competitors. First of all, the trench architecture we use
in chip manufacture has advantages in terms of performance and productivity. Second,
we offer all markets the most comprehensive product and packaging port
folio. Third,
we score with our excellent systems understanding and first-class access to customers.
However, we see few opportunities for differentiation in manufacturing the SiC base
material used in chip production, so this we buy in. We ensure access to this material
through a broad and regionally diversified supplier network. Infineon’s own laser-
based cold split technology enables particularly efficient use of the base material.
Your company has all the key factors at its disposal for sustainable success with SiC
solutions. We are therefore very well placed to benefit from similar economies of
scale with SiC as has previously been the case with silicon – both in manufacturing
and in research and development. We are very confident that we will be able to
achieve a market share in SiC of 30 percent by the end of the decade.
Infineon | Annual Report 2023
6
Further information
Consolidated Financial Statements
Combined Management Report
Management Board and Supervisory Board
Letter to shareholders
8.
So that weare equipped to handle the expected increase in demand for semiconductors
from our customers and are able to deliver in the long term, we are not only boosting
our in-house manufacturing but also increasing the supply of semiconductors we
purchase from contract manufacturers. Especially against the backdrop of geopoliti-
cal uncertainty, we want to make our supply chain even more resilient in the future.
Together with Taiwan Semiconductor Manufacturing Company (TSMC), the world’s
largest silicon contract manufacturer based in Taiwan, and the companies Bosch and
NXP Semiconductors, we want to invest in a joint company. As we and our partners
announced in August, the European Semiconductor Manufacturing Company (ESMC)
in Dresden is to build an ultra-modern fab for semiconductors with small feature
sizes of 12 to 28 nanometers. TSMC is to operate the fab for the entity. The project is
planned under the framework of the European Chips Act.
The planned fab is an ideal complement to our own manufacturing landscape. Whereas
the projects in Dresden and Kulim mentioned above are designed to expand capacity
for power semiconductors and analog mixed-signal technologies, our participation
in ESMC secures us access to capacity for our automotive microcontrollers and IoT
semiconductors, further improving our ability to meet growing demand.
This investment will bring the first FinFET fab to Europe. FinFET is a transistor techno
logy used in state-of-the-art digital chips. Even more transistors can be housed on
the smallest three-dimensional structures. As a result, the semiconductors are even
more powerful and energy-efficient. FinFET technology is becoming increasingly
important for our high-performance microcontrollers. With this fab, we are ensuring
Infineon will have direct access to this technology in Europe, and we are strengthen-
ing the European semiconductor ecosystem in the long term.
We are continuing to enhance our competence in power systems
and IoT with targeted acquisitions
In addition to SiC, GaN is developing into a key material for power semiconductors. It
has advantages especially at higher switching frequencies. In particular, for applications
such as mobile charging, power supplies for data centers, solar inverters for private
households, and onboard chargers for electric vehicles, GaN is on the brink of a break
through and promises very strong market growth. We therefore want to continue to
enhance our technical skills in the field of GaN.
In October 2023, we completed the acquisition of the company GaN Systems. The
company, which is headquartered in Ottawa (Canada), brings with it a broad port
folio of GaN-based solutions for power conversion as well as first-class application
know-how. We are delighted that the team from GaN Systems, comprising more than
200 employees, is now part of Infineon.
The strengths of both companies in terms of intellectual property and application
understanding ideally complement each other. Together, we now have over 450 GaN
experts, as well as more than 350 GaN patent families and a large number of highly
promising customer projects in the pipeline. This puts our company in an outstand-
ing position, opening up huge opportunities in various high-growth markets. This
will significantly accelerate our development roadmap for GaN solutions and further
strengthen our leading position in power systems.
Another exciting key topic for Infineon is artificial intelligence (AI). Machine learning is
being used in more and more IoT applications and enables new functionalities.
In May 2023, we acquired the company Imagimob. The startup, based in Stockholm
(Sweden), is a leading platform provider for machine learning solutions for energy-
efficient edge devices. Imagimob’s platform enables a variety of applications, such as
audio event detection, voice control, gesture recognition, predictive maintenance,
signal classification and material detection.
Infineon | Annual Report 2023
7
Further information
Consolidated Financial Statements
Combined Management Report
Management Board and Supervisory Board
Letter to shareholders
9.
With this acquisition,we are strengthening our position as a provider of machine
learning solutions, complementing our range of embedded AI solutions. This will
enable us to transfer the capabilities of machine learning, which have until now been
used mainly in large server farms, to our microcontrollers.
Artificial intelligence also offers Infineon huge growth potential in the area of power
systems. More and more data are being recorded, processed, stored and linked. To
make the data usable for different applications, the major cloud computing providers
are increasingly employing generative AI. As the example of ChatGPT shows, large
language models (LLMs) have the potential to take digitalization to a completely new
level.
In the coming years, AI will be used in more and more application areas. The volume
of data to be processed and the computing power required as a result will mean
a significant increase in the quantity and value of the semiconductors needed in
the data center servers. Energy-efficient power stages help reduce power losses and
cooling efforts This allows operators to significantly reduce their costs – and avoid
CO2. Demand is growing strongly. We offer highly energy-efficient power solutions
for the entire supply chain, from the grid to the central processor (GPU), making a
broader use of AI possible. Green computing is an ideal application area for Infineon.
This is a good example of how decarbonization and digitalization are closely linked
with one another.
Networks, data centers, servers and the IT infrastructure form the backbone of digi
talization. Another crucial element of the IoT is wireless connectivity between end
devices. In October 2023, we acquired the company 3db Access, a move designed to
enhance our skills in this area as well. The startup based in Zurich (Switzerland) is
a pioneer in energy-efficient ultra-wideband (UWB) technology. UWB technology can
be used to precisely determine positions and distances while being robustly protected
against signal interference. This makes it extremely attractive for many IoT applications.
These include secure access to vehicles and buildings, indoor navigation and pres-
ence detection of people in rooms. UWB complements our connectivity technologies
(Wi-Fi, Bluetooth®/ Bluetooth® Low Energy and NFC) and offers Infineon additional
opportunities in an interesting growth market.
Besides the targeted enhancement of our technological skills through acquisitions,
we are rapidly advancing with the company’s research and development activities.
The focus here is the benefit provided to customers. Our aim is to roll out differentiat-
ing solutions at an even faster rate. It is therefore crucial that we recognize product
and customer requirements at an early stage and that we understand our customers’
systems. Our “from product thinking to system understanding” approach, which
we have applied for many years, has proved its worth. Given the growing number of
applications served by Infineon, this approach is now more important than ever.
Particularly in application areas that are new to Infineon, we work closely together
with key customers on development. Our teams develop new solutions in tandem
with customers in an iterative process. By exchanging ideas directly, they learn to
understand customer and market requirements even better and more quickly and
can therefore offer tailor-made system solutions within a short period of time.
We are making Infineon CO2-neutral by 2030
At Infineon, as a leading manufacturer of semiconductors, our objective is not only to
be a technological leader but also a pioneer in sustainability. Infineon will become
CO2-neutral by the end of the 2030 fiscal year. Our target includes all direct emissions
(scope 1) as well as indirect emissions from purchased electricity and heat (scope 2).
By the end of the 2025 fiscal year, we want to have reduced our emissions by 70 percent
compared with 2019. To achieve these targets, we are working in particular on avoid-
ing direct emissions.
Infineon | Annual Report 2023
8
Further information
Consolidated Financial Statements
Combined Management Report
Management Board and Supervisory Board
Letter to shareholders
10.
Here we aremaking good progress. At the end of the 2023 fiscal year, our scope 1 and
scope 2 emissions were around 56.8 percent below the emissions of the base year 2019.
The installation of new PFC abatement systems in our frontend manufacturing in
Kulim (Malaysia) has already enabled us to reduce our scope 1 emissions by 21 percent.
In the past fiscal year, we also launched a similar project at our site in Austin (Texas,
USA). This means that we will have equipped all our prime manufacturing facilities
with highly efficient PFC abatement systems. The new manufacturing facilities
referred to above will of course be equipped with such systems right from the start,
so that they are in line with our CO2 neutrality goal.
In addition to avoiding direct emissions, other key levers for reducing CO2 are energy
conservation and the use of green electricity. In the 2023 fiscal year, we were able
to use green electricity to meet over three quarters of our electricity requirements.
We are continuing to develop our corporate culture
Infineon is seeing strong growth. Over the past few years, our business has become
bigger and, at the same time, more complex. We therefore make adjustments in the
company, adapt our processes and, last but not least, continue to develop our corpo-
rate culture. Crucial to our success is not only what we do but how we do it.
When I assumed my role as CEO, we launched the SPIRIT project. This is designed to
deliberately promote three behaviors in the company. We set ourselves ambitious
targets at all levels. We are accountable for our results and clarify our responsibilities.
We make timely decisions that are implemented consistently.
Whether you are setting ambitious targets or clarifying responsibilities, you need to
begin at the corporate level. We therefore made a decision in the summer that, in the
future, we would combine accountability with functional management roles across
the Group. This will make us significantly faster, because it will reduce the complexity
in our organization and create strong global functions – with local teams, where this is
expedient. Furthermore, we promote a sense of responsibility and purposefulness as
elements of our corporate culture. All this makes us even more attractive as an employer.
A challenging market environment in the 2024 fiscal year
At the beginning of the 2024 fiscal year, we are operating in an environment that con-
tinues to present challenges. The mobility of the future and renewable energies
are currently the strongest growth drivers for our business. In all other areas, we see
a temporarily difficult, cyclical market environment.
Overall, we are expecting revenue growth to continue in the 2024 fiscal year but at
a lower rate. We are assuming an increase in revenue of 4 percent. Hence, after the
two boom years of 2022 and 2023, we anticipate growth will be below the target we
have set ourselves of average revenue growth of “more than 10 percent per year”
over the semiconductor cycle. However, the sequence of different growth phases is
nothing unusual in the semiconductor market and as a company we know how to
deal with this situation.
With regard to structural growth opportunities, we are continuing to implement our
strategy consistently and we are reinforcing our leading position in power systems
and IoT with long-term investments in our manufacturing landscape and technological
leadership. Decarbonization and digitalization remain the foundations of our busi-
ness. With our solutions, we are driving forward the green and digital transformation,
thus providing our customers and you, our shareholders, with tangible added value.
Neubiberg, November 2023
Jochen Hanebeck
Chief Executive Officer
Infineon | Annual Report 2023
9
Further information
Consolidated Financial Statements
Combined Management Report
Management Board and Supervisory Board
Letter to shareholders
11.
The Management Board
(Fromleft to right)
Andreas Urschitz
Chief Marketing Officer
Dr. Sven Schneider
Chief Financial Officer
Jochen Hanebeck
Chief Executive Officer
Elke Reichart
Chief Digital
Transformation Officer
Dr. Rutger Wijburg
Chief Operations Officer
Infineon | Annual Report 2023
10
Further information
Consolidated Financial Statements
Combined Management Report
Management Board and Supervisory Board
The Management Board
12.
The Management Board
AndreasUrschitz
Chief Marketing Officer
Andreas Urschitz has been a
member of the Management Board
and Chief Marketing Officer of
Infineon Technologies AG since
2022 (appointed until 31 May 2025).
He is responsible for Group Sales,
Marketing Distribution; Customer
Engagement Strategy; Application
Framework Services; Organization
and Strategy enablement/imple-
mentation of Regions Greater China,
Asia Pacific and Japan; Marketing
Communications.
Andreas Urschitz was born in
1972 in Klagenfurt, Austria. He
obtained his master’s degree in
commercial science at the Vienna
University of Economics and Busi-
ness, Austria. He has been with
Infineon (Siemens AG until 1999)
since 1995.
Dr. Sven Schneider
Chief Financial Officer
Sven Schneider has been Chief
Financial Officer at Infineon
Technologies AG since 2019
(appointed until 30 April 2027).
He is responsible for Group
Finance; Group Financial Con-
trolling Planning; Treasury;
Taxes; Accounting, Consolidation
Reporting; Investor Relations;
Compliance; Audit; Risk Manage-
ment; Internal Controls.
Sven Schneider was born in 1966 in
Berlin, Germany. After completing
his studies in business administration
(Diplom-Kaufmann), he received
his doctorate in business adminis
tration from the University of Trier,
Germany. From 1995 to 2019, he
held several positions at Linde AG,
most recently as Spokesman of
the Executive Board, Chief Finan-
cial Officer and Labor Director.
Jochen Hanebeck
Chief Executive Officer
Jochen Hanebeck has been a
member of the Management
Board of Infineon Technologies AG
since 2016. He has been CEO
since 1 April 2022 (appointed until
31 March 2027). He is responsible
for Divisions; Group Strategy;
Mergers Acquisitions; Organization
and Strategy enablement/imple-
mentation of region Americas;
Communications Public Policy;
Human Resources (Labor Director);
Legal Patents; Research Devel-
opment (CTO).
Jochen Hanebeck was born in
1968 in Dortmund, Germany.
He received a degree in electrical
engineering from RWTH Aachen
University, Germany. He has been
with Infineon since 1994 (Siemens
AG until 1999).
Elke Reichart
Chief Digital Transformation Officer
Elke Reichart has been a member of
the Management Board of Infineon
Technologies AG and Chief Digital
Transformation Officer since 2023
(appointed until 31 October 2026).
She is responsible for Groupwide
Digitalization Strategy, Information
Technology, Digital Sales Market-
ing Platforms and Services, Business
Continuity, Business Excellence,
Group Processes.
Elke Reichart was born in 1965 in
Stuttgart, Germany. She received
her diploma in Romance Languages
and Economics as well as a post-
graduate degree in Applied Com-
puter Science from the University
of Gießen, Germany. She began
her career at Hewlett-Packard Inc.
in 1991.
Dr. Rutger Wijburg
Chief Operations Officer
Rutger Wijburg has been a mem-
ber of the Management Board of
Infineon Technologies AG and Chief
Operations Officer since 1 April 2022
(appointed until 31 March 2025).
He is responsible for Group Manufac
turing, Supply Chain, Procurement,
Customs, Quality Management, Real
Estate and Facility Management
(Manufacturing Sites).
Rutger Wijburg was born in
Nijmegen, Netherlands, in 1962.
He studied Electrical and Electronics
Engineering at the University of
Twente, Netherlands, and received
his PhD in 1990. He started his
career in 1990 at the University
of Twente. Before joining Infineon
in 2018, he held various leading
positions at Philips, NXP and
Globalfoundries.
Infineon | Annual Report 2023
11
Further information
Consolidated Financial Statements
Combined Management Report
Management Board and Supervisory Board
The Management Board
13.
The times welive in are being affected by so much change. What sets us apart at
Infineon is that we see this as an opportunity and are actively working to shape that
change. Our forward-looking technologies and products are making an important
contribution towards halting (or at least slowing down) climate change and towards
using digitalization with human beings in mind. I can see how Infineon employees
around the world are playing their part with enthusiasm, skill and a positive mindset.
This is not only making us an innovative high-tech company but also ensures sustain-
able economic success. The 2023 fiscal year has demonstrated this once again. We
want you, dear shareholders, to be able to participate in this success in the usual way
and will therefore submit a proposal jointly with the Management Board to the Annual
General Meeting for another increase in the dividend to €0.35 per share entitled
to a dividend. For many years, Infineon’s success story has been built on outstanding
technological and business performance combined with added value for society
as a whole, and I would be delighted if you continued to accompany us on our way.
Report of the Supervisory Board
to the Annual General Meeting
Main activities of the Supervisory Board
During the 2023 fiscal year, the Supervisory Board again performed its duties with
utmost diligence in accordance with the law, Infineon’s Articles of Association and
the Supervisory Board’s own rules of procedure. Its work was based in particular on
reports presented by the Management Board at Supervisory Board and committee
meetings regarding all issues relevant to Infineon. For the most part, the focus was
again on corporate strategy, current business performance and the economic situa-
tion, financial and investment planning, and the risk profile, as well as issues relating
to risk management and compliance. In addition, the Supervisory Board addressed
the replacement of the Chairman of the Supervisory Board and other personnel
changes on the Supervisory Board, as well as preparing for the appointment of a new
Management Board member responsible for digital transformation. The Supervisory
Board was provided with written quarterly reports on the economic environment,
Infineon’s business performance, including investment and acquisition activities, key
financial data, risks and opportunities, and major areas of litigation, as well as other
specific topics of relevance. Between quarterly reports, the Management Board also
provided the Supervisory Board with additional information in the form of monthly
reports on current business performance and developments.
As Chairman of the Supervisory Board, I was also in regular contact with both the Chief
Executive Officer and other members of the Management Board between meetings.
The CEO kept me well-informed at all times of other key events for Infineon. My work-
ing relationship with the CEO was respectful, constructive and based on trust.
In the 2023 fiscal year, the full Supervisory Board convened nine times, holding
six ordinary meetings and three extraordinary meetings. Additionally, two resolutions
were passed on the basis of written communication. The attendance rate at Super
visory Board meetings was just under 98 percent; Diana Vitale was excused from attend
ing one meeting and Dr. Manfred Puffer from two meetings. The attendance rate at the
Supervisory Board’s committee meetings was 100 percent. Details of the individual
attendance record of Supervisory Board members at full Supervisory Board and com-
mittee meetings are provided in a table in the Statement on Corporate Governance.
www.infineon.com/declaration-on-corporate-governance
Dr. Herbert Diess
Chairman of the Supervisory Board
Infineon | Annual Report 2023
12
Further information
Consolidated Financial Statements
Combined Management Report
Management Board and Supervisory Board
Report of the Supervisory Board
14.
The three extraordinarymeetings of the full Supervisory Board were conducted virtu-
ally, and all the ordinary meetings were face-to-face meetings. Of the six meetings of
the Executive Committee, two were virtual. One of the five meetings of the Investment,
Finance and Audit Committee and four of the six meetings of the Nomination Com-
mittee were in a virtual format. All the meetings of the Strategy and Technology Com-
mittee, without exception, were face-to-face meetings.
In preparation for ordinary Supervisory Board meetings, separate preliminary meet-
ings were held for both the shareholder representatives and the employee representa-
tives. The Supervisory Board and the Investment, Finance and Audit Committee also
convened regularly without the presence of the Management Board.
Corporate strategy
The 2023 fiscal year was characterized by a variety of strategic projects that were
closely monitored and then all approved by the Supervisory Board:
›
First, the Supervisory Board approved a more ambitious target operating model
and thereby an upward revision of Infineon’s long-term financial targets. Like the
Management Board, the Supervisory Board is convinced that decarbonization and
digitalization will ensure structurally increasing demand for semiconductors and
that, thanks to its strategic focus, Infineon will benefit disproportionately from this
development.
›
In addition, the past fiscal year has involved major investment – the construction
of a new factory in Dresden (Germany), significant expansion of manufacturing
in Kulim (Malaysia) and, finally, the participation of Infineon in a joint venture
with TSMC, Bosch and NXP to build a modern semiconductor fab, also in Dresden.
Infineon is therefore creating the production capacity required to reliably meet
growing demand from its customers over the long term. Moreover, the investment
in Dresden is an important milestone that will reinforce the European semicon
ductor ecosystem and strengthen supply chain resilience in Europe. Accordingly,
the Supervisory Board was satisfied that these investments were necessary for
the business and made economic sense and approved the plans.
›
Finally, the Supervisory Board examined measures relating to the Group’s inorganic
growth in promising new fields and granted its approval for the acquisition of
the Canadian company GaN Systems, the technological leader in the development
of GaN-based solutions for power conversion. The acquisition will significantly
strengthen Infineon’s leading position in power systems. The Supervisory Board
also agreed on strategic portfolio management measures with the Management
Board and endorsed the sale of its HiRel (High Reliability) DC-DC converter business to
Micross Components, a transaction that enables Infineon to focus in the future on
those HiRel business areas that benefit from its leading semiconductor technologies.
In the 2023 fiscal year, separately from the examination of specific strategic projects,
the Supervisory Board also considered various aspects of Infineon’s corporate strategy
at a daylong strategy meeting that took place on the Dresden site. Topics discussed
included strategic fundamentals, portfolio management, parameters for organic and
inorganic growth, geopolitical issues, financial targets and, last but not least, Infineon’s
sustainability strategy.
Personnel matters relating to the Management Board
In the course of the fiscal year, Constanze Hufenbecher, Management Board member
and Chief Digital Transformation Officer (CDTO), informed the Supervisory Board
of her intention not to renew her contract which was due to expire in April 2024. The
Supervisory Board accepted her decision with regret. Immediately thereafter, the
Supervisory Board initiated the process of finding a replacement for the CDTO position
on the Management Board. Based on the Supervisory Board’s continuous succes-
sion planning and with the support of a human resources consultant, an extensive
search process was launched. Infineon was eventually able to recruit Elke Reichart,
an experienced digitalization expert. Elke Reichart was appointed as a member of the
Management Board for three years with effect from 1 November 2023. Constanze
Hufenbecher resigned from the Management Board with effect from 31 October 2023.
The Supervisory Board thanks Constanze Hufenbecher for her achievements and
personal commitment and wishes Elke Reichart a successful start in her new role.
Infineon | Annual Report 2023
13
Further information
Consolidated Financial Statements
Combined Management Report
Management Board and Supervisory Board
Report of the Supervisory Board
15.
Management Board remuneration
InNovember 2022, the Supervisory Board established a new remuneration system
for the Management Board. This created a remuneration structure with higher variable
remuneration components, whereby the Management Board remuneration will in
the future be even more closely linked with the success of the business. Moreover,
the maximum remuneration for longer-serving Management Board members will
be increased, giving the Supervisory Board more scope to offer experienced Manage-
ment Board members competitive remuneration. The restriction of the STI modifier
to extraordinary developments brought the system more in line with the provisions
set out in the German Stock Corporation Act (AktG) and the German Corporate Gover-
nance Code. Finally, the opportunity was provided to weight ESG targets in the long-
term variable remuneration even more heavily in the future. At the Annual General
Meeting in February 2023, this new remuneration system for the Management Board
was approved by a large majority. It was thereupon implemented in all Management
Board employment contracts as of 1 April 2023.
Further information on Management Board remuneration is available in the detailed
Remuneration Report. As in the previous year, the Management Board and the Super-
visory Board decided to ask the auditors to perform an additional review of the
content of the Remuneration Report in addition to their formal audit of the report.
KPMG issued an unqualified audit opinion on the Remuneration Report.
Litigation
The Supervisory Board was regularly provided during the 2023 fiscal year with in-depth
information regarding major legal disputes, which it then discussed at length with
the Management Board. These included, in particular, the legal dispute with the insol
vency administrator of Qimonda AG pertaining to alleged residual liability claims,
which has been ongoing for years.
Supervisory Board topics
Personnel matters relating to the Supervisory Board
Dr. Wolfgang Eder and Hans-Ulrich Holdenried resigned from the Supervisory Board
with effect from the end of the Annual General Meeting on 16 February 2023. Based
on a proposal by the Supervisory Board, Klaus Helmrich and I were newly elected to
the Supervisory Board. At its meeting immediately after the Annual General Meeting,
the Supervisory Board elected me as the new Chairman of the Supervisory Board,
as a member and the Chairman of the Strategy and Technology Committee, and as
the Chairman of the Nomination Committee. I am grateful for this vote of confidence
from Infineon’s Supervisory Board and would like to take the opportunity here to
thank once again Dr. Wolfgang Eder and also Hans-Ulrich Holdenried for their success
ful work over the past years.
Following the resignation of Géraldine Picaud from the Supervisory Board at the
beginning of 2023, Ute Wolf was appointed as a member of the Supervisory Board by
court order in April 2023 and elected by the Supervisory Board as a member of the
Investment, Finance and Audit Committee. Until shortly before her appointment by
Infineon, Ute Wolf was the Chief Financial Officer of a public limited company listed
in Germany. In addition, she has already spent several years as the Chair of audit
committees of listed companies. She therefore increases the level of financial expertise
on the Supervisory Board. At the Annual General Meeting to be held in February 2024,
the Supervisory Board will propose that Ute Wolf be elected to the Supervisory Board
for a regular four-year term of office.
Basic and ongoing training
Supervisory Board members are responsible for undertaking any basic or ongoing
training considered necessary to perform their duties, and they receive appropriate
support from Infineon to do so. In-house information events are held to provide targe
ted training. In the 2023 fiscal year, for example, events took place that covered the
EU Taxonomy and governance topics as well as current regulatory developments affec
ting the Supervisory Board. As part of the onboarding process for new Supervisory
Board members, Infineon also conducts comprehensive briefings covering a broad
range of topics, including its individual operating segments, the principles and key
elements of its corporate strategy, investment planning and its manufacturing strategy.
Infineon | Annual Report 2023
14
Further information
Consolidated Financial Statements
Combined Management Report
Management Board and Supervisory Board
Report of the Supervisory Board
16.
Committee work
The SupervisoryBoard’s various committees are responsible for drawing up resolutions
and preparing other major topics that need to be dealt with by the full Supervisory
Board. Moreover, the Supervisory Board has delegated certain decision-making powers
to its committees. The chairpersons of each committee are required to report on
committee meetings at the next full Supervisory Board meeting.
Mediation Committee
The Mediation Committee did not need to convene during the reporting year.
Nomination Committee
The Nomination Committee held six meetings in total during the 2023 fiscal year.
The topics discussed at the meetings included the replacements for Supervisory
Board positions referred to above following the resignations of Dr. Wolfgang Eder,
Hans-Ulrich Holdenried and Géraldine Picaud. Klaus Helmrich and I were elected at
the 2023 Annual General Meeting and Ute Wolf was appointed by the court. The
committee also prepared the nomination for election at the 2024 Annual General
Meeting of Ute Wolf, as well as of Prof. Hermann Eul, an acknowledged expert in
semiconductors.
Executive Committee
At its ordinary meetings, the Executive Committee focused primarily on preparing the
Supervisory Board’s resolutions to determine the level of variable remuneration to be
paid to Management Board members. These included, firstly, determining the Short-
Term Incentive (STI) target achievement levels for the 2022 fiscal year and setting new
target values for the 2023 fiscal year and, secondly, determining the STI modifier cri-
teria, confirming the ESG targets for limiting carbon emissions and increasing diversity
that are relevant for the Long-Term Incentive (LTI) and confirming the composition
of the TSR (Total Shareholder Return) peer group. The topics discussed at the extra
ordinary meetings were the personnel and remuneration issues referred to above.
Investment, Finance and Audit Committee
The Investment, Finance and Audit Committee held five ordinary meetings in the
2023 fiscal year.
Its activities centered on monitoring the financial reporting process, reviewing the
half-year and quarterly financial statements, conducting the preliminary audit of the
Separate Financial Statements, Consolidated Financial Statements and Combined
Management Report for Infineon Technologies AG and the Infineon Group, and dis-
cussing the audit reports with the auditor. The Committee also conducted an assess-
ment of the quality of the audit. In addition, the Committee examined Infineon’s
financial and investment budget. It also received regular reports on the internal con-
trol, internal audit, risk management and compliance management systems and
deliberated on their appropriateness and effectiveness. The Committee was also
provided with continuous updates on additional risks and significant legal disputes.
The Committee’s recommendation to the full Supervisory Board to propose to share-
holders at the 2023 Annual General Meeting that KPMG AG Wirtschaftsprüfungs-
gesellschaft, Munich (KPMG) be elected for the last time as Company and Group audi-
tor was based on a Declaration of Independence obtained from KPMG as well as an
analysis of the non-audit services provided by KPMG. There were no indications of
conflicts of interest, grounds for exclusion or other lack of independence on the part
of the auditor. The Committee also considered the fee arrangements, issued con-
tracts for the relevant audit engagements and defined supplementary areas for audit
emphasis.
Representatives of the auditor attended all the meetings of the Investment, Finance
and Audit Committee and reported in detail on the audit procedures performed. At
each of the meetings, there was also a closed session involving the auditor and the
members of the Investment, Finance and Audit Committee without the Management
Board being present. This also applied to the full Supervisory Board meeting that
considered the financial statements.
The Committee also devoted time to the Remuneration Report and the separate
combined Non-Financial Report and, in this context, considered other sustainability
issues, including the German Supply Chain Act (LkSG).
Infineon | Annual Report 2023
15
Further information
Consolidated Financial Statements
Combined Management Report
Management Board and Supervisory Board
Report of the Supervisory Board
17.
Strategy and TechnologyCommittee
The Supervisory Board’s Strategy and Technology Committee convened three times
during the reporting year. The Management Board provided it with reports on a num-
ber of topics, including key aspects of the macroeconomic market and competitive
environment and the progress of the Group’s digital agenda. Other areas discussed
at committee meetings were strategic considerations with regard to the expansion of
manufacturing capacity and the value contribution of software at Infineon.
Corporate Governance
Declaration of Compliance 2023
In the Declaration of Compliance dated November 2023, the Management Board and
Supervisory Board jointly declared that, since the submission of the last Declaration
of Compliance in November 2022, all the recommendations of the German Corporate
Governance Code contained in the version dated 28 April 2022 have been complied
with and will continue to be complied with in the future.
The actual wording of the Declaration of Compliance 2023 and all previous Declara-
tions of Compliance are available on Infineon’s website.
www.infineon.com/declaration-of-compliance
Self-assessment by the Supervisory Board
The Supervisory Board regularly assesses how effectively it performs its duties. It
conducted such a self-assessment in the 2023 fiscal year. Given that in the 2022 fiscal
year, the self-assessment was carried out with the support of an external consultant
(including personal interviews with all the members of the Management Board and
the Supervisory Board), Infineon reverted in the 2023 fiscal year to the use of an inter-
nal questionnaire. The results of the questionnaire were discussed in the course of
a Supervisory Board meeting in August 2023 and a full-day Supervisory Board work-
shop in November 2023. Issues discussed included reinforcing the expertise of
the Supervisory Board in the area of semiconductors, which led to Prof. Hermann Eul
being nominated to the Supervisory Board, cooperation between the committees
and the full Supervisory Board, the framework for the Supervisory Board’s engage-
ment with strategic topics, and the parameters of the Supervisory Board’s continuous
succession planning for Management Board positions.
Skills and expertise profile and list of objectives for
the Supervisory Board/qualifications matrix
The Supervisory Board decided to make a modification to the skills and expertise
profile and list of objectives. One of the reasons for this was to make explicit refer-
ence in the skills and expertise profile to sustainability expertise. It was also decided
to modify the age limit of 70 previously set for Supervisory Board members to the
extent that, in the future, it will no longer be simply a rule but a strict limit. Moreover,
the Supervisory Board looked in detail at the qualifications matrix published in the
Statement on Corporate Governance.
Examination of potential conflicts of interest
The members of the Management Board and of the Supervisory Board are required
to disclose any conflicts of interest to the Supervisory Board without delay. One
Super
visory Board member disclosed a potential conflict of interest in respect of an
MA project. Thereafter, this Supervisory Board member was not given access to
the
relevant documents and also did not participate in the meetings and decision-
making process of the Supervisory Board in this respect.
Prior to Management Board members assuming sideline activities, particularly super-
visory board mandates outside the Company, the German Corporate Governance
Code requires that permission be granted by the Supervisory Board. No conflicts of
interest were discernible in any of the sideline activities performed. In fact, they were
all in Infineon’s best interests and were therefore approved by the Supervisory Board
and/or Executive Committee.
Further information on the topic of corporate governance is available in the Statement
of Corporate Governance.
www.infineon.com/declaration-on-corporate-governance
Infineon | Annual Report 2023
16
Further information
Consolidated Financial Statements
Combined Management Report
Management Board and Supervisory Board
Report of the Supervisory Board
18.
Rules of procedurefor the Supervisory Board and
the Management Board
All the rules of procedure for the Supervisory Board and the Management Board are
available on the Infineon website.
www.infineon.com/cms/en/about-infineon/investor/corporate-governance/articles-of-association/
Related party transactions
Publicly listed companies such as Infineon require the approval of the Supervisory
Board or one of its committees before entering into certain transactions with related
parties. In order to identify related party transactions that require approval and to
treat them in accordance with the law, Infineon has implemented a procedure based
on guidelines that apply worldwide across the Group. The Supervisory Board has
delegated responsibility in this area to the Investment, Finance and Audit Committee,
particularly for resolutions requiring approval. There were no related party trans
actions requiring approval in the 2023 fiscal year.
Separate and Consolidated Financial Statements
KPMG audited the Separate Financial Statements of Infineon Technologies AG and
the Consolidated Financial Statements as of 30 September 2023, as well as the
Combined Management Report of Infineon Technologies AG and the Infineon Group,
and issued unqualified opinions thereon.
The Half-Year Financial Report was also reviewed by KPMG. No issues were identified
that might indicate that the condensed Interim Consolidated Financial Statements
or the Interim Group Management Report were not prepared in accordance with the
applicable provisions in all material respects.
KPMG has audited the Separate Financial Statements of Infineon Technologies AG
and the Consolidated Financial Statements of the Infineon Group and reviewed the
Interim Consolidated Financial Statements since the 1999 fiscal year (short fiscal year
from 1 April 1999 to 30 September 1999). Martin Schmitt, the auditor responsible for
the engagement, signed the auditor’s report for the first time for the 2021 fiscal year
(1 October 2020 to 30 September 2021) and Angelika Huber-Straßer, as co-signatory,
for the first time for the 2023 fiscal year (1 October 2022 to 30 September 2023).
At the meeting of the Investment, Finance and Audit Committee held on 14 November
2023 and continued in a conference call on 21 November 2023, thorough discussions
were held with the auditor regarding the Separate Financial Statements, the Consoli-
dated Financial Statements, the Combined Management Report, the appropriation
of profit and the auditor’s findings. The Committee deliberated at length on the key
audit matters disclosed in the auditor’s report as well as on the related audit proce-
dures. Based on the insights gained in the course of these deliberations, the Investment,
Finance and Audit Committee resolved to suggest to the Supervisory Board that the
financial statements drawn up and presented by the Management Board be approved
and the proposed appropriation of profit agreed to.
The Separate Financial Statements, the Consolidated Financial Statements, the Com-
bined Management Report, the Management Board’s proposal for the appropriation
of unappropriated profit (all prepared by the Management Board), and KPMG’s long-
form audit reports were all made available to the Supervisory Board at its meeting on
23 November 2023. At this meeting, the Chairman of the Investment, Finance and
Audit Committee reported in depth on the corresponding recommendations of the
Committee. In addition, all material issues relevant to the financial statements and
the audit, including the key audit matters, were exhaustively discussed with the audi-
tor and closely examined by the Supervisory Board. The examination also covered
the proposal to pay a dividend of €0.35 per share entitled to dividend.
Infineon | Annual Report 2023
17
Further information
Consolidated Financial Statements
Combined Management Report
Management Board and Supervisory Board
Report of the Supervisory Board
19.
After detailed discussions,the Supervisory Board concluded that it had no objections
to the financial statements and the audits performed by the auditor. In its opinion, the
Combined Management Report complied with all legal requirements. The Supervisory
Board also concurred with the assertions regarding Infineon’s future development
contained therein, as well as with the results of the audit of the financial statements.
It therefore approved the Separate Financial Statements of Infineon Technologies AG
and the Consolidated Financial Statements of the Infineon Group for the 2023 fiscal
year. The Separate Financial Statements were adopted accordingly. The Supervisory
Board also approved the Management Board’s proposal for the appropriation of
unappropriated profit.
Moreover, the Investment, Finance and Audit Committee and the full Supervisory
Board deliberated on the combined separate Non-Financial Report for the year ended
30 September 2023 drawn up by the Management Board and the Remuneration
Report prepared together with the Management Board. KPMG performed a reason-
able assurance engagement for the Remuneration Report and a limited assurance
engagement for some parts of the combined separate Non-Financial Report and a
reasonable assurance engagement for other parts of that report. In both cases, KPMG
issued an unqualified opinion thereon. The documents were carefully examined by
the Investment, Finance and Audit Committee at its meeting on 14 November 2023,
which was continued in a conference call on 21 November 2023, and by the Super
visory Board at its meeting on 23 November 2023. The Supervisory Board approved
the Remuneration Report and positively acknowledged the combined separate
Non-Financial Report prepared by the Management Board.
The Supervisory Board wishes to thank all Infineon employees and the Management
Board for their great commitment and their excellent performance in the 2023 fiscal
year, which has again been a challenging year.
Neubiberg, November 2023
On behalf of the Supervisory Board
Dr. Herbert Diess
Chairman of the Supervisory Board
Infineon | Annual Report 2023
18
Further information
Consolidated Financial Statements
Combined Management Report
Management Board and Supervisory Board
Report of the Supervisory Board
20.
This report combinesthe Group Management Report of Infineon (“Infineon”
or “the Group”) – comprising Infineon Technologies AG (hereafter also
referred to as “the Company”) and its consolidated subsidiaries – and the
Management Report of Infineon Technologies AG.
The Combined Management Report contains forward-looking statements
about the business, financial condition and earnings performance of
Infineon. These statements are based on assumptions and projections on
the basis of currently available information and present estimates. They
are subject to a multitude of uncertainties and risks. Actual business devel
opment may therefore differ materially from what has been expected.
Beyond disclosure requirements stipulated by law, Infineon does not
undertake any obligation to update forward-looking statements.
With effect from 1 April 2023, the “Industrial Power Control” segment
was renamed “Green Industrial Power”. Decarbonization, electrification
and energy efficiency are important drivers of the business in this seg-
ment. This focus and the significant contribution made by this segment
to CO2 reduction are reflected in its new name. The change of name has
no impact on the organizational structure, strategy or scope of business.
The content of these sections is voluntary content that has not been
checked by the auditor but only read critically. In the case of cross-
references, the information to which the cross-references refer has not
been checked either.
20 Business model
21 Overview
22 Value chain and manufacturing
24 The segments
27 Group strategy
27 Long-term growth trends
27 Strategic targets
29 Strategic guidelines
33 Human resources strategy
34 Research and development
37 Internal management system
40 Review of the semiconductor industry
42 2023 fiscal year
42 Group performance
44 Segment performance
49 Review of results of operations
53 Review of financial condition
55 Review of liquidity
58 Infineon on the capital market
61 Overall statement on Infineon’s financial condition
62 Report on outlook, risk and opportunity
62 Outlook
65 Risk and opportunity report
79 Infineon Technologies AG
82 Corporate Governance
82 Information pursuant to section 289a, paragraph 1
and section 315a, paragraph 1 of the German
Commercial Code (HGB)
86 Statement on Corporate Governance pursuant to sections
289f and 315d of the German Commercial Code (HGB)
86 Remuneration Report
87 List of references
Combined Management Report
Infineon | Annual Report 2023
19
Overview
Semiconductors are essentialto mastering the challenges of decarbonization and
digital transforma
tion. They make our everyday lives easier, safer and greener. With
around 58,600 employees worldwide, Infineon is a leading global provider of semi-
conductor solutions that pave the way for green and efficient energy, clean and safe
mobility, and intelligent and secure IoT. Infineon develops, manufactures and markets
a large number of semiconductors and semiconductor-based solutions, focusing
on the key markets in the automotive, industrial and consumer sectors. Its products
range from standard components to special components for digital, analog and
mixed-signal applications, all the way to customer-specific solutions and the appro-
priate software.
Our core business includes power semiconductors based on silicon (Si), silicon carbide
(SiC) and gallium nitride (GaN) in the form of individual components, modules and
system solutions. Over the years, Infineon has acquired in-depth knowledge about
the use of power semiconductors in all applications and the specific challenges
associated with them, developing a very broad portfolio. By adopting our strategic
approach “Product to System”, we combine these power semiconductors with
microcontrollers (including software and driver components), so that we can provide
perfect solutions for energy conversion systems and enable decarbonization.
In the area of digitalization, we have a broad portfolio of microcontrollers with hard-
ware-based security, sensors and connectivity products, such as Wi-Fi and Bluetooth,
supplemented by software. These are used in the automotive, industrial and consumer
sectors, as well as in end applications such as mobile payment and governmental
identity documents.
In addition to our established core business, we also service new and adjacent busi-
ness areas. Links may arise between the different areas, not only in terms of products
or technology but also in terms of markets or applications.
Infineon | Annual Report 2023
21
Further information
Consolidated Financial Statements
Management Board and Supervisory Board Combined Management Report
Business model
Overview
23.
Value chain andmanufacturing
Infineon covers the main stages of the semiconductor value chain: from development
and design, via frontend and backend manufacturing and marketing, to delivery
to customers (see C01). Increasingly, it also provides software and other services,
such as application-specific support for the implementation of its solutions.
In frontend manufacturing, the wafers are processed. Optical, physical and chemical
methods are used to create transistors and their interconnections, thus determining
the function of the chip. The wafers are transferred from the frontend site to a back-
end site, where the remaining processing steps take place in backend manufacturing.
These steps include sawing the wafer into individual chips as well as assembly and
testing. Following the backend manufacturing, the chips are sold to customers via
regional distribution centers.
In order to optimize the use of capital and increase flexibility, we use external manufac
turing partners in addition to our in-house manufacturing. In frontend manufacturing,
this applies primarily to manufacturing processes with little potential for differen
tiation and, in backend manufacturing, to standardized package types. More informa-
tion about our manufacturing strategy is given in the chapter “Group strategy”. p. 27 ff.
C01 The main stages of the semiconductor value chain
Design
Frontend
manufacturing
Backend
manufacturing
Distribution
center
Customer
In-house
manufacturing
Services
Software
Application
support
Digital
services
In-house
manufacturing
By foundry
partners
By
sub-contractors
Infineon | Annual Report 2023
22
Further information
Consolidated Financial Statements
Management Board and Supervisory Board Combined Management Report
Business model
Value chain and manufacturing
24.
Headquarters and manufacturingsites
■ Corporate headquarters ■ Regional headquarters ■ Frontend manufacturing ■ Backend manufacturing
For the definition of frontend/backend manufacturing, see chapter “Value chain and manufacturing”. p. 22
9
5
Americas
Mexico
■ 1 Tijuana
USA
■ 2 El Segundo, CA
■ 3 Austin,TX
■ 4 Leominster, MA
■ 5 Mesa, AZ
■ 6 San José, CA
Europe, Middle East, Africa
Austria
■ 1 Villach
Germany
■ 2 Neubiberg
near Munich
■ 3 Dresden
■■ 4 Regensburg
■ 5 Warstein
Hungary
■ 6 Cegléd
Asia-Pacific
Indonesia
■ 1 Batam
Korea
■ 2 Cheonan
Malaysia
■ 3 Kulim
■ 4 Melaka
Philippines
■ 5 Cavite
Singapore
■■ 6 Singapore
Thailand
■ 7 Bangkok
Greater China
Mainland China
■ 8 Shanghai
■ 9 Wuxi
Japan
■ 10 Tokyo
1
3
4
1
4
3
5
2
7
8
6
2
6
10
2
4
3
5
6
1
Infineon | Annual Report 2023
23
Further information
Consolidated Financial Statements
Management Board and Supervisory Board Combined Management Report
Business model
Value chain and manufacturing
25.
The segments
In additionto general areas within the Group, such as manufacturing and various cor-
porate functions, Infineon comprises four segments (also known as divisions). Each
segment focuses on the needs of its own target markets and customers and also has
individual responsibility for specific areas that reflect its core competencies. The
Automotive segment is responsible for the semiconductor business for automotive
electronics. The Green Industrial Power segment concentrates on power semicon-
ductors primarily used in industrial applications and renewable energy, while the
Power Sensor Systems segment addresses not only sensor technologies but also
power supplies in general, including those for data centers, telecommunications
networks and more consumer-oriented applications. Activities relating to IoT and
traditional and new security applications are bundled within the Connected Secure
Systems segment. The segments often cooperate with one another to ensure com-
prehensive coverage of the requirements of the various target markets. As a result,
the sales activities of one segment are generally, but not always, focused on its
own target market.
Chart C02 provides an overview of the core competencies of the individual segments.
C02 Core competencies in the segments
Core competencies Automotive Green
Industrial Power
Power Sensor
Systems
Connected
Secure Systems
Sensor technologies ✓ ✓
Radio frequency ✓ ✓
Embedded control ✓ ✓ ✓
Control of
power semiconductors ✓ ✓ ✓ ✓
Power semiconductors ✓ ✓ ✓
Memories for
specific applications ✓
Connectivity ✓ ✓
Security ✓ ✓
Software ✓ ✓ ✓ ✓
A detailed presentation of the applications and product range of the individual
segments is given in the chapter “Applications and product range”. p. 180 ff.
Infineon | Annual Report 2023
24
Further information
Consolidated Financial Statements
Management Board and Supervisory Board Combined Management Report
Business model
The segments
ATV
ATV GIP
GIP PSS
PSS CSS
CSS
26.
ATV Automotive
The Automotivesegment shapes the future of mobility with products and solutions
to make cars clean, safe and smart. We cover all application areas in the vehicle: pow-
ertrain and energy management, connectivity and infotainment, body and comfort
electronics, safety and data security. Infineon is the world market leader in semicon-
ductor solutions for cars. Our range of products and solutions helps to navigate the
transition from internal combustion engines to hybrid and electric drives, enabling
an ever-increasing degree of automated driving, electric-electronic (E/E) vehicle
architecture, greater connectivity and digitization, and a higher level of data security
in vehicles. We also offer our customers innovative solutions in the areas of safety,
digital cockpit, infotainment, comfort and lighting technology. In addition to sensors,
microcontrollers, software solutions, a reliable power supply, memories for specific
applications and power semiconductors based on Si and SiC, our product portfolio
also comprises components for human-machine interaction and vehicle connectivity.
GIP Green Industrial Power
The Green Industrial Power segment specializes in semiconductor solutions for the
intelligent management and efficient conversion of electric energy along the entire
conversion chain, comprising the generation, transmission, storage and use of electri
city. The product portfolio comprises mainly IGBT power transistors and the driver
ICs to control them, as well as power semiconductors based on SiC. We offer products
in the Green Industrial Power segment, whether Si-based or SiC-based, in various
form factors and with different levels of functionality. The segment’s broad application
spectrum includes motor control units for industrial manufacturing and building
technology, inverters for photovoltaic and wind power systems, major home appliances,
traction, electric utility vehicles (such as buses and construction and agricultural
vehicles), systems for high-voltage direct current transmission and energy storage,
industrial power supplies and the charging infrastructure for electric vehicles.
Infineon | Annual Report 2023
25
Further information
Consolidated Financial Statements
Management Board and Supervisory Board Combined Management Report
Business model
The segments
27.
PSS Power Sensor Systems
The Power Sensor Systems segment encompasses a wide selection of technologies
relating to power semiconductors, radio frequency and sensors. We use these tech-
nologies to make electronic devices like power supplies, power tools, lighting systems,
mobile devices and industrial and consumer applications smaller, lighter and more
energy-efficient, as well as to develop new functionalities. We are drawing on the
next generation of new, innovative solutions based on Si, SiC and GaN for applications
in the areas of 5G, data centers, power supplies and adapters, battery-powered devices,
and renewable energy. Our portfolio of products for power supplies, comprising con-
trol ICs, drivers and MOSFET power transistors, addresses the two key requirements
of the market: efficiency and power density. Infineon is the clear market leader in
the global Si MOSFET market. Our high-precision sensor solutions give IoT devices
“human senses”, enabling them to react intuitively to their surroundings. The port
folio is rounded off with USB controllers and radio frequency products such as RF
antenna switches, RF power transistors and low-noise amplifiers.
CSS Connected Secure Systems
The Connected Secure Systems segment supplies comprehensive systems for a
secure, connected world based on reliable, game-changing microcontrollers and
wireless connectivity and security solutions. In particular, we offer microcontroller
solutions, Wi-Fi and Bluetooth solutions and combined connectivity solutions
(known as combo chips), along with hardware-based security technologies and an
efficient software environment for the programming and configuration of the micro-
controllers and connectivity components that cover many application areas. These
include devices for IoT applications, connected home appliances and smart home
appliances, IT equipment, consumer electronics, cloud security and connected vehicles,
as well as credit and debit cards, electronic passports and national identity cards.
With our technologies in the areas of computing, connectivity and security, we are
contributing significantly towards ensuring that current and future connected systems
are reliably protected.
Infineon | Annual Report 2023
26
Further information
Consolidated Financial Statements
Management Board and Supervisory Board Combined Management Report
Business model
The segments
28.
Long-term growth trends
Asa leading global provider of semiconductor solutions, Infineon focuses its business
activities on two issues that are fundamental to society and where it sees major long-
term growth trends: decarbonization and digitalization.
Decarbonization
Decarbonization is a necessity to contain global warming and therefore the key respon
sibility of humanity over the next decades. We will need to make drastic changes to
the ways in which we generate, transport, store and use energy. To halt global warm-
ing, it is imperative that we waive the use of fossil fuels to a great extent and that we
make a consistent transition to renewables and widely adopt electrification. Effecting
this transition requires not only the use of wind and solar power but also of systems
for the storage and efficient transportation of energy. We believe that one of the key
tasks for Infineon is to provide semiconductor solutions for more efficient generation,
conversion and use of electric energy. Our business operations are thereby making a
significant contribution to the quality of life of generations to come.
Digitalization
Digitalization is another key trend. This involves connectivity between ever-smarter
devices with an ability to perceive their environment; devices that make life easier,
safer and more pleasant. The possibilities are huge: greater convenience and security
in the smart home, more efficiency in manufacturing, higher productivity together
with better environmental sustainability in farming, and new services to support older
people. Infineon’s products in these areas include microcontrollers with software
and sensors that make it possible to produce connected and smart IoT devices with
increasing performance in both the industrial sector and the end user sector.
Infineon sees itself as a trailblazer for a carbon-neutral and digital future: “Driving
decarbonization and digitalization. Together.” This applies to large parts of our
portfolio. Sensors record mostly analog information from the world around us and
transform it into digital data; microcontrollers process these data and generate
control
signals; memory ICs enable the microcontrollers to store data and program
codes; actuators such as power semiconductors convert the control signals into actions
and make the efficient generation and conversion of energy possible; security solu-
tions protect the integrity of devices and data, while connectivity chips transfer these
data within the digital world. Software enhances the benefit to customers of our semi
conductor solutions, allowing for more flexible adjustment. We thereby establish a link
between the real world and the digital world and enable a carbon-neutral future.
Strategic targets
To generate value from decarbonization and digitalization for our customers, the
company, our shareholders and society with our semiconductor solutions, we pursue
clear and
measurable strategic targets.
Profitable growth
We want to continue to grow in the markets in which we operate and to increase our
profitability. Our long-term financial targets reflect this aspiration and apply over the
semiconductor cycle. At the beginning of the 2023 fiscal year, we revised our target
operating model and significantly raised our long-term financial targets. This reflects
Infineon’s success over the past few years and, at the same time, is an expression
of our greater ambitions, especially with regard to profitability and value generation.
We want to create even more value by focusing consistently on the long-term growth
trends of decarbonization and digitalization and implementing our strategic guidelines
(see the chapter “Strategic guidelines”, p. 29 ff.).
Group strategy
Infineon | Annual Report 2023
27
Further information
Consolidated Financial Statements
Management Board and Supervisory Board Combined Management Report
Group strategy
Long-term growth trends | Strategic targets
29.
Target 1: Averageannual revenue growth of
more than 10 percent over the cycle
We hold leading positions in our core markets and have expanded systematically
over the years into new and adjacent markets. Our four segments focus on the
long-term growth trends of decarbonization and digitalization. With our strategic
approach “Product to System”, we use our extensive technological and product
expertise to provide more comprehensive solutions and thus create more value for
our customers. In the areas of electromobility, advanced driver assistance systems
(ADAS), renewable energy, data center/AI and IoT in particular, we expect to achieve
above-average growth, resulting in total average annual revenue growth for the
Group over the cycle of more than 10 percent (“10%”).
Target 2: Average Segment Result Margin of
25 percent over the cycle
A key criterion for our success is sustainable profitability. Infineon can consistently pur-
sue its targets even in weaker market phases by engaging in economic activity that
is sustainably profitable. We have set ourselves the target of achieving an average
Segment Result Margin of 25 percent over the cycle. Key elements that will enable
us to achieve our profitability target are our system solutions, which are based on our
strategic approach “Product to System”, and generate higher value and greater cus-
tomer benefit. In the future, software will play a larger role. We enjoy economies of scale
and cost advantages while continuing to develop our leading market position and
innovative manufacturing technologies (such as those used to produce 300-millimeter
thin wafers) and accelerating the expansion of silicon carbide manufacturing facili-
ties. At the same time, we make sure that, if we consider our overall portfolio, all our
businesses are making an adequate contribution to Infineon’s success. We also aim
to ensure that our research and development expenses as well as our selling, general
and administrative expenses increase at a slower rate than the rate of growth in our
revenue. This is supported by our digitalization strategy.
Target 3: Adjusted Free Cash Flow within a range of
10 to 15 percent of revenue over the cycle
Looking at value generation, we include a Free Cash Flow target in our target operating
model. Free Cash Flow, adjusted for large investments in frontend buildings as well
as large MA transactions (acquisitions and disposals), should fall within a range of
10 to 15 percent of revenue over the cycle. This will be achieved by ensuring our oper-
ating cash flow grows at a faster rate in the long term than our investment expenditure.
Capital structure targets
Our capital structure targets link together the concepts of environmental and economic
sustainability and ensure that Infineon remains a trusted partner in the long term.
An investment grade rating is the key element of Infineon’s conservative financial
policy. From this cornerstone, we derive our long-term capital structure targets, which
consist of a liquidity target and a leverage target.
Our liquidity target is €1 billion, plus at least 10 percent of revenue. The fixed base
amount of €1 billion provides a solid liquidity reserve for contingent liabilities and
pension liabilities, which are unrelated to revenue. The additional amount of at least
10 percent of revenue means that we always have access to sufficient cash to be
able to finance our operating business and investment throughout all phases of the
semiconductor cycle.
Our leverage target is expressed as an upper limit on gross financial debt of two times
EBITDA. Infineon defines EBITDA as earnings from continuing operations before inter-
est, taxes, depreciation and amortization.
Infineon | Annual Report 2023
28
Further information
Consolidated Financial Statements
Management Board and Supervisory Board Combined Management Report
Group strategy
Strategic targets
30.
Sustainable corporate governance
Weare convinced that economic success must go hand in hand with environmental
and social commitment. This includes contributing towards more sustainable devel-
opment in society. With our products, solutions and systems, we are enabling greater
efficiency and making an active contribution towards climate protection. Sustain
ability is of crucial importance both within the Group and in relation to our supply
chains. We manage Infineon sustainably and are committed to acting sustainably
for the benefit of society. Making a contribution towards containing global warming
forms part of our mission. We have therefore set ourselves the target of becoming
carbon-neutral by the end of the 2030 fiscal year; by 2025, our emissions are to be
reduced by 70 percent compared with 2019. This target relates to Infineon’s own
greenhouse gas footprint and includes not only all direct emissions but also indirect
emissions from electricity and heat. Already by the end of the 2023 fiscal year, our
scope 1 and scope 2 emissions were 56.8 percent below the emissions for the base
year 2019. The development of intelligent exhaust air abatement systems, the
purchase of electricity from renewable sources and the implementation of energy
efficiency schemes have all contributed to this reduction.
Our other sustainability activities are described in the separate report “Sustainability
at Infineon”. This report, including the summarized separate Non-Financial Report,
which is based on the requirements set out in the German CSR Directive Implementa-
tion Act, can be downloaded from the internet at www.infineon.com/csr_reporting.
Strategic guidelines
To achieve our strategic targets, we rely on a number of strategic guidelines to ensure
sustainable corporate governance and profitable growth.
“Product to System” (P2S) and software
With our approach “Product to System” (P2S), we are fostering our leading positions
in the area of power systems and IoT. P2S helps us to better adapt our solutions and
products to customer requirements. We understand new trends early on and can
develop innovative approaches together with our customers. As a result, our custom-
ers can realize sustainable benefits, among others, in terms of systems performance,
system costs and development time.
For this to succeed, we have to understand the environment in which our customers’
products are used, how these products are embedded in larger systems, with which
other devices the products interact, what requirements they have to fulfill and what
function they are intended to perform. We also have to consider which other active
and passive components and control concepts they use and what capabilities our custo
mers themselves contribute to the value creation process. Equipped with this know
ledge, we can make the most of our competencies. We want to translate the technolo
gically possible into marketable products that provide the greatest possible benefit
to our customers. This helps us to continue to develop leading positions in our markets.
Infineon | Annual Report 2023
29
Further information
Consolidated Financial Statements
Management Board and Supervisory Board Combined Management Report
Group strategy
Strategic targets | Strategic guidelines
31.
In the contextof P2S, software is playing an increasingly significant role. We have
intensified our activities in this area in recent years through our own organic growth
and strategic partnerships, as well as through the acquisitions of Cypress, Industrial
Analytics and Imagimob. This means that we have at our disposal an entire ecosystem
comprising software components and a development environment, as well as refer-
ence designs, product support, blogs, a developer community and online tutorials.
An important element of this ecosystem is the ModusToolbox™ development environ-
ment. This includes reusable firmware that makes it easier for customers’ developers
to program microcontrollers and Wi-Fi and Bluetooth components. With software,
we enable smaller customers in particular to make even better use of our products
and thus increase our profitability.
Technology leadership and customer-focused
innovation
In accordance with our strategic approach of thinking in application trends, our
developers identify challenges early, together with our customers. This enables us to
fulfill the promise of technological leadership. Through close cooperation, we learn
to understand applications better, allowing us to identify future trends at an early
stage and develop products that are tailored accordingly. In this way, we can offer
our customers either individual components or complete solutions, including the
necessary software, depending on their requirements.
We are continuing to enhance our leading technological position and expertise in our
core markets through radical and customer-focused innovation. As a result, we are
strengthening our core business and identifying long-term growth opportunities in
adjacent business areas. As one of the market leaders in the field of power electronics,
we began researching new materials such as silicon carbide and gallium nitride at an
early stage, building up our expertise, and we are constantly broadening our product
portfolio in order to generate added value for our customers.
From a technological perspective, compound semiconductors are of particular impor-
tance. Whereas most semiconductor components to date have been based on pure
silicon, silicon carbide and gallium nitride are two chemical compounds with physical
properties, in particular a wide band gap, that make it possible to produce semi
conductors with even greater performance. These compounds allow for particularly
efficient electric switches in the smallest space; for example, they make efficient charg
ing stations for electric vehicles much more compact, allowing them to be installed
in more places. We consider a strong position in compound semiconductors essential
to reinforcing our leading position in power semiconductors and, thereby, in power
systems. The acquisition of GaN Systems Inc., which was successfully completed after
the end of the past financial year on 24 October 2023, will make a significant contri-
bution to this. The Ottawa (Canada)-based company contributes a broad portfolio of
GaN-based energy conversion solutions and first-class application expertise.
Value creation through differentiating in-house
manufacturing and high quality
We are continuing to expand our in-house manufacturing in areas in which we create
added value for the customer and differentiation for Infineon. Thus, we manufacture
products in our own fabs when doing so means that our customers benefit from lower
cost, higher performance or improved availability. This has been the case until now,
for example, for power semiconductors and sensors. Customers are increasingly recog
nizing the competitive advantage offered by our in-house manufacturing by entering
into long-term supply contracts and capacity reservation arrangements. Some cus-
tomers make multi-year advance payments that support the cashflow during times of
investments to expand production capacity. However, where manufacturing in our
own fabs offers no additional customer benefit or opportunity to differentiate our-
selves from the compe
tition, we work together with contract manufacturers. This is
predominantly the case for highly integrated digital products such as microcontrollers,
connectivity components and security ICs, where the differentiation arises mainly
Infineon | Annual Report 2023
30
Further information
Consolidated Financial Statements
Management Board and Supervisory Board Combined Management Report
Group strategy
Strategic guidelines
32.
from the designand the
software. To ensure and improve our delivery capability, even
in times of scarce pro
duc
tion capacity in standard technologies, we have signed sup-
ply agreements with our contract manufacturers, sometimes covering a period of
several years.
Our 300-millimeter thin wafer manufacturing technology for power semiconductors
is a clear indication of the value of differentiating manufacturing in our own fabs:
As pioneers of this technology, the scale of manufacturing we have now reached
allows us to achieve significant economies of scale. Compared with manufacturing
on 200-millimeter wafers, we benefit from significantly lower costs and lower
capital investment. This has enabled us to maintain our lead: With the factory at
the
Villach site (Austria), together with our 300-millimeter manufacturing facility
in Dresden (Germany), we have established a closely coordinated manufacturing
network across the two sites. In line with our “One Virtual Fab” concept, we are
using the same processes, equipment, and automation and digitalization concepts
in Villach and in Dresden. This generates economies of scale, but it also benefits
the customer, as we have the flexibility to shift production volumes between the
sites. We are applying a similar concept in the area of compound semiconductors
between our sites in Villach and Kulim (Malaysia). The third module under construc-
tion in Kulim is also able to generate synergies with the existing 200-millimeter pro-
duction infrastructure.
Expanding our capacity in line with expected market trends over the cycle has proved
very effective and forward-thinking. For this reason, we have now decided to extend
the third module significantly beyond its original specifications, creating the world’s
largest and most competitive manufacturing facility for silicon carbide semiconductors,
reflected in a particularly efficient production landscape and substantial economies
of scale. We are also expanding our site in Dresden as planned to include an additional
300-millimeter module for analog mixed-signal products as well as power semicon-
ductors. These can be used in a wide variety of applications, such as data centers,
auto
motive and IoT. The new factory combines the two growth areas, decarbonization
and digitalization, and is designed to meet demand from our customers in the second
half of the decade.
Our supply chains and our production are both particularly resilient. Our manufacturing
facilities are spread across all major regions of the world, and our contract manufac-
turer and supplier base is broadly diversified. The investment in a production company
in Germany (European Semiconductor Manufacturing Company, ESMC), which will
be founded under the leadership of TSMC (Taiwan Semiconductor Manufacturing
Company) and in which Infineon will hold a 10 percent stake, will play an important
role in the geographical diversification of the supply chains.
High quality and reliability are key values for us, differentiating us from our competitors.
Therefore, quality plays a key role in the lifecycle of an Infineon product – from its
development and production to its supply and product-related services. Infineon is
certified worldwide in accordance with the leading quality standards and has an
efficient management system.
In addition, clearly defined quality principles provide guidance for our employees.
These principles have the overriding aim of honoring the pledges we have made
to our customers relating, among other things, to product functionality and reliabil-
ity. To achieve this, we attach great importance to understanding our customers’
concerns and clearly defining their product requirements. Honoring our pledges is
an essential guiding principle that is also reflected in the in-house cooperation we
see at Infineon.
Tried-and-tested processes, methods and tools, together with continuous improve-
ment programs, form the basis for the high priority Infineon attaches to quality.
Our quality departments are embedded in the global organization. Regular events
such as Quality Days at our global sites promote a greater awareness of quality,
with the result that all Infineon employees are responsible for honoring our quality
pledge within their own sphere of responsibility.
Infineon | Annual Report 2023
31
Further information
Consolidated Financial Statements
Management Board and Supervisory Board Combined Management Report
Group strategy
Strategic guidelines
33.
Portfolio management andinorganic growth
We conduct regular reviews to ascertain whether our operations, both individually and
as part of our overall portfolio, make an appropriate contribution to the success of
Infineon. This enables us to target the use of our financial resources and, as a result,
to continue to improve our profitable growth. We consider individual operations
from various points of view, such as value creation, current and expected market posi-
tion, significance to the customer and risk assessment. On this basis, we decide the
extent to which we will invest in or divest an operation. Growth prospects and prof
itabil
ity are mutually dependent here, with profitability enabling investment and
ensuring sustainable innovation and growth as a result.
We will continue to supplement our organic growth in the future with selective acquisi-
tions. These acquisitions will need to fulfill three criteria: a) be strategically beneficial
based on the portfolio process, b) be financially advantageous and c) be a good cultural
fit. A purchase must strengthen Infineon’s market position in accordance with our
strategic focus, usefully complementing our range of competencies. The corporate
culture of any potential acquisition must be a good fit with Infineon’s culture or must
add valuable elements.
A pioneer of digitalization
An important topic for us is Infineon’s digital transformation, which we are driving
forward using a strategic roadmap. As a global semiconductor manufacturer, we
benefit from the digital transformation in two ways: on the one hand, as a provider
and, on the other, as a user of digital solutions. As a provider, we use digitization
and efficient platforms to support our customers in the best possible way throughout
the customer relationship and the development process. We are constantly optimiz-
ing and expanding our website and web content, and it is important for us that all
product-related information and support services are easily accessible.
The accompanying software products and digital services are increasingly being pro-
vided using appropriate licensing models via our digital customer interfaces, such
as the Infineon Developer Center. A major focus is on scaling up technical support, so
that, even in fragmented markets, we can provide support to customers during their
product choice and design-in. The Infineon Developer Community offers round-the-clock
technical support to all customers and continues to expand and improve by learning
from customer queries and customer experience. With the specific usage of AI-based
methods, we enable even better support for our customers through the use of power-
ful generative language models. This makes access to our resources faster and easier.
We will therefore continue to expand the AI-based portion in the next few years. This
is a particularly efficient way for us to ensure that customers use our products and,
indeed, use them in a more effective and targeted way.
As a user, we also use digitization to optimize our internal processes and make them
as efficient and future-proof as possible. So, for example, we connect our sites and
contract manufacturers in accordance with Industry 4.0 in a virtual manufacturing net
work. In sales and marketing, we use applications based on methods for analyzing
big data that enable us to provide our customers with targeted personal and increas-
ingly customized support via our digital platforms. In addition, we evaluate customer
behavior and customer requirements in a structured way and incorporate these results
into the development of our solutions and products. In manufacturing, we are focus-
ing to a greater extent on a high level of automation and the increasing use of artificial
intelligence methods in order to continue to improve our productivity and quality. In
all of these areas, we systematically analyze which processes can be further improved
and optimized through the use of generative AI language models.
As part of our digital roadmap, we are focusing on the rapid implementation of
projects. When selecting projects, we are guided by the direct value contribution to
improving the customer experience through efficiency or productivity gains and
by their function as the necessary basis for future digitization initiatives.
Infineon | Annual Report 2023
32
Further information
Consolidated Financial Statements
Management Board and Supervisory Board Combined Management Report
Group strategy
Strategic guidelines
34.
Human resources strategy
Ourhuman resources (HR) strategy is a key component of Infineon’s success. It sup-
ports us in our efforts to achieve our growth and profitability targets and enables us to
successfully navigate our way through varying economic phases and challenges. Our
HR understanding is “People create value. Engagement drives people”. Our overriding
objective is to foster our employees’ engagement and to take targeted measures to
achieve this. When employees are enthusiastic about their job, have the relevant skill
sets, and can take advantage of suitable opportunities for continuing professional
development, the outcome is a higher level of creativity, productivity and innovation,
as well as better results. We use regular pulse checks of our employees worldwide
to measure their level of engagement and thus keep our finger on the pulse of their
needs, enabling Infineon to make continuous progress.
We consider it our responsibility to contribute to addressing the key societal challenges.
Decarbonization and digitalization are having an impact not only on our world but
also on the future of work. From this, we derive the key action areas of our HR strategy.
Our main focus is on
1) attracting the best talent in the market, optimizing the onboarding process,
developing internal talent and keeping it loyal to Infineon,
2) continuing to drive digitalization and standardization forward in HR and
positioning ourselves in a scalable way to support Infineon’s growth,
3) strengthening hybrid working where possible and practical,
4) pushing ahead with leadership development programs as well as employee
training and skill enhancement, and
5) strengthening the area of organizational development in order to be prepared
for further growth and to promote the desired internal cultural change (SPIRIT).
People are the main focus of our activities, as dedicated, healthy, successful employees
are key to maintaining and improving our market-leading position, thereby creating a
successful future for us all.
Further information, including detailed statistics, is available in the HR Report 2023
and the 2023 Sustainability Report.
www.infineon.com/hrreport
www.infineon.com/csr_reporting
Infineon | Annual Report 2023
33
Further information
Consolidated Financial Statements
Management Board and Supervisory Board Combined Management Report
Group strategy
Human resources strategy
Research and developmentexpenses were €1,985 million in the 2023 fiscal year,
compared with €1,798 million in the previous year. This increase of €187 million, or
10 percent, was less than the increase in revenue. Accordingly we invested 12.2 percent
of revenue in research and development in the 2023 fiscal year, compared with
12.6 percent in the previous year. Capitalized development costs in the 2023 fiscal year
were €214 million (previous year: €209 million). The amortization of capitalized devel
opment costs in the 2023 fiscal year was €93 million (previous year: €94 million). Sub-
sidies and grants received for research and development increased from €113 million
in the 2022 fiscal year to €130 million in the 2023 fiscal year.
At the end of the 2023 fiscal year, Infineon employed 12,830 people (22 percent of the
total workforce) in research and development worldwide. Of these, 1,645 worked on
software. At the end of the 2022 fiscal year, 12,005 people were employed by Infineon
in research and development worldwide (21 percent of the workforce). The number of
research and development sites in the 2023 fiscal year was 69 (2022: 64) in 25 countries.
Infineon’s research and development activities are in accord with its strategy of con-
tinuing to strengthen its leading technological position through customer-focused
innovation. Research and development activities therefore concentrate on continuing
to improve our power semiconductors, with a particular focus on the use of new
materials such as silicon carbide and gallium nitride. Important development goals
are to improve efficiency and increase power density while at the same time main-
taining a high level of reliability.
Research and development activities are also focused on the digitization of products
and solutions as an essential prerequisite for the implementation of our P2S strate-
gic approach. The opportunity to offer customers all-in-one solutions is particularly
impor
tant and provides them with benefits in terms of system performance, system
costs and development time. The main development fields here are microcontrollers,
connectivity and security solutions, and software.
Artificial intelligence (AI) methods are being used in a wide variety of applications
to improve products and processes. In the field of edge computing, for example,
AI is used in combination with our smart sensors and microcontrollers to classify
tone, key words or gestures to enable the adoption of new and innovative approaches
in human-machine communication. In addition, AI supports many processes such
as chip design, marketing and production.
We are also addressing longer-term future-related topics in areas such as quantum
computing and post-quantum cryptography.
Patents
Another indication of Infineon’s innovative power and long-term competitiveness is
the number of our patents. In the 2023 fiscal year, we applied for around 1,850 patents
worldwide (previous year: around 1,700). In addition to patent applications and
expirations, there were changes in the portfolio due to regular strategic patent port-
folio adjustments. Maintenance of the patent portfolio is carried out on a regular
basis. This has resulted, along with new patent applications for inventions, in a signi
f
icant increase in the relevance of the patents, as highlighted again by LexisNexis®
and Clarivate® in their innovation reports. At the end of the 2023 fiscal year, the world
wide patent portfolio comprised around 29,700 patents and patent applications
(previous year: around 29,600).
12.2%
12.6%
1,798
1,985
C03 RD expenses
€ in millions
RD expenses
Percentage of revenue
2023
2022
Infineon | Annual Report 2023
35
Further information
Consolidated Financial Statements
Management Board and Supervisory Board Combined Management Report
Research and development
37.
RD sites andapplication centers
Sites 10 employees.
Europe, Middle East, Africa
Austria
1 Graz
2 Klagenfurt
3 Linz
4 Villach
Denmark
5 Herlev
France
6 Le Puy-Sainte-
Réparade
Germany
7 Augsburg
8 Dresden
9 Duisburg
10 Erlangen
11 Ilmenau
12 Langen
13 Neubiberg
14 Regensburg
15 Soest
16 Warstein
Hungary
17 Budapest
18 Cegléd
Ireland
19 Cork
20 Dublin
Israel
21 Netanya
Italy
22 Padua
23 Pavia
Netherlands
24 Nijmegen
Romania
25 Braşov
26 Bucharest
27 Iaşi
Serbia
28 Belgrad
UK
29 Bristol
30 Redhill
Ukraine
31 Lviv
15
12
Americas
Mexico
1 Guadalajara
2 Tijuana
USA
3 Andover, MA
4 Austin,TX
5 Chandler, AZ
6 Colorado Springs, CO
7 El Segundo, CA
8 Irvine, CA
9 Leominster, MA
10 Lexington, KY
11 Lynnwood, WA
12 Morrisville, NC
13 Murrieta, CA
14 Portland, OR
15 San Diego, CA
16 San José, CA
17 Warwick, RI
Asia-Pacific
India
1 Bangalore
Indonesia
2 Batam
Korea
3 Cheonan
4 Seoul
Malaysia
5 Ipoh
6 Kulim
7 Melaka
8 Penang
Philippines
9 Muntinlupa
Singapore
10 Singapore
Thailand
11 Nonthaburi
Greater China
Mainland China
12 Chengdu
13 Shanghai
14 Shenzhen
15 Wuxi
16 Xi’an
Taiwan
17 Hsinchu
18 Taipeh
Japan
19 Nagoya
20 Sendai
21 Tokyo
7
4
2
1
31
9
6
7
2
18
14
3
21
29 30
5
27
8
16
15
24
6
23 22
13
19
20
1
8
20
19
4
13
17
10
3
11
18
10
25
26
28
14
16
12
11
9
17
21
5
11
2
17
8
15
7
9
6
1
10
12
3
4
16
14
5
13
Infineon | Annual Report 2023
36
Further information
Consolidated Financial Statements
Management Board and Supervisory Board Combined Management Report
Research and development
38.
The internal managementsystem at Infineon is designed to help implement Group
strategy and the related long-term financial targets. Accordingly, performance indica-
tors are used that enable profitable growth and efficient employment of capital to
be measured.
Overall, the achievement of our long-term financial targets will lead to a sustainable
increase in the value of Infineon by generating a permanent premium on the cost
of capital.
In this context, growth, profitability, liquidity and investments are all interdependent.
Profitability is the prerequisite for being able to finance operations internally, which,
in other words, means opening up potential opportunities for growth. Growth, in turn,
requires continual investment in research and development as well as manufactur-
ing capacities. Growing at a commensurate rate enables Infineon to achieve leading
market positions and generate economies of scale that contribute to greater profit-
ability. Employing financial resources efficiently is a critical factor in achieving these
goals.
Infineon deploys a comprehensive controlling system to manage its business with
respect to the strategic targets it has set itself. The system involves the use of financial
and operating performance indicators. Information for controlling purposes is derived
from annual long-term planning, quarterly outlooks, actual monthly data and infor-
mation available with even greater frequency, such as the volume of orders received.
This knowledge enables management to base its decisions in a timely manner on
sound information about the current situation and future expected financial and
operational developments.
Sustainable business practices and the consideration of forward-thinking qualitative
factors are important for Infineon’s long-term success. As an enterprise very much aware
of its responsibilities towards society, Infineon also takes account of non-financial
factors, mainly in relation to the environment and employee diversity. See the report
“Sustainability at Infineon” on our website www.infineon.com/csr_reporting
As part of the process of managing business performance, management also attaches
great importance to ensuring that Infineon acts in strict compliance with legal require
ments and that it also complies with its internal corporate governance standards (see
the chapter “Corporate Governance”, p. 82 ff.).
Performance indicators
Principal performance indicators
In order to measure its success in implementing its strategy, Infineon uses the follow-
ing three principal performance indicators:
›
Segment Result Margin/Segment Result,
›
Free Cash Flow from continuing operations, and
›
Return on Capital Employed (RoCE).
These financial performance indicators are also the cornerstones of the system for vari-
able remuneration. Most of the variable salary components pertaining to employees
and management are directly linked to these performance indicators.
Segment Result Margin/Segment Result
Segment Result Margin/Segment Result is the key figure used by the Group to measure
operating performance (for an analysis of the development of the Segment Result
Margin/Segment Result of Infineon and of the individual segments in the 2023 fiscal
year, see the chapter “2023 fiscal year” p. 42 ff.). The Segment Result Margin is the
Segment Result expressed as a percentage of revenue and is a measure of the profit-
ability of revenue and the success of Infineon’s operating business. The activities
of the segments are managed on the basis of the Segment Result Margin/Segment
Result. Responsibility for optimizing the Segment Result Margin/Segment Result
within the framework of the Group strategy (as approved by the Management Board)
rests with the management teams of the relevant segments, acting, however, in
close coordination with the Management Board.
Internal management system
Infineon | Annual Report 2023
37
Further information
Consolidated Financial Statements
Management Board and Supervisory Board Combined Management Report
Internal management system
39.
Segment Result isdefined as follows:
Operating profit, adjusted for:
Certain reversal of impairments (impairments) (in particular on goodwill)
Gains (losses) on earnings of restructuring and closures
Share-based payment
Acquisition-related depreciation/amortization and other expenses
Gains (losses) on sales of businesses, or interests in subsidiaries
Other income and expenses
= Segment Result
Free Cash Flow
Free Cash Flow measures the ability to generate sufficient cash flows to finance day-to-
day operations and to fund required investments out of the ongoing business. It is
Infineon’s stated target to sustainably generate positive Free Cash Flow (for an expla-
nation of changes in Free Cash Flow during the 2023 fiscal year, see the chapter
“Review of liquidity”, p. 55 f.). Free Cash Flow is managed by Infineon at Group level
only and not at segment level.
The main factors influencing Free Cash Flow are a positive earnings trend combined
with effective management of inventories, trade accounts receivable and payable,
and capital expenditures.
Free Cash Flow at Infineon is defined as follows:
Cash flows from operating activities from continuing operations
+ Cash flows from investing activities from continuing operations
+ Purchases of (proceeds from sales of) financial investments, net
= Free Cash Flow
Return on Capital Employed (RoCE)
The performance indicator RoCE measures the return on capital and shows the corre
lation between profitability and the capital resources required to run the business
(for the mathematical derivation and development of RoCE in the 2023 fiscal year, see
the chapter “Review of financial condition”, p. 54). RoCE describes how efficiently
a company uses its resources and, through the comparison with cost of capital, serves
as an instrument for value-based corporate management. It is also analyzed by Infineon
at Group level only and not at segment level.
RoCE is defined as follows:
Operating profit, plus/minus:
Financial result excluding interest result
Share of profit (loss) of associates and joint ventures accounted for using the equity method
Income taxes
= Operating profit from continuing operations after tax 1
Assets, plus/minus:
– Cash and cash equivalents
– Financial investments
– Assets classified as held for sale
– Total current liabilities
+ Short-term financial debt and current maturities of long-term financial debt
+ Liabilities classified as held for sale
= Capital employed 2
RoCE 1 / 2
Infineon | Annual Report 2023
38
Further information
Consolidated Financial Statements
Management Board and Supervisory Board Combined Management Report
Internal management system
40.
Selected supplementary performanceindicators
The principal performance indicators are supplemented by the following additional
performance indicators.
Growth and profitability indicators
Since the three principal performance indicators, especially Segment Result/Segment
Result Margin, positively correlate with revenue growth, the latter is not used as a
principal performance indicator in its own right but is covered by the three performance
indicators indirectly.
In order to analyze operating profitability in detail, the result and cost block compo-
nents of the Segment Result are considered. These are gross profit, research and
development expenses, and selling, general and administrative expenses, as well as
their relation to revenue.
These indicators are analyzed both at Group level and at segment level (for changes
in these indicators for the Group in the 2023 fiscal year, see the chapter “Review of
results of operations”, p. 49 ff.).
Liquidity performance indicators
A rolling cash flow forecast helps ensure that Infineon has appropriate levels of liquidity
at its disposal and an optimal capital structure. Liquidity is managed only at Group
level, and not at segment level, using the following performance indicators:
›
Gross cash position: Cash and cash equivalents plus financial investments
› Net cash position: Gross cash position less short-term and long-term financial debt
› Investments: The total amount invested in property, plant and equipment and in
other intangible assets, including capitalized development costs
For an analysis of changes in these performance indicators during the 2023 fiscal
year, see the chapter “Review of liquidity”. p. 55 ff.
Non-financial performance indicators
Non-financial performance indicators at Infineon include CO2 emissions and indicators
relating to diversity.
Already at the 2020 Annual General Meeting, Infineon announced that it wanted to
become carbon-neutral by 2030. By 2025, Infineon would like to reduce its CO2 emis-
sions by 70 percent compared to the 2019 calendar year.
The degree of target achievement for these non-financial performance indicators
is also reflected in the remuneration of the Management Board (see the chapter
“Remuneration Report”, p. 86).
Actual and target values for performance indicators
The chapter “Outlook”, p. 62, contains a table comparing the actual values achieved
in the 2023 fiscal year for principal and selected supplementary performance indicators
with the values forecasted and the expectations for the 2024 fiscal year.
Infineon | Annual Report 2023
39
Further information
Consolidated Financial Statements
Management Board and Supervisory Board Combined Management Report
Internal management system
41.
Review of the
semiconductor
industry
40
Furtherinformation
Consolidated Financial Statements
Management Board and Supervisory Board Combined Management Report
Review of the semiconductor industry
Infineon | Annual Report 2023
42.
Review of theglobal economy in the
2022 and 2023 calendar year
Following exceptionally strong growth in the global economy in the 2021 calendar
year in the wake of the post-Covid recovery, growth returned to a more normal level
in the 2022 calendar year of 3.0 percent ( R01).
For the 2023 calendar year, experts at the International Monetary Fund (IMF) expect a
global economic growth of 2.5 percent ( R01). This would mean growth in the 2023
calendar year would be slightly below the long-term growth trend. The reasons for this
include the impact of the energy crisis, high rates of inflation, sharp increases in inter-
est rates, a drop in consumer and business confidence, and the unexpectedly slow
recovery of the Chinese economy after the removal of pandemic-related restrictions.
The growth figures relate to market size, translated into US dollars at market
exchange rates.
Review of the semiconductor market
in the 2023 fiscal year
Worldwide semiconductor revenue totaled €480 billion in the 2023 fiscal year. This was
13 percent lower than the figure for the 2022 fiscal year of €550 billion. Expressed in
US dollars, the decrease was 14 percent ( R02). This was mainly due to the significant
fall in demand in the computing, smartphone and consumer market segments, with
a double-digit contraction in revenue in some areas ( R03).
Revenue in Infineon’s reference market (i.e., the market for semiconductors exclud-
ing DRAM and NAND flash memory chips and microprocessors) was €364 billion in
the 2023 fiscal year, 1 percent less compared with €367 billion in the 2022 fiscal year.
Expressed in US dollars, the decrease was 2 percent ( R02). The relatively steady
performance in the Infineon reference market was primarily due to the automotive
and industrial market segments, in which growth was driven by the decarbonization
and digitalization trends. Semiconductor content in vehicles increased, partly as a
result of growing demand for electric vehicles, comfort features and efficient driver
assistance systems. Growing demand for semiconductors was also evident again in
the renewable energy sector ( R03).
Market position
In the 2022 calendar year, Infineon was ranked in 13th place in the global semiconduc-
tor market, with a market share of 2.6 percent. In the Infineon reference market,
Infineon ranked in seventh place worldwide in the 2022 calendar year, with a market
share of 4.0 percent. This puts Infineon in second place among European semicon-
ductor manufacturers in both markets ( R04).
In the first nine months of the 2023 fiscal year, Infineon achieved a market share of
3.4 percent in the global semiconductor market and was ranked in 11th place. In the
Infineon reference market, Infineon achieved a market share of 4.7 percent in the
first nine months of the 2023 fiscal year and was ranked in sixth place. In the first nine
months of the fiscal year, Infineon was ranked in second place among European
semiconductor manufacturers in both markets ( R04). Data for the full 2023 fiscal
year was not yet available at the time this report was prepared.
Infineon | Annual Report 2023
41
Further information
Consolidated Financial Statements
Management Board and Supervisory Board Combined Management Report
Review of the semiconductor industry
43.
2023 fiscal year
Group
performance
42
Furtherinformation
Consolidated Financial Statements
Management Board and Supervisory Board Combined Management Report
2023 fiscal year
Group performance
Infineon | Annual Report 2023
44.
In the 2023fiscal year, Infineon has set new records for revenue and profitability. The
results are an initial confirmation of our more ambitious course we embarked on as a
company a year ago. Nevertheless, we find ourselves in an environment that continues
to present challenges. We are seeing different trends in our target markets. Structural
semiconductor growth in the areas of renewable energy, electromobility (especially
in China) and microcontrollers for the automotive industry remains unabated. In con-
trast, consumer, communication, computing and IoT applications are experiencing
a temporary period of low demand. Details about the performance of the segments
can be found in the chapter “Segment performance”. p. 44 ff.
Group revenue up by 15 percent
Infineon generated Group revenue of €16,309 million in the 2023 fiscal year, a 15 percent
increase on the previous year’s figure of €14,218 million. Around half the growth in
revenue was due to price increases and around half to higher volumes and product mix
adjustments. Continuing high levels of demand for semiconductors in the automotive
and renewable energy sectors, in particular, had a positive impact here. At the same
time, manufacturing capacity is continually being expanded. This was also the case
in the 2023 fiscal year at our sites in Villach (Austria), Dresden (Germany) and Kulim
(Malaysia). Production corridors of contract manufacturers also contributed to the
increase in revenue.In addition, there were positive exchange rate effects during
the reporting period.
Segment Result Margin of 27.0 percent achieved
Infineon improved its Segment Result by 30 percent from €3,378 million in the 2022
fiscal year to €4,399 million in the 2023 fiscal year. The main reasons for this were
price increases, higher volumes and improvements in the product mix. Moreover,
operating expenses rose at a lower rate than revenue. This was offset by higher idle
costs and write-downs on increased inventories.
Taking all this into account, the Segment Result Margin of 27.0 percent was signifi-
cantly higher than the figure for the previous fiscal year of 23.8 percent.
Details about Infineon’s two other principal performance indicators, Free Cash Flow
and RoCE, and about its other performance indicators can be found in the chapters
“Review of results of operations”, p. 49 ff., “Review of financial condition”, p. 53 f.,
and “Review of liquidity”, p. 55 ff..
Infineon | Annual Report 2023
43
Further information
Consolidated Financial Statements
Management Board and Supervisory Board Combined Management Report
2023 fiscal year
Group performance
45.
Segment
performance
Infineon | AnnualReport 2023
44
Further information
Consolidated Financial Statements
Management Board and Supervisory Board Combined Management Report
2023 fiscal year
Segment performance
ATV GIP CSS
PSS
46.
Review of theAutomotive segment
in the 2023 fiscal year
In the Automotive segment, Infineon generated revenue in the 2023 fiscal year of
€8,242 million, an increase of 26 percent compared with the figure for the previous
fiscal year of €6,516 million. The segment contributed 51 percent of Infineon’s Group
revenue.
Electromobility, driver assistance systems, software-defined vehicle architecture and
the trend towards higher levels of electronic features in vehicles continued to be the
main drivers of our growth in the 2023 fiscal year. Electromobility benefited not only
from purchase incentive schemes but also from the increasing availability of charging
stations, the wider range of models being produced by almost all vehicle manufacturers
and a change in attitude in society towards sustainable mobility.
Our business with microcontrollers developed particularly well. These include the
AURIX™, TRAVEO™ and PSoC™ families. The transition to new vehicle architectures by
many manufacturers, expanded driver assistance systems and the electrification of
vehicles ensured above-average demand. Our AURIX™ family was developed specifi-
cally for embedded control systems with the highest safety requirements and is there
fore used in addition to driver assistance systems for engine control, security and in
high-speed onboard networks. Real-time capability, high computing power and low
power consumption are the decisive characteristics. The TRAVEO™ family benefited
from the trend towards digital instrument and display systems. In addition, the delivery
situation at our manufacturing partners continued to improve in the past financial
year, which also had a positive impact on sales development.
Infineon was also able to benefit from the fact that electromobility, automated driving
and mobility services are increasingly requiring more powerful software. This software
needs to be updatable throughout the lifecycle of the vehicle. This flexibility, as well
as higher safety requirements for automated driving, require a new architecture for
onboard networks used for data transmission and power distribution. For the latter, in
particular, special safety-certified semiconductor solutions are used, replacing existing
fuses and relays. With PROFET™, Infineon offers an extensive portfolio of smart semi-
conductor switches. They enable decentralized configurable power distribution that
at the same time complies with the highest safety standard.
Moreover, during the reporting period, there was a further increase in comfort fea-
tures across all vehicle segments. Examples of these include retractable door handles,
electrically controlled seat adjustment, sun visors and tailgates. All these functions
require power switches, sometimes several per function, around a hundred on average
per vehicle. As Infineon has an extensive portfolio of semiconductor switches, it
achieved above-average growth in this area in the past fiscal year.
Higher prices also contributed to the increase in revenue.
We were able to win additional contracts worldwide for our microcontrollers and
power semiconductors, particularly for silicon carbide both in the power train and
onboard chargers as well as in DC-DC converters. We therefore anticipate achieving
significant increases in revenue in this area over the next few years.
The Segment Result in the 2023 fiscal year was €2,380 million, an increase of 60 percent
compared with the Segment Result for the previous fiscal year of €1,490 million. Based
on revenue, the Segment Result Margin was 28.9 percent (previous year: 22.9 perc
ent),
see C04. The increase in the Segment Result Margin was mainly due to positive price
effects, the higher level of revenue and improvements in the product mix.
ATV
8,242
2,380
6,516
1,490
C04 Revenue and Segment Result of the Automotive segment
€ in millions
Revenue
Segment Result
Segment Result Margin
2023
2022
28.9%
22.9%
Infineon | Annual Report 2023
45
Further information
Consolidated Financial Statements
Management Board and Supervisory Board Combined Management Report
2023 fiscal year
Segment performance
47.
Review of theGreen Industrial Power segment
in the 2023 fiscal year
In the Green Industrial Power segment, Infineon generated revenue in the 2023 fiscal
year of €2,205 million, an increase of 23 percent compared with the figure for the
previous fiscal year of €1,790 million. The revenue growth was the result of higher
volumes as well as positive price effects. The segment contributed 13 percent to
Infineon’s Group revenue.
Demand in the area of renewable energy remained high. The generation of clean energy
is an essential prerequisite for the achievement of global carbon emission targets.
Thanks to its strong market position in the area of renewable energy, Infineon was
able to benefit directly from this megatrend.
There was an increase in revenue from products for wind power as well as from PV
inverter products. In many regions of the world, solar and wind power are now the
cheapest way of generating electricity. Capacity is therefore being expanded accord-
ingly, especially in the form of utility-scale installations.
As the proportion of renewable energy in the energy mix continues to grow, so too
does the importance of storage solutions to stabilize the grids. The energy infrastruc-
ture business comprises the transmission, distribution and storage of energy, as
well as the charging infrastructure for electromobility and enjoyed strong demand.
Revenue in the fields of automation and electric drives benefited from demand in the
area of factory equipment and automation.
Revenue in transportation grew strongly from a weak basis. Besides the recovery
in trains, new business areas such as the electrification of buses, trucks and farm
machinery contributed to the improved result.
In home appliances, the revenue declined due to the weak construction activity in
China. The trend towards inverterized motor control systems continued but could not
compensate for the weak demand.
In the 2023 fiscal year, the Segment Result was €662 million, an increase of 72 percent
compared with the figure for the previous fiscal year of €384 million. As a result of the
growth in volumes and positive price effects, the Segment Result Margin improved from
21.5 percent in the 2022 fiscal year to 30.0 percent in the 2023 fiscal year, see C05 .
GIP
2,205
1,790
662
384
C05 Revenue and Segment Result of the Green Industrial Power segment
€ in millions
Revenue
Segment Result
Segment Result Margin
2023
2022
30.0%
21.5%
Infineon | Annual Report 2023
46
Further information
Consolidated Financial Statements
Management Board and Supervisory Board Combined Management Report
2023 fiscal year
Segment performance
48.
Review of thePower Sensor Systems segment
in the 2023 fiscal year
In the Power Sensor Systems segment, Infineon generated revenue in the 2023 fiscal
year of €3,798 million, a decrease of 7 percent compared with the figure for the pre-
vious fiscal year of €4,070 million, see C06. In the first quarter of the fiscal year, weak
demand in the consumer business was still partially offset by increasing demand for
semiconductors used in servers and industrial applications. In the following quarters,
demand for semiconductors used in servers also declined significantly, following high
growth rates in previous years. Combined with continuing weak demand for semicon-
ductors for computers, consumer electronics and telecommunications infrastructure,
this led to a decrease in revenue in the 2023 fiscal year. The segment contributed
23 percent of Infineon’s Group revenue.
In past years, there was significant growth in demand in the server market, mainly
driven by high levels of investment from cloud computing service providers. However,
this growth slowed considerably in the course of the 2023 fiscal year. Furthermore,
investment in cloud servers was deferred, and more AI accelerators were ordered
instead. AI accelerators are special parts of servers that significantly accelerate artificial
intelligence (AI) learning. In principle, this deferral should be seen as a positive devel-
opment for semiconductor demand, as the power supply of an AI accelerator processor
has a significantly higher semiconductor content than that required for the power
supply of a processor for standard servers. The increase in demand for semiconductors
for AI was not yet sufficient in the 2023 fiscal year to offset the decline in revenue in
the area of traditional servers. Demand for power semiconductors in the area of tele-
communications infrastructure also slowed in the 2023 fiscal year.
Demand for products in the consumer market also remained weak in the 2023 fiscal
year. Sales figures for consumer electronic devices of all types (e.g., smartphones, PCs,
laptops and notebooks, games consoles, as well as television) rose sharply during
the Covid pandemic before returning to more normal levels, which led to a decrease
in revenue in this area. Bucking the generally weak trend, interest in chargers, adapters
and power supplies based on the new material GaN is continuing to grow. This led to
an increase in revenue in this market segment, even if this was from a relatively low
base. As a result of the acquisition of GaN Systems, the number of GaN specialists in
our Group has virtually doubled. We are therefore now in a position to gain even faster
access to the market of various GaN applications.
Demand in our industrial business and for applications in the automotive sector
continued on an upward trend. The growing number of electric vehicles being sold
resulted in steadily increasing demand for charging stations and onboard chargers.
In addition, the number of vehicles with in-cabin USB-C ports for charging mobile
devices is continuing to rise. Good revenue growth was also to be seen in the compo-
nents business for light electric vehicles such as eBikes, eScooters and forklift trucks.
Demand for microinverters for roof-top solar systems remained steady, although it
began to weaken towards the end of the fiscal year.
PSS
C06 Revenue and Segment Result of the Power Sensor Systems segment
€ in millions
Revenue
Segment Result
Segment Result Margin
3,798
4,070
861
1,137
2023
2022
22.7%
27.9%
Infineon | Annual Report 2023
47
Further information
Consolidated Financial Statements
Management Board and Supervisory Board Combined Management Report
2023 fiscal year
Segment performance
49.
As a resultof the decline in demand for smartphones and other mobile devices,
there was a decrease in revenue from MEMS microphones, TVS (transient voltage
suppressor) diodes, as well as antenna tuners and RF antenna switches in the
2023 fiscal year.
Our software business becomes more important year to year. For a variety of products,
software offers an additional benefit and helps us to differentiate via the enhance-
ment of our product portfolio. We provide software either directly to complement the
firmware already integrated into the end product or as an additional service. In both
cases, software enables us to augment our revenue, either by selling a greater number
of higher-quality products at correspondingly higher prices or by producing additional
revenue with our software services. In the 2023 fiscal year, we generated increasing
revenue from software, primarily related to USB-C chargers. Turnkey products that can
still subsequently be configured and programmed by the customer were particularly
in demand in this product area.
In the 2023 fiscal year, we generated our first revenue from ion traps for quantum
computing. Together with the German firm eleQtron GmbH, a pioneer in quantum
computers, Infineon is now manufacturing quantum processors based on ion-trap
technology and supplies continuously improved generations of ion traps for eleQtron
to incorporate into its quantum computers. Several other partnerships have already
been established with regard to the manufacture of quantum computers. One example
of these is the English company Oxford Ionics. These collaborations with partners in
the quantum industry will continue to be expanded in the future.
As a result of the decrease in revenue described above, there was also a decline in
the Segment Result and the Segment Result Margin. The Segment Result in the 2023
fiscal year was €861 million, compared with €1,137 million in the 2022 fiscal year, a
decrease of 24 percent. The Segment Result Margin was 22.7 percent, compared with
27.9 percent in the 2022 fiscal year, see C06.
Review of the Connected Secure Systems segment
in the 2023 fiscal year
In the Connected Secure Systems segment, Infineon generated revenue in the 2023
fiscal year of €2,046 million, an increase of 12 percent compared with the figure
for the previous fiscal year of €1,822 million. The segment contributed 13 percent of
Infineon’s Group revenue.
The growth in revenue was driven by higher prices, an improved product mix and
volume growth in dedicated applications. The security solutions business in particular
benefited from the stabilization of the supply situation in the past fiscal year, which
meant it was possible to meet the outstanding demand, especially for payment and
ID solutions. Moreover, demand for eSIM solutions for automotive and industrial
applications remained high.
Demand for connectivity solutions and microcontrollers was adversely impacted by
a worsening macroeconomic climate, which had a dampening effect on consumer
spending. Despite macroeconomic obstacles, the digitalization of applications in the
context of IoT remains one of our principal long-term growth areas. This growth is
driven primarily by an increase in the penetration rate of end devices, especially in
the area of industrial and consumer applications.
The trend towards cashless and contactless payment is continuing. There was strong
demand for our solutions across all regions.
Around the world, there was a significant increase in travel in the past fiscal year.
In addition to this trend, other major ID projects contributed significantly to strong
revenue growth in this business area.
CSS
Infineon | Annual Report 2023
48
Further information
Consolidated Financial Statements
Management Board and Supervisory Board Combined Management Report
2023 fiscal year
Segment performance
50.
There was anincrease in revenue from embedded SIMs (eSIMs), which are used in
vehicles with an automatic emergency call function as well as in the industrial sector.
Progress with Industry 4.0 applications is also leading to growing demand for eSIMs.
Manufacturing machinery, tools and other technical devices are becoming more and
more connected and can therefore be monitored, serviced and maintained remotely.
Given the growth in revenue, both the Segment Result and Segment Result Margin
were higher than in the 2022 fiscal year. Higher prices, a better product mix and
volume growth in dedicated applications led to this improvement. The Segment
Result in the 2023 fiscal year was €488 million, an increase of 29 percent compared
with the prior-year figure of €378 million. Based on revenue, the Segment Result
Margin was 23.9 percent (previous year: 20.7 percent), see C07.
Review of results of operations
Change
€ in millions, except earnings per share 2023 2022 absolute in %
Revenue 16,309 14,218 2,091 15
Gross profit 7,413 6,131 1,282 21
Research and development expenses (1,985) (1,798) (187) (10)
Selling, general and administrative expenses (1,599) (1,565) (34) (2)
Other operating income and expenses, net 119 77 42 55
Operating profit 3,948 2,845 1,103 39
Net financial result
(financial income and expenses, net) (54) (161) 107 66
Share of profit (loss) of associates and joint
ventures accounted for using the equity method 27 39 (12) (31)
Income tax (782) (537) (245) (46)
Profit (loss) from continuing operations 3,139 2,186 953 44
Profit (loss) from discontinued operations,
net of income taxes (2) (7) 5 71
Profit (loss) for the period 3,137 2,179 958 44
Basic earnings per share (in euro) 2.38 1.65 0.73 44
Diluted earnings per share (in euro) 2.38 1.65 0.73 44
Adjusted earnings per share (in euro) – diluted 2.65 1.97 0.68 35
2,046
488
1,822
378
C07 Revenue and Segment Result of the Connected Secure Systems segment
€ in millions
Revenue
Segment Result
Segment Result Margin
2023
2022
23.9%
20.7%
Infineon | Annual Report 2023
49
Further information
Consolidated Financial Statements
Management Board and Supervisory Board Combined Management Report
2023 fiscal year
Segment performance | Review of results of operations
51.
High demand andpositive price and exchange rate effects
have resulted in an increase in revenue
Revenue grew by €2,091 million or 15 percent in the 2023 fiscal year to €16,309 million
(previous year: €14,218 million). Around half the growth in revenue was due to price
increases and around half to higher volumes and product mix adjustments. Conti
nuing high levels of demand for semiconductors in the automotive and renewable
energy sectors, in particular, had a positive impact here. At the same time, manu
facturing capacity is continually being expanded. This was also the case in the 2023
fiscal year at our sites in Villach (Austria), Dresden (Germany) and Kulim (Malaysia).
Pro
duction corridors released by contract manufacturers also contributed to the
increase in revenue.
In addition, there were positive exchange rate effects during the reporting period.
A significant proportion of revenue in the 2023 fiscal year was earned in foreign
currencies, primarily in US dollars. The average euro/US dollar exchange rate was
around 1.08 in the 2022 fiscal year and 1.07 in the 2023 fiscal year.
Revenue by segment is disclosed below:
Details on the performance of the segments can be found in the chapter “Segment
performance”. p. 44 ff.
Slight shifts in the regional distribution of revenue
€ in millions, except percentages 2023 2022
Europe, Middle East, Africa 4,360 27% 3,399 24%
therein: Germany 2,017 12% 1,594 11%
Asia-Pacific (excluding Japan, Greater China) 2,594 16% 2,343 16%
Greater China1 5,275 32% 5,204 37%
therein: Mainland China, Hong Kong 4,124 25% 4,063 29%
Japan 1,706 10% 1,415 10%
Americas 2,374 15% 1,857 13%
therein: USA 1,982 12% 1,564 11%
Total 16,309 100% 14,218 100%
1 Greater China comprises Mainland China, Hong Kong and Taiwan.
The decrease in the proportion of revenue generated in the Greater China region is
primarily due to the decline in revenue from consumer applications such as PCs
and smartphones.
Disproportionately low increase in cost of goods sold;
significant improvement in gross margin
Change
€ in millions, except percentages 2023 2022 absolute in %
Cost of goods sold 8,896 8,087 809 10
As percentage of revenue 54.5% 56.9% (240bp)
Gross profit 7,413 6,131 1,282 21
Gross margin 45.5% 43.1% 240bp
At €8,896 million, cost of goods sold during the reporting year was €809 million or
10 percent higher than the previous year’s figure of €8,087 million. The increase in the
cost of goods sold was therefore less than the increase in revenue. This was primarily
due to positive price effects and improvements in the product mix. The increase in idle
costs and inventory write-downs had an opposite effect.
C08 Revenue by segment
€ in millions
8,242
1,790
4,070 3,798
2,046
18
1,822
20
Green
Industrial Power
Automotive Power Sensor
Systems
Connected
Secure Systems
Other Operating
Segments
2,205
6,516
2022
2023
Infineon | Annual Report 2023
50
Further information
Consolidated Financial Statements
Management Board and Supervisory Board Combined Management Report
2023 fiscal year
Review of results of operations
52.
Cost of goodssold also includes expenses of €276 million incurred mainly in connec-
tion with the acquisition of Cypress (previous year: €288 million). These expenses
include the amortization of fair value adjustments of €250 million (previous year:
€278 million) identified in the course of purchase price allocations and other acquisi-
tion-related expenses.
Gross profit (revenue less cost of goods sold) in the 2023 fiscal year was €7,413 million,
21 percent higher than the prior-year figure of €6,131 million. The gross margin
improved accordingly, from 43.1 percent in the 2022 fiscal year to 45.5 percent in the
2023 fiscal year.
Operating expenses have fallen as a percentage of revenue
Operating expenses (research and development expenses, and selling, general and
administrative expenses) rose at a lower rate than revenue by €221 million in the
2023 fiscal year to €3,584 million (previous year: €3,363 million), corresponding to
22.0 percent of revenue (previous year: 23.7 percent).
Research and development expenses
Change
€ in millions, except percentages 2023 2022 absolute in %
Research and development expenses, gross 2,329 2,120 209 10
Minus:
Grants received (130) (113) (17) (15)
Capitalized development costs (214) (209) (5) (2)
Research and development expenses 1,985 1,798 187 10
As percentage of revenue 12.2% 12.6% (40 bp)
Research and development expenses increased by €187 million or 10 percent, from
€1,798 million in the 2022 fiscal year to €1,985 million in the 2023 fiscal year. The
increase reflects the higher volume of business and results mainly from the intensi
fication of research and development activities and the higher headcount in this
area. A total of 12,830 employees were engaged in research and development as of
30 September 2023, an increase of 7 percent over the figure for 30 September 2022
of 12,005.
Expressed as a percentage of revenue, research and development expenses comprised
12.2 percent of revenue in the 2023 fiscal year, which was lower than the prior-year
figure of 12.6 percent.
Selling, general and administrative expenses
Change
€ in millions, except percentages 2023 2022 absolute in %
Selling, general and administrative expenses 1,599 1,565 34 2
As percentage of revenue 9.8% 11.0% (120 bp)
Despite the 15 percent increase in its revenue, Infineon was able to keep its selling,
general and administrative expenses at a stable level of €1,599 million. Expressed as
a percentage of revenue, selling, general and administrative expenses comprised
9.8 percent of revenue in the 2023 fiscal year, which was lower than the prior-year
figure of 11.0 percent. The impact on earnings of the purchase price allocations and
acquisition-
related expenses included in Infineon’s selling, general and administrative
expenses in the 2023 fiscal year was €168 million (previous year: €177 million).
Increase in net amount of other operating income and expenses
The net amount of other operating income and expenses improved in the course of
the 2023 fiscal year to €119 million (previous year: €77 million). This includes income
from the sale of Infineon’s HiRel DC-DC converter business to Micross Components,
Inc. and from the sale of the Temecula site (USA).
Improvement in financial result
The financial result in the 2023 fiscal year was a net loss of €54 million (previous year:
net loss of €161 million). The improvement in the financial result arose mainly from
higher interest income due to increased interest rates and from positive valuation
effects. In contrast, interest expenses relating to financial liabilities were subject to
almost no fluctuations due to contractually agreed fixed interest rates. In addition,
in June 2023, a bond with a nominal volume of €750 million was repaid on schedule.
Further information is provided in note 4 to the Consolidated Financial Statements.
p. 110
Infineon | Annual Report 2023
51
Further information
Consolidated Financial Statements
Management Board and Supervisory Board Combined Management Report
2023 fiscal year
Review of results of operations
53.
Effective tax rateof 19.9 percent
The income tax expense in the 2023 fiscal year increased to €782 million (previous
year: €537 million). Based on the profit from continuing operations before income
taxes of €3,921 million (previous year: €2,723 million), the tax rate for the reporting
year was 19.9 percent (previous year: 19.7 percent).
Further details regarding the income tax expense are provided in note 6 to the
Consolidated Financial Statements. p. 111 ff.
Profit for the period and earnings per share up on previous year
After deducting income taxes and adjusting for the profit/loss from discontinued
operations, Infineon recorded a profit for the period of €3,137 million in the 2023
fiscal year (previous year: €2,179 million).
The higher profit for the period resulted in a corresponding increase in earnings
per share.
Both basic and diluted earnings per share stood at €2.38 for the 2023 fiscal year
(
previous year: €1.65).
The calculation of earnings per share in accordance with IFRS is presented in detail
in note 8 to the Consolidated Financial Statements. p. 115
Increase in adjusted earnings per share
Earnings per share in accordance with IFRS is influenced by amounts relating to pur-
chase price allocations for acquisitions (in particular Cypress) and other exceptional
items. To enable better comparability of operating performance over time, Infineon
calculates adjusted earnings per share (diluted). Adjusted profit (loss) for the period
and adjusted earnings per share (diluted) should not be seen as a replacement or as
superior performance indicators, but rather as additional information to the profit (loss)
for the period and earnings per share (diluted) determined in accordance with IFRS.
Adjusted earnings per share (diluted) increased from €1.97 in the 2022 fiscal year to
€2.65 per share in the 2023 fiscal year and is calculated as follows:
Change
€ in millions (unless otherwise stated) 2023 2022 absolute in %
Profit (loss) from continuing operations – diluted 3,139 2,186 953 44
Compensation of hybrid capital investors1 (29) (29) – –
Profit (loss) from continuing operations
attributable to shareholders
of Infineon Technologies AG – diluted 3,110 2,157 953 44
Plus/minus:
Certain impairments (reversal of impairments)
(in particular on goodwill) – (6) 6 +++
Losses (gains) on earnings of restructuring
and closures (4) – (4) –––
Share-based payment 92 62 30 48
Acquisition-related depreciation/amortization
and other expenses 464 484 (20) (4)
Losses (gains) on sales of businesses,
or interests in subsidiaries (30) – (30) –––
Other income and expenses (71) (7) (64) –––
Acquisition-related expenses within
financial result – 4 (4) –––
Tax effect on adjustments (95) (116) 21 18
Revaluation of deferred tax assets resulting
from the annually updated earnings forecast – (15) 15 +++
Adjusted profit (loss) for the period from
continuing operations attributable to shareholders
of Infineon Technologies AG – diluted 3,466 2,563 903 35
Weighted-average number of shares outstanding
(in millions) – diluted 1,306 1,304 2 0
Adjusted earnings per share (in euro) – diluted2 2.65 1.97 0.68 35
1 Including the cumulative tax effect.
2 The calculation of the adjusted earnings per share is based on unrounded figures.
Infineon | Annual Report 2023
52
Further information
Consolidated Financial Statements
Management Board and Supervisory Board Combined Management Report
2023 fiscal year
Review of results of operations
54.
Review of financialcondition
Increase in property, plant and equipment due to expansion
in frontend manufacturing facilities
Property, plant and equipment increased by €1,500 million to €7,045 million as of
30 September 2023. Additions of €2,729 million significantly exceeded depreciation
of €1,143 million. The main focus of Infineon’s investing activities in the 2023 fiscal
year was on the expansion of its frontend manufacturing facilities in Villach (Austria)
and Dresden (Germany), as well as the development of the frontend manufacturing
site in Kulim (Malaysia).
30 Septem-
ber 2023
30 Septem-
ber 2022
Change
€ in millions absolute in %
ASSETS
Cash and cash equivalents and
financial investments 3,590 3,717 (127) (3)
Trade receivables 1,991 1,887 104 6
Inventories 3,974 3,081 893 29
Property, plant and equipment 7,045 5,545 1,500 27
Goodwill 6,547 7,083 (536) (8)
Other intangible assets 2,977 3,483 (506) (15)
Remaining current and non-current assets 2,315 2,116 199 9
Total assets 28,439 26,912 1,527 6
LIABILITIES AND EQUITY
Trade payables 2,765 2,260 505 22
Financial debt 4,733 5,662 (929) (16)
Pensions and similar commitments 268 297 (29) (10)
Remaining current and non-current liabilities 3,629 3,749 (120) (3)
Equity 17,044 14,944 2,100 14
Total liabilities and equity 28,439 26,912 1,527 6
Increase in business volume results in a rise in inventories
Inventories, and in particular work in progress, rose by €893 million to €3,974 million
as of 30 September 2023. This increase is mainly attributable to our Automotive
segment, where delivery reliability is a key factor in winning and retaining orders.
Currency-related decrease in goodwill
Goodwill decreased by €536 million to €6,547 million as of 30 September 2023.
The decline was almost exclusively due to currency effects, in particular the weaker
US dollar compared to the euro as of the reporting date.
Decrease in other intangible assets
Other intangible assets decreased by €506 million to €2,977 million as of
30 Sep
tember 2023. Amortization of €531 million significantly exceeded additions
of €255 million. Currency effects of €208 million also contributed to the decline.
Repayment of financial debt
Financial debt decreased by €929 million to €4,733 million, mainly as a result of the
repayment of a €750 million bond. Exchange rate effects of €182 million arising
from financial debt denominated in US dollars also contributed to the reduction in
financial debt.
More detailed information on financial debt is provided in note 16 to the Consolidated
Financial Statements. p. 123 f.
44% 56%
4,733
40% 60%
5,662
US dollar
Euro
C09 Financial debt by currency
€ in millions
2022
2023
Infineon | Annual Report 2023
53
Further information
Consolidated Financial Statements
Management Board and Supervisory Board Combined Management Report
2023 fiscal year
Review of financial condition
55.
Increase in tradepayables
The increase in trade payables of €505 million to €2,765 million resulted mainly from
the increase in investments and in the business volume.
Equity up mainly due to profit for the period
Equity increased by €2,100 million to €17,044 million as of 30 September 2023. The
main contributory factor was the profit for the period of €3,137 million. Exchange rate
effects recognized in other comprehensive income of €718 million and the dividend
of €417 million paid out for the 2022 fiscal year had an opposite effect.
The equity ratio as of 30 September 2023, based on total assets of €28,439 million,
was 59.9 percent (30 September 2022: 55.5 percent).
Improvement in RoCE due to higher operating profit
In the 2023 fiscal year, operating profit from continuing operations after tax increased
significantly by €920 million to €3,237 million (previous year: €2,317 million) and
therefore at a faster rate than capital employed. Adjustments made to volumes, prices
and the product mix, as well as exchange rate effects, contributed to the increase in
operating profit (see the chapter “Review of results of operations”, p. 49 ff.). Capital
employed rose by €1,151 million to €19,510 million as of 30 September 2023.
Consequently, Return on Capital Employed (RoCE) increased from 12.6 percent to
16.6 percent.
RoCE for the 2023 and 2022 fiscal years is calculated as follows:
Change
€ in millions, except percentage 2023 2022 absolute in %
Operating profit 3,948 2,845 1,103 39
Plus/minus:
Financial result (54) (161) 107 66
Less interest result 98 131 (33) (25)
Financial result excluding interest result1 44 (30) 74 +++
Share of profit (loss) of associates and joint
ventures accounted for using the equity method 27 39 (12) (31)
Income tax (782) (537) (245) (46)
Operating profit from continuing
operations after tax 1 3,237 2,317 920 40
Assets 28,439 26,912 1,527 6
Plus/minus:
Cash and cash equivalents (1,820) (1,438) (382) (27)
Financial investments (1,770) (2,279) 509 22
Assets classified as held for sale – – – –
Total current liabilities (5,669) (5,588) (81) (1)
Short-term financial debt and
current maturities of long-term financial debt 330 752 (422) (56)
Liabilities classified as held for sale – – – –
Capital employed 2 19,510 18,359 1,151 6
RoCE 1 / 2 16.6% 12.6% 400bp
1
The financial result for the 2023 and 2022 fiscal years amounted to negative €54 million and negative €161 million, respectively,
and included negative €98 million and negative €131 million, respectively, of net interest result.
Infineon | Annual Report 2023
54
Further information
Consolidated Financial Statements
Management Board and Supervisory Board Combined Management Report
2023 fiscal year
Review of financial condition
56.
Review of liquidity
Cashflow
Change
€ in millions 2023 2022 absolute in %
Cash flows from operating activities
from
continuing operations 3,962 3,986 (24) (1)
Cash flows from investing activities (2,264) (2,441) 177 7
Cash flows from financing activities (1,301) (1,869) 568 30
Net change in cash and cash equivalents
from discontinued operations (2) (6) 4 67
Cash-relevant change in cash and
cash equivalents 395 (330) 725 +++
Currency effects on cash and cash equivalents (13) 19 (32) –––
Change in cash and cash equivalents 382 (311) 693 +++
Cash flows from operating activities from continuing operations decreased by
€24 million to €3,962 million. Set against a significant improvement in profit from
continuing operations before income taxes of €1,198 million were negative effects,
principally in relation to the change in other assets and other liabilities and the
change in working capital.
Cash outflows from investing activities decreased by €177 million compared with
the previous fiscal year to €2,264 million. The improvement resulted mainly from
the €643 million increase in net cash inflow from the purchase and sale of financial
investments. Cash inflows totaling €200 million from the sale of the HiRel DC/DC
converter business and the sale of the Temecula site (USA) also contributed to the
improvement. This was offset by the €686 million increase in payments for property,
plant and equipment. Further information about investments made in the 2023 fiscal
year can be found in the chapter “Review of financial condition”. p. 53 f.
Cash outflows from financing activities decreased by €568 million compared with the
previous fiscal year. The main effects for this decline are the reduction of €640 million
in net repayment of financial debt which was offset by a €66 million higher divi-
dend payment. The net cash outflows from financing activities thus amounted to
€1,301 million in the 2023 fiscal year.
More information about financial debt is provided in note 16 to the Consolidated
Financial Statements. p. 123 f.
Decrease in Free Cash Flow; adjusted Free Cash Flow
at 10.0 percent of revenue
Infineon reports the Free Cash Flow figure, defined as cash flows from operating
activities and cash flows from investing activities, both from continuing operations,
after adjusting for cash flows from the purchase and sale of financial investments.
Free Cash Flow serves as an additional performance indicator since Infineon holds
part of its liquidity in the form of financial investments. This does not mean that
the Free Cash Flow calculated in this way is available to cover other disbursements,
because dividends, debt-servicing obligations and other fixed disbursements have
not been deducted.
Since the 2023 fiscal year, adjusted Free Cash Flow has become part of Infineon’s
target operating model (see the chapter “Group strategy”, p. 28) and is defined
as Free Cash Flow adjusted for cash outflows for investments in large frontend build-
ings, for cash inflows for related investment subsidies and for major MA transactions
(acquisitions and disposals) adjusted for cash acquired or disposed of.
Infineon | Annual Report 2023
55
Further information
Consolidated Financial Statements
Management Board and Supervisory Board Combined Management Report
2023 fiscal year
Review of liquidity
57.
Both figures shouldnot be seen as a replacement or as superior performance indicators,
but rather as useful information in addition to the disclosure of the cash flow reported
in the Consolidated Statement of Cash Flows, and as a supplementary disclosure to
other liquidity performance indicators and other performance indicators determined
in accordance with IFRS. Free Cash Flow and adjusted Free Cash Flow are derived as
follows from the Consolidated Statement of Cash Flows:
Change
€ in millions 2023 2022 absolute in %
Cash flows from operating activities1 3,962 3,986 (24) (1)
Cash flows from investing activities1 (2,264) (2,441) 177 7
Purchases of (proceeds from sales of)
financial investments, net (540) 103 (643) –––
Free Cash Flow 1,158 1,648 (490) (30)
Plus:
Cash outflows for investments in large front-end
buildings after deduction of cash inflows for
related investment subsidies 480
Adjusted Free Cash Flow 1,638
Percentage of revenue 10.0%
1
From continuing operations.
Gross cash position and net cash position
The following table shows the gross cash position and the net cash position. Since
some liquid funds are held in the form of financial investments, which for IFRS pur-
poses are not classified as cash and cash equivalents, Infineon reports on its gross
and net cash positions in order to provide investors with a better understanding of
its overall liquidity situation. The gross and net cash positions are determined as
follows from the Consolidated Statement of Financial Position:
30 Septem-
ber 2023
30 Septem-
ber 2022
Change
€ in millions absolute in %
Cash and cash equivalents 1,820 1,438 382 27
Financial investments 1,770 2,279 (509) (22)
Gross cash position 3,590 3,717 (127) (3)
Minus:
Short-term financial debt and current portion
of long-term financial debt 330 752 (422) (56)
Long-term financial debt 4,403 4,910 (507) (10)
Gross financial debt 4,733 5,662 (929) (16)
Net cash position (1,143) (1,945) 802 41
Taking into account the financial resources available to Infineon – including internal
liquidity on hand, net cash that will be generated, and currently available credit facili-
ties amounting to €69 million (previous year: €80 million, see note 16 to the Consoli-
dated Financial Statements, p. 123) – Infineon assumes that it will be able to cover
those capital requirements for the 2024 fiscal year that are currently expected. These
include the repayment of financial debt on its due date. Forecast capital requirements
also include other financial obligations, such as orders already placed for initiated
or planned investments in property, plant and equipment (see note 23 to the Consoli-
dated Financial Statements, p. 135 f.). Investments planned for the 2024 fiscal year
are described in the chapter “Outlook”. p. 62 ff.
Infineon is party to two financing agreements that contain a number of standard
covenants, including a debt coverage ratio that provides for a certain relationship
between the size of debt (adjusted) and earnings (adjusted) (see note 21 to the
Consolidated Financial Statements, p. 132).
Infineon | Annual Report 2023
56
Further information
Consolidated Financial Statements
Management Board and Supervisory Board Combined Management Report
2023 fiscal year
Review of liquidity
58.
Principles and structureof Infineon’s treasury
Infineon treasury’s stated objective is to ensure financial flexibility based on a solid
capital structure. Its primary goal is to ensure that sufficient funds are available to
finance operating activities and planned investments throughout all phases of the
business cycle. We aim to achieve a gross liquidity level of €1 billion, plus at least
10 percent of revenue.
As a general rule, debt should only constitute a modest proportion of the financing mix
to ensure that sufficient headroom is available at all times. The key objective is to
maintain an investment grade rating. In February 2023, SP Global Ratings confirmed
Infineon’s BBB investment grade rating and changed the outlook from “stable” to
“positive”. For further information on the nature, maturity, currency and interest rate
structure of Infineon’s gross financial debt, see note 16 to the Consolidated Financial
Statements. p. 123 f.
The abovementioned treasury principles cover all liquidity and financing topics, such
as banking policy and strategy, the execution of financing agreements, global liquidity
and investment management, the management of currency, interest rate and some
commodity price risks, and the handling of external and intragroup cash flows.
In accordance with our treasury principles, we adopt a highly centralized approach.
Group Finance Treasury is the department responsible for all major tasks and
processes worldwide relating to financing and treasury matters.
In the context of centralized liquidity management and, to the extent that this is per-
mitted by law and economically justifiable, cash pooling structures are in place to
ensure the best possible allocation of liquid funds within the Group and reduce its
external financing requirements. Liquidity accumulated at Group level is invested
centrally by the Group Finance Treasury department based on a conservative
investment strategy, in which preserving capital is prioritized over maximizing returns.
Group Finance Treasury is also responsible for managing currency and interest rate
risks and hedging against commodity price risks. For hedging purposes, we employ
the following derivative financial instruments in our current operations: forward foreign
currency contracts to reduce the impact of exchange rate exposure (to the extent
foreign currency cash flows are not offset within the Group) and commodity swaps to
reduce price risks for expected purchases of gold. Derivative financial instruments
are not used for trading or speculation purposes. To hedge against most of the foreign
currency risk relating to the purchase price obligation arising from the acquisition
of GaN Systems, Infineon concluded a contingent (transaction-dependent) euro/US
dollar forward foreign currency contract (a deal contingent forward) and a transaction-
dependent euro/US dollar foreign currency option contract (a deal contingent option).
Further information regarding derivative financial instruments and the management
of
financial risks is provided in notes 27, p. 142 ff., and 28, p. 150 ff., to the Consoli-
dated Financial Statements.
Furthermore, to the extent permitted by law, all financing activities and credit lines
worldwide are arranged, structured and managed, either directly or indirectly, by the
Group Finance Treasury department in accordance with our treasury principles.
A Treasury Committee is in place to deliberate on current financial market devel
opments and their potential impact on Infineon and to agree upon key liquidity,
hedging and financing topics. The Committee, which meets on a quarterly basis,
comprises the CFO and representatives from the Finance Treasury, Accounting,
Controlling and Tax departments.
Infineon | Annual Report 2023
57
Further information
Consolidated Financial Statements
Management Board and Supervisory Board Combined Management Report
2023 fiscal year
Review of liquidity
59.
Basic information onshares
Share types Ordinary registered shares in the form of shares or
American Depositary Shares (ADS) with a notional value
of €2 each (ADS : shares = 1 : 1)
Share capital €2,611,842,274 (as of 30 September 2023),
€2,611,842,274 (as of 30 September 2022)
Shares issued¹ 1,305,921,137 (as of 30 September 2023),
1,305,921,137 (as of 30 September 2022)
Own shares 2,171,026 (as of 30 September 2023),
3,689,901 (as of 30 September 2022)
ISIN
WKN
DE0006231004
623100
Ticker symbol IFX (share), IFNNY (ADS)
Bloomberg
Nasdaq IR Insight
IFX GY (Xetra trading system), IFNNY US
IFX-XE, IFNNY-PK
Listings Shares: Frankfurt Stock Exchange (FSE)
Market capitalization2 €40,879 million
(based on closing price of €31.36 as of 30 September 2023)
Daily average shares traded on Xetra 3,829,653 (in the 2023 fiscal year)
Trading in the USA ADS, over-the-counter trading on the OTC market
(OTCQX International)
Market capitalization2 US$43,245 million
(based on closing price of US$33.17 as of 30 September 2023)
Daily average ADS traded 199,504 (in the 2023 fiscal year)
Index membership (selected) DAX 40
TecDAX
EURO STOXX 50
Dow Jones STOXX Europe 600
Dow Jones Euro STOXX TMI Technology Hardware Equipment
Dow Jones Germany Titans 30
MSCI Germany
SP Europe 350
Dow Jones Sustainability World Index
1
The number of shares issued includes own shares.
2 Calculation of market capitalization: (“shares issued” – “own shares”) x share price. The calculation is based on unrounded figures.
A full overview of other major indices in which the Infineon share is represented can be found on Infineon’s website at
www.infineon.com/cms/en/about-infineon/investor/infineon-share/#5
Basic information on bonds and other
financing instruments
0.625% Bond from 17 February 2022 €500 million due on 17 February 2025,
ISIN: XS2443921056
1.125% Bond from 24 June 2020 €750 million due on 24 June 2026,
ISIN: XS2194283672
1.625% Bond from 24 June 2020 €750 million due on 24 June 2029,
ISIN: XS2194283839
2.000% Bond from 24 June 2020 €650 million due on 24 June 2032,
ISIN: XS2194192527
2.875% Hybrid Bond from 1 October 2019 €600 million first call date 1 January 2025,
ISIN: XS2056730323
3.625% Hybrid Bond from 1 October 2019 €600 million first call date 1 January 2028,
ISIN: XS2056730679
US Private Placement from 5 April 2016 US$350 million due on 5 April 2024
US Private Placement from 5 April 2016 US$350 million due on 5 April 2026
US Private Placement from 5 April 2016 US$235 million due on 5 April 2028
US Private Placement from 16 June 2021 US$350 million due on 16 June 2027
US Private Placement from 16 June 2021 US$350 million due on 16 June 2029
US Private Placement from 16 June 2021 US$350 million due on 16 June 2031
US Private Placement from 16 June 2021 US$250 million due on 16 June 2033
Rating of SP Global Ratings since 15 February 2023:
“BBB”, Outlook: “positive”
Infineon on the capital market
58
Infineon | Annual Report 2023
Further information
Consolidated Financial Statements
Management Board and Supervisory Board Combined Management Report
Infineon on the capital market
60.
Share price performance
Theclosing price for Infineon shares at the end of the 2023 fiscal year was €31.36.
This was up 38 percent on the closing price of €22.71 at the end of the 2022 fiscal year.
On 3 October 2022, right at the beginning of the fiscal year, Infineon shares fell to their
lowest price for the year of €23.09. Subsequently, the share price climbed relatively
steadily, reaching its year high for the 2023 fiscal year of €40.00 on 31 July 2023. With
an increase in value of 38 percent during the fiscal year, Infineon shares rose at a
faster rate than the DAX, which was up 27 percent. The US benchmark indices, the
Philadelphia Semiconductor Index (SOX) and Dow Jones US Semiconductor Index,
rose even faster, mainly as a result of a surge in the price of some technology shares
at the end of May due to a wave of interest in artificial intelligence. The SOX improved
by 49 percent compared with the previous year and the Dow Jones US Semiconductor
Index by 79 percent. With a closing price for Infineon shares of €31.36, its market capi-
talization as of 30 September 2023 was €40,879 million, compared with €29,574 million
at the end of the 2022 fiscal year when the share price was €22.71.
Shareholder structure
As of 30 September 2023, the company BlackRock Inc. held more than 5 percent of
the Infineon shares issued. The share capital held by retail investors increased slightly
to 9.50 percent at the end of the 2023 fiscal year, compared with 9.47 percent at the
end of the 2022 fiscal year.
09|2023
04|2023 06|2023
02|2023
11|2022 07|2023 08|2023
03|2023
12|2022 05|2023
01|2023
10|2022
45.42
43.15
40.88
38.61
36.34
34.07
31.79
29.52
27.25
24.98
22.71
20.44
Infineon DAX SOX Dow Jones US Semiconductor Index
C10 Development of the Infineon share compared to Germany’s DAX Index, the Philadelphia
Semiconductor Index (SOX) and the Dow Jones US Semiconductor Index for the 2023
fiscal year (daily closing prices)
Infineon share price in € 30 September 2022 = 100
200
190
180
170
160
150
140
130
120
110
100
90
C11 Shareholder structure as of the end of the 2023 fiscal year
7.45% BlackRock Inc.
9.50% Retail investors
83.05% other
59
Infineon | Annual Report 2023
Further information
Consolidated Financial Statements
Management Board and Supervisory Board Combined Management Report
Infineon on the capital market
61.
Dividend
Our dividend policyis aimed at letting shareholders adequately participate in Infineon’s
economic development and, in general, at paying out at least an unchanged dividend
even in the event of stagnating or declining earnings. The dividend payout for the
2021 fiscal year was increased by €0.05 per share compared with the previous year.
The dividend payout for the 2022 fiscal year was then increased again by €0.05, to
€0.32 per share. It is now planned to put forward a proposal at the Annual General
Meeting in February 2024 for a further increase in the dividend of €0.03. The reason
for this is Infineon’s even better business performance in the 2023 fiscal year compared
with the previous year while at the same time retaining the financial headroom of
the Company for profitable growth. If the planned proposal is approved at the Annual
General Meeting, the dividend for the 2023 fiscal year would rise to €0.35 per share.
The number of shares issued remained unchanged as of 30 September 2023 at
1,305,921,137. This figure now includes 2,171,026 shares owned by the Company
that are not entitled to a dividend. The total amount to be distributed to shareholders
is therefore anticipated to rise to €456 million, compared with €417 million one
year earlier.
Interested parties may participate in telephone conferences via a webcast broadcast in the Investor Relations section of the
Infineon website.
www.infineon.com/investor
Retail investors can contact us by email (investor.relations@infineon.com)
and by telephone (+49 89 234-26655).
C12 Dividend per share for the 2014 to 2023 fiscal years
in € cents
1 Proposal to the Annual General Meeting to be held on 23 February 2024.
2014
18
2018
27
2020
22
2023
351
2022
32
2021
27
2019
27
2016
22
2017
25
2015
20
60
Infineon | Annual Report 2023
Further information
Consolidated Financial Statements
Management Board and Supervisory Board Combined Management Report
Infineon on the capital market
62.
Geopolitical and macroeconomicdisruptions once again led to a volatile market
environment in the past fiscal year. Our target markets developed correspondingly
differently.
On a positive note, structural demand for many of our semiconductors for electro
mobility applications remains unbroken. We saw a similarly healthy demand picture
for renewable energy applications as well as for power and charging infrastructure,
supported by government decarbonization initiatives. By contrast, demand for end
consumer applications such as PCs and smartphones declined following the corona-
virus pandemic. Consumers and companies were reluctant to spend in a persistently
inflationary and uncertain environment.
Despite the challenging conditions, Infineon was very successful in the 2023 fiscal year.
This is also reflected in our current figures, see the chapters “Group performance”,
p. 42 f., “Review of results of operations”, p. 49 ff., “Review of financial condition”,
p. 53 f., and “Review of liquidity”, p. 55 ff..
Overall statement on Infineon’s financial condition
61
Infineon | Annual Report 2023
Further information
Consolidated Financial Statements
Management Board and Supervisory Board Combined Management Report
Overall statement on Infineon’s financial condition
63.
Outlook
Actual and targetvalues for performance indicators
The following table and subsequent comments compare the actual and forecast
values of Infineon’s key performance indicators for the 2023 fiscal year (FY) and show
the outlook for the 2024 fiscal year.
€ in millions,
except percentages
Actuals
FY 2022
Outlook for
FY 20231
Actuals
FY 2023
Outlook for
FY 2024
Principal performance
indicators
Segment Result Margin 23.8% Around 27%
(at a revenue level
of around €16.2 billion
27.0% Around 24%
(at a revenue level
of around €17 billion)
Free Cash Flow from
continuing operations
1,648 Around €1.2 billion 1,158 Around €0.4 billion
RoCE 12.6% Around 15% 16.6% Around 13%
Selected supplementary
performance indicators
Revenue respectively
change in revenue
compared to
previous year
14,218 Revenue increase
to around €16.2 billion
16,309 Revenue increase
to €17 billion plus
or minus €500 million
Investments 2,310 Around €3.0 billion 2,994 Around €3.3 billion
1 The forecast presented here corresponds to the forecast last finalized in the second and third quarters of the 2023 fiscal year.
Comparison of original outlook with actual figures
for the 2023 fiscal year
Revenue for the 2023 fiscal year was originally forecast in November 2022 to be
€15.5 billion, plus or minus €500 million. In light of Infineon’s positive business
performance, this outlook was raised incrementally in the following quarters to an
expected revenue of around €16.2 billion. The actual amount of revenue generated in
the 2023 fiscal year was €16,309 million. This figure was within the projected range
of the final forecast on 3 August 2023 and significantly above the original forecast in
November 2022. The good level of demand and price increases both had a positive
impact on revenue.
In conjunction with the adjustments to the revenue forecast, the expected Segment
Result Margin was also adjusted upwards in the course of the fiscal year. Originally,
a Segment Result Margin of around 24 percent was forecast for the 2023 fiscal year.
The most recent forecast was a figure of around 27 percent. The actual figure was
27.0 percent, so the forecast was met.
According to the original forecast in November 2022, Free Cash Flow was expected to
reach around €0.8 billion. As a result of the ongoing adjustments to the revenue and
earnings forecasts, adjustments were also made on a regular basis to the expected
figure for Free Cash Flow. The final forecast for Free Cash Flow of around €1.2 billion
was made in August 2023. The actual figure for Free Cash Flow in the 2023 fiscal year
was €1,158 million. This was in line with the most recent forecast and was significantly
higher than the figure originally forecast of €0.8 billion.
As a result of Infineon’s positive earnings performance, the actual figure for Return
on Capital Employed (RoCE) in the 2023 fiscal year was 16.6 percent, exceeding the
forecast made in November 2022 of “around 12 percent” respectively in March 2023
of “around 15 percent”.
The actual figure for investments in the 2023 fiscal year of €2,994 million was in line
with the forecast figure of €3.0 billion.
Report on outlook, risk and opportunity
62
Infineon | Annual Report 2023
Further information
Consolidated Financial Statements
Management Board and Supervisory Board
Report on outlook, risk and opportunity
Outlook
Combined Management Report
64.
Explanatory comments onthe outlook
for the 2024 fiscal year
Assumed euro/US dollar exchange rate
As a globally operating organization, Infineon generates revenue not only in euros,
but also in foreign currencies, predominantly in US dollars. It also incurs expenses in
US dollars and, to some extent, in currencies correlated with the US dollar, such as
the Singapore dollar, the Malaysian ringgit and the Chinese renminbi. The impact of
non-euro-denominated revenue and expenses does not always balance out. For this
reason, fluctuations in exchange rates, particularly between the euro and the US dollar,
influence the amounts reported for revenue and earnings. A stronger US dollar against
the euro has a positive effect, whereas a weaker US dollar against the euro has an
adverse effect on revenue and earnings. Excluding the effect of currency hedging
instruments, the impact of a deviation of 1 US cent in the actual exchange rate of the
US dollar against the euro compared to the forecast rate would amount to a change
in Segment Result of around €10 million per quarter or around €40 million per fiscal
year compared to the forecast value. These figures are calculated on the assumption
that the exchange rates of currencies – in which costs arise for Infineon – change in
line with the euro/US dollar exchange rate. In terms of revenue, the impact of exchange
rates is limited primarily to the euro/US dollar rate, where a deviation of 1 US cent
in the actual exchange rate compared to the forecast rate would have an impact on
revenue of around €25 million per quarter or around €100 million per fiscal year.
Planning for the 2024 fiscal year is based on an assumed exchange rate of US$1.05
to the euro.
External growth prospects for the global economy
and the semiconductor market
In the course of the 2023 fiscal year, the global economy continued to be affected
by the consequences of the Russian invasion of Ukraine and high inflation. Due to
significant rises in interest rates and difficult financing conditions as a result, economic
activity slowed down considerably compared with the previous year. However, most
countries have so far avoided going into recession. According to the forecasts of the
International Monetary Fund (IMF), global economic growth in the 2023 calendar year
will be around 2.5 percent, a somewhat higher figure than the 2.1 percent forecast
in autumn 2022. Growth of 2.4 percent is forecast for the 2024 calendar year ( R01).
This means that current growth rates for the global economy are remaining more
or less stable, although they are below their historical average. Risks of a further
weakening in the global economy also remain.
Market analysts at Omdia expect Infineon’s reference market (i.e., the semiconductor
market excluding DRAM and NAND flash memory chips and microprocessors) to see
a slight decline of 1 percent in revenue in US dollar terms in the 2023 calendar year
( R03). Demand for semiconductors for automotive and industrial applications is
again higher than average, whereas revenue from semiconductors in the consumer
market segment and in the area of cellular infrastructure will decrease significantly.
The experts at Omdia expect the Infineon reference market to grow by 6 percent in the
2024 calendar year ( R03). The long-term trends decarbonization and digitalization
are continuing to drive demand for semiconductors, especially in the automotive
and industrial sectors. In the areas of consumer electronic goods and cellular infra-
structure, the forecast is for a noticeable recovery in revenue in the 2024 calendar
year following the decline in revenue in the 2023 calendar year.
Outlook for the 2024 fiscal year
The following outlook is based on current business developments and internal
forecasts.
Revenue of €17 billion plus or minus €500 million expected
Based on the forecasts for the growth of the global economy and the semiconductor
market segments relevant for Infineon described above and an assumed exchange
rate of US$1.05 to the euro, Infineon forecasts that Group revenue will grow in the 2024
fiscal year to €17 billion, plus or minus €500 million. This is equivalent to a 4 percent
increase in revenue compared with the prior year. Revenue growth in the Automotive
segment is expected to be in the low double-digit percentage range. Revenue in the
63
Infineon | Annual Report 2023
Further information
Consolidated Financial Statements
Management Board and Supervisory Board
Report on outlook, risk and opportunity
Outlook
Combined Management Report
65.
Green Industrial Powersegment should remain more or less stable compared with
the 2023 fiscal year. The Power Sensor Systems and Connected Secure Systems
segments are each forecast to see a decline in revenue in the high single-digit per-
centage range, due to weak demand for semiconductors for computers and consumer
electronics as well as relatively high inventory levels still held by customers.
Segment Result Margin of around 24 percent of revenue expected
If the middle of the range for the revenue forecast is reached, the Segment Result
Margin is expected to be around 24 percent in the 2024 fiscal year.
Free Cash Flow from continuing operations
For the 2024 fiscal year, Infineon is forecasting Free Cash Flow of around €0.4 billion.
This figure includes net cash outflows for investments in the expansion of frontend
manufacturing facilities in Dresden (Germany) and Kulim (Malaysia) and net cash
outflows for the acquisition of GaN Systems.
RoCE
For the 2024 fiscal year, Return on Capital Employed (RoCE) is forecast to reach
around 13 percent.
Investments and depreciation/amortization
Investments (defined by Infineon as the sum of investments in property, plant and
equipment, investments in other intangible assets and capitalized development
costs) are planned at around €3.3 billion for the 2024 fiscal year.
Most of the investment relates to the construction and expansion of frontend
manufacturing facilities. The main focus is on the completion of Phase 1 and the
commencement of Phase 2 of the third fabrication facility at the Kulim site, which is
designed to manufacture compound semiconductors, as well as on the construction
of the fourth module in Dresden.
Considerable funds are also being invested in acquiring equipment for the production
of products based on silicon carbide and gallium nitride. Further amounts invested
in frontend facilities will be used to implement structural measures, optimize product
quality, increase the degree of automation and promote innovation.
A significant amount of investment is also planned in order to expand capacity and
implement structural measures at backend facilities, albeit at a much lower level
than for frontend facilities.
In the 2023 fiscal year, investments totaled €2,994 million, comprising €2,739 million
for property, plant and equipment and €255 million for capitalized development
costs and other intangible assets. In the 2024 fiscal year, investments in capitalized
development costs and other intangible assets are expected to be at a slightly higher
level than in the 2023 fiscal year.
Depreciation and amortization are predicted to be around €2.1 billion in the
2024 fiscal year. Approximately €0.4 billion relates to the amortization of purchase
price allocations, mainly in connection with the acquisition of Cypress.
Overall statement on expected developments
at Infineon
Based on forecasts for the development of the global economy and the semicon
ductor market in the 2024 calendar year, Infineon expects Group revenue to grow
to €17 billion, plus or minus €500 million. The Segment Result Margin is forecast, at
the middle of the range for the revenue forecast, to be around 24 percent of revenue.
Investments are expected to be at around €3.3 billion. Depreciation and amortization
are expected to total about €2.1 billion. Free Cash Flow from continuing operations
should reach around €0.4 billion. Return on Capital Employed (RoCE) is forecast to be
around 13 percent.
64
Infineon | Annual Report 2023
Further information
Consolidated Financial Statements
Management Board and Supervisory Board
Report on outlook, risk and opportunity
Outlook
Combined Management Report
66.
Risk and opportunityreport
Risk policy: Basis of our risk and
opportunity management
Effective risk and opportunity management is an important element of our business
activities and supports the implementation of our strategy to achieve our strategic
goals. Infineon’s risk and opportunity situation continues to be characterized by the
dynamic market environment in the semiconductor industry, a substantial need for
capital investment to achieve and sustain its market position, extraordinarily rapid
technological change, decarbonization and digitalization. Competition to gain an
innovative edge also occurs at the legal level, as evidenced, for example, by patents.
Against this background, Infineon’s risk policy is aimed at quickly realizing the
opportunities that arise in a way that increases its enterprise value. It also focuses
on identifying risks early and actively mitigating them – particularly those risks that
might pose a threat to Infineon’s going-concern status – by adopting appropriate
countermeasures. Risk management at Infineon is therefore closely linked to corporate
planning and the implementation of our strategy. The ultimate responsibility for
risk management lies with the Infineon Management Board.
Coordinated risk management and control system elements are in place that enable
us to implement our risk policy. In addition to the Risk and Opportunity Management
System (ERM) and the Internal Control System (ICS) described below, these elements
include, in particular, the related forecasting, management and internal reporting
processes as well as our Compliance Management System (CMS).
ERM and ICS systems
The new IDW Auditing Standard 340 on the audit of the early risk detection system
came into force on 1 January 2021. We therefore adapted our Risk and Opportunity
Management System in the 2022 fiscal year to the methodology of the new standard.
Significant changes involved implementing a risk-bearing capacity concept based on
shareholders’ equity and improving risk aggregation by using Monte Carlo simulations.
Furthermore, in addition to categorizing risks (classifying risk events into various
thematic blocks) and setting threshold levels for risk tolerance, the review period for
risk reporting (with regard to the degree of impact of the risks and opportunities) was
amended. The review period is divided into three time segments: the impact in the
current fiscal year, in the coming fiscal year, and a trend statement for years three to
five. This adjustment of the risk assessment now enables us to calculate the risk-bearing
capacity for the individual fiscal years.
Infineon’s centralized ERM system is based on a Group-wide, management-oriented
ERM approach, which aims to cover all relevant risks and opportunities. This approach
is based on the “Enterprise Risk Management – Integrating with Strategy and Per
formance” (2017) framework developed by the Committee of Sponsoring Organi
zations of the Treadway Commission (COSO). The objective of the system is the early
identification, assessment and management of risks and opportunities that could
have a significant influence on Infineon’s ability to achieve its strategic, operational,
financial, legal and compliance targets. Infineon’s Internal Control System is also
based on a framework developed by COSO (“Internal Control – Integrated Framework”
(2013)). This framework describes the various elements in a control system (the control
environment, risk assessment, control activities, information and communication,
and monitoring) and sets out the basis for the evaluation of the appropriateness and
effectiveness of the ICS.
65
Infineon | Annual Report 2023
Further information
Consolidated Financial Statements
Management Board and Supervisory Board
Report on outlook, risk and opportunity
Risk and opportunity report
Combined Management Report
67.
The responsibility forprocesses and systems relating to the ICS and the ERM rests
with the Risk Management and ICS function within the Group Finance department
as well as with designated Risk and Control Officers working at divisional, corporate
function and regional levels. Responsibility for the identification, measurement,
management and reporting of risks and opportunities, as well as for their mitigation
and control, lies with the management of the organizational unit concerned.
In organizational terms, implementation of the ICS and ERM is via a closed-loop,
multiple-stage process that stipulates the manner and criteria to be applied to identify,
measure, manage, mitigate, control and report on risks and opportunities and defines
how the system is to be monitored as a whole. Major components of the system are
a quarterly analysis of risks and opportunities, a reporting of all units included, an
analysis of the overall situation at divisional and Group levels, and reporting to the
Management Board on the risk and opportunity situation, the results of tests of the
controls, and the major management and control measures undertaken. The Manage-
ment Board, in turn, reports regularly to the Supervisory Board’s Investment, Finance
and Audit Committee on the developments and results of the ICS and ERM. Where
necessary, standard processes are supplemented by ad hoc reporting of any major
risks identified between the regular reporting dates.
We define a risk or an opportunity as the occurrence of future uncertainties that
could result in either a negative or a positive variance from the business plan. We
incorporate all relevant organizational units within the Group in this analysis, thus
covering all divisions, significant corporate functions and regions.
Risks and opportunities under ERM are measured on a net basis by taking into
account any existing management and mitigation measures. The time periods and
measurement categories used are closely linked to our short-term and medium-term
business planning and entrepreneurial targets.
All relevant risks and opportunities are assessed uniformly across the Group in
quantitative or qualitative terms, based on two factors: degree of impact on
the Segment Result and/or on business objectives, reputation, compliance, and
likelihood of occurrence.
The scales used to measure these two factors (degree of impact and likelihood of
occurrence) and the resulting risk assessment matrix for the presentation of risks
for impact years 1 and 2 are depicted in chart C13. The scale used to measure the
degree of impact on the Segment Result has been adjusted in comparison with the
previous year for the measurement of risks in the coming years to take account of the
profitable growth and the increased size of Infineon’s business.
Based on the potential degree of impact as well as the estimated likelihood of
occurrence, a risk is classified as “very high”, “high”, “medium” or “low”.
1 Relating to a planning year.
Likelihood of occurrence
1 10% Very unlikely
2 10–40% Unlikely
3 40–60% Possible
4 60–90% Probable
5 90% Virtually certain
Degree of impact
on Segment Result1
1 €40 million Marginal
2 €40–100 million Minor
3 €100–200 million Moderate
4 €200–400 million Significant
5 €400 million Major
C13 Risk assessment matrix
Degree of impact
Likelihoodofoccurrence
5
4
3
2
1
1 2 3 4 5
Low risk Medium risk High risk Very high risk
66
Infineon | Annual Report 2023
Further information
Consolidated Financial Statements
Management Board and Supervisory Board
Report on outlook, risk and opportunity
Risk and opportunity report
Combined Management Report
68.
All risks andopportunities reported for Infineon are reviewed for possible cumulative
effects and analyzed using an Infineon-specific categorization model that also takes
non-financial and sustainability-related risks into account. Interdisciplinary work-
shops held at division, corporate and regional levels support our risk and opportunity
analysis and enhance our risk and opportunity management culture. Important
information relevant for Infineon’s ICS and ERM is available to all employees via
our intranet system, including access to our guidelines containing job descriptions
for all functions involved in the process as well as all the information required for
reporting purposes.
Risk and Opportunity Managers are designated at appropriate hierarchy levels to
manage and monitor identified risks and opportunities according to their relevance.
They are responsible for formally determining a set of appropriate risk and opportunity
management strategies (in the case of risks: avoidance, mitigation, control, transfer
or acceptance). Working closely with corporate functions and individual managers
responsible for measures, the Risk and Opportunity Managers are also responsible
for defining and monitoring the measures aimed at implementing the management/
control strategy. The active and specific management and monitoring of risks and
opportunities are critical to the success of our system.
Compliance with the ICS and ERM approaches is monitored by the corporate function
responsible for risk management and ICS using procedures incorporated into business
processes. Group Internal Audit also performs tests for compliance with certain legal
requirements and Infineon guidelines and, where appropriate, rules relating to the
ICS and ERM and recommends corrective measures.
The Supervisory Board’s Investment, Finance and Audit Committee monitors the
appropriateness and effectiveness of both systems (ICS and ERM).
As part of the group audit, the external Group auditor also examines the early risk
detection system pursuant to section 91, paragraph 2 of the German Stock Corporation
Act (AktG) to ascertain its suitability to detect risks at an early stage that could pose
a threat to Infineon’s going-concern status in accordance with IDW Auditing Standard
340 and reports thereon annually to the Chief Financial Officer (CFO) and to the
Investment, Finance and Audit Committee of the Supervisory Board.
Compliance Management System
We have implemented a Group-wide Compliance Management System (CMS) to
manage compliance-related risks in a systematic, comprehensive and sustainable
manner. We are continuously enhancing the key elements of our CMS to prevent, detect
and respond to compliance-related incidents. The Corporate Compliance Officer
reports to the Chief Financial Officer and, on a quarterly basis, to the Management
Board and the Investment, Finance and Audit Committee of the Supervisory Board.
In structuring its CMS, Infineon has for years complied with IDW Auditing Standard
980 and has engaged an external auditing firm to confirm the appropriateness,
implementation and effectiveness of its CMS globally in the areas of “antitrust law”
and “corruption prevention” (last time in the 2018/2019 fiscal year). Since that time,
adherence to the CMS in the respective legal entities has been monitored by regular
internal audits.
As part of the CMS, a formal annual assessment of our risks is conducted with
a particular emphasis on corruption and antitrust laws. Any necessary measures
derived from this assessment are summarized in Infineon’s compliance program.
67
Infineon | Annual Report 2023
Further information
Consolidated Financial Statements
Management Board and Supervisory Board
Report on outlook, risk and opportunity
Risk and opportunity report
Combined Management Report
69.
Internal Control Systemwith respect to the
financial reporting process
The overriding objective of our “Internal Control System with respect to the financial
reporting process” as part of the general ICS and ERM described above is to monitor
and ensure the correctness, appropriateness and effectiveness of our accounting and
financial reporting. The ICS with respect to the financial reporting process, aims to
minimize the risk of misstatement in Group accounting and external reporting and to
provide reasonable assurance that the Consolidated Financial Statements comply
with all relevant regulations. For this to be the case, Group-wide compliance with
legal and internal regulations must be ensured. Clear responsibilities are assigned to
each of the processes.
The ICS with respect to the financial reporting process is also based on the framework
developed by the COSO “Internal Control – Integrated Framework” (2013) and is
part of the accounting process in all relevant legal entities and corporate functions.
The system monitors compliance with policies and procedures using preventive
and detective controls. Among other things, we regularly check that
›
Group-wide financial reporting, measurement and accounting guidelines are
continually updated and adhered to;
›
intragroup transactions are fully accounted for and properly eliminated;
›
issues relevant for financial reporting and disclosures in connection with agreements
entered into are recognized and appropriately presented;
›
processes and controls are in place to explicitly guarantee the completeness and
correctness of the financial reporting in the Separate and Consolidated Financial
Statements; and
›
processes are in place for the segregation of duties and for the four-eye principle
in the context of preparing financial statements, as well as for authorization and
access rules for relevant IT accounting systems.
Assessment of appropriateness and effectiveness
We systematically assess the appropriateness and effectiveness of the ICS with
respect to the financial reporting process. An annual risk analysis is initially performed,
and the defined controls are revised as and when required. The assessment involves
identifying and updating significant risks relating to accounting and financial reporting
in the relevant legal entities and corporate functions. The controls defined for identi-
fying risks are documented in accordance with Group-wide guidelines. Regular random
tests are performed to assess the appropriateness and effectiveness of these controls.
The tests constitute the basis for assessing the appropriateness of the design and
effectiveness of the controls. The results are documented and reported in a global
IT system. Any deficiencies identified are remedied, with due consideration given to
their potential impact.
Furthermore, all legal entities, divisions and relevant corporate functions confirm in
a Representation Letter that all business transactions, all assets and liabilities, and
all income and expense items have been duly recognized in the financial statements.
At the end of the annual cycle, the main legal entities review and confirm the appro-
priateness and effectiveness of the ICS with respect to the financial reporting process.
The Management Board and the Investment, Finance and Audit Committee of the
Supervisory Board are regularly informed about any significant control deficiencies
identified in the ICS with respect to the financial reporting process and about the
effectiveness of the internal controls in place.
68
Infineon | Annual Report 2023
Further information
Consolidated Financial Statements
Management Board and Supervisory Board
Report on outlook, risk and opportunity
Risk and opportunity report
Combined Management Report
70.
In the semi-annualmeetings of the Risk Committee, the Group-wide risk and
opportunity situation is evaluated, and the results of the internal control process are
discussed. In addition, an overall statement on the appropriateness and effectiveness
of our general ICS and ERM is produced once a year. This overall statement is based
on reviews conducted by Internal Audit, voluntary external reviews and audits, and
self-assessments. The evaluation here was conducted inter alia on the basis of the
following criteria:
›
Appropriate organizational coverage of the ICS and ERM processes of Infineon
›
Availability of clear Group-wide guidelines about the ICS and ERM processes
›
Timeliness of regular risk inventory, risk reporting processes and testing of
the controls
›
Timeliness and regular monitoring of ICS and ERM mitigation activities
›
Discussion of new risk topics with the managers responsible and with the Risk
Committee
On the basis of the findings of reviews by Internal Audit and external reviews and
audits, we make continual improvements to our ICS and ERM.
In all material respects, on the basis of the ICS and ERM activities conducted in the
2023 fiscal year, no factors came to our attention that would give rise to doubt as to
the appropriateness and effectiveness of the ICS and ERM system.
Both the general ICS and ERM and the ICS with respect to the financial reporting
process are continuously being developed and expanded to ensure compliance with
internal and external requirements. Improvements made to these systems contribute
to the ongoing monitoring of the relevant risk areas, including the responsible
organizational units.
Significant risks
In the following section, we describe risks that could have a significant or material
adverse impact on Infineon’s Segment Result and/or its business objectives, reputation
or compliance. We divide these risks into four main risk categories: “Strategic risks”,
“Operational risks”, “Financial risks” and “Legal and compliance risks”. Within these
main risk categories are risk sub-categories. The order in which the various risk
sub-categories are presented reflects their materiality to Infineon. This means that
the most material risk sub-category is mentioned at the beginning, and the risk
sub-categories are mentioned thereafter in descending order of materiality. The
materiality of each risk is determined on the basis of the total risk score for impact in
years 1 and 2. The risk score of an individual risk for impact in years 1 and 2 is calcu-
lated in each case by multiplying the likelihood of occurrence (on a scale of 1–5) by
the degree of impact of the risk (on a scale of 1–5). Unless otherwise stated, the risks
described within the risk sub-categories apply across the divisions.
The additional classification in “A”, “B” or “C” in brackets behind the respective title
of the risk sub-category results from the described materiality for Infineon and
enables a ranking of the risk sub-categories across the main risk categories. The risk
sub-categories with the bracketed addition “A” represent the first quartile of materiality
(highest risk sub-categories), “B” describes the second and third quartiles and “C”
the fourth quartile. The classification in the quartiles represents a change compared
to the classification in the previous year (high, medium, low).
69
Infineon | Annual Report 2023
Further information
Consolidated Financial Statements
Management Board and Supervisory Board
Report on outlook, risk and opportunity
Risk and opportunity report
Combined Management Report
71.
Strategic risks
Risks arisingfrom cyclical market and sector trends (A)
General market risks
The worldwide semiconductor market is dependent on global economic growth and
hence subject to fluctuations. Our target markets are therefore exposed to the risk of
short-term market fluctuations. As a result, our forecasts of Infineon’s future business
performance are subject to uncertainties. The absence of hitherto projected market
growth or an unforeseen decline in market growth (related, for example, to the expan-
sion of renewables or electromobility) would make it considerably more difficult to
attain our own growth target. We are countering this by entering into long-term sales
contracts as well as service contracts that are not dependent on the cycle. We also
address the fluctuations in economic conditions and customer demand that are typical
of the semiconductor business by continuously monitoring vital early warning indi-
cators and, as far as possible, by adopting specific mitigation strategies. Examples of
these strategies include making systematic adjustments to capacity and inventories
at an early stage, introducing cost-cutting measures and making flexible use of
external production facilities for both frontend and backend manufacturing.
If we were unprepared for market fluctuations or the mitigation strategy we had
adopted proved to be inappropriate, this could have a sustained adverse impact on
Infineon’s financial condition, liquidity and results of operations.
Risks arising from increased market competition and
commoditization of products
The spread of new technological developments in a global market also results in
greater replaceability of products. Due to the resulting price competition, we may be
unable to achieve our long-term strategic goals of gaining and/or maintaining market
share and of product pricing. Moreover, accelerating MA (merger and acquisition)
activities within the semiconductor industry or government subsidies restricted
to specific regions could result in even tougher competition. Potential benefits for
competitors in this market include improved cost structures and more effective sales
channels. There is also the risk that an increased volume of previously imported
semiconductors will be manufactured in China and that a greater volume of those
made in that country will be exported. Overall, this situation could have an adverse
impact on Infineon’s results of operations.
Corporate strategy risks (B)
Risks arising from an uncertain political and economic environment
As a globally operating company, our business is highly dependent on global economic
developments. A worldwide economic downturn – particularly in the markets we
serve – may result in not achieving our forecasted revenue and contribution to earn-
ings. Risks could also arise due to political and social changes, particularly when
those changes occur in countries in which we manufacture and/or sell our products.
Geopolitical risks in the 2023 fiscal year continue to be seen as very high, especially
as a result of the ongoing war in Ukraine, the conflict over Taiwan and the tensions
in the Middle East, which has significantly reduced the predictability of economic
development. The war in Ukraine is giving rise to risks and adverse impacts, such as
price increases and scarcity of energy and raw materials. Any escalation of the con-
flict beyond Ukraine would further increase the risk of a global economic downturn.
Rising inflation and increases in interest rates may also lead to a significant decline in
consumption.
Furthermore, customs disputes, export controls and export bans for advanced tech-
nology and/or critical basic materials, as well as trade restrictions such as those
between the USA and China, may constrain global trade, thereby dampening global
economic growth. This includes the risk of a decline in foreign demand from a Chinese
perspective and hence a decline in China’s gross domestic product. All of this may
have a significant impact on Infineon’s liquidity and results of operations.
70
Infineon | Annual Report 2023
Further information
Consolidated Financial Statements
Management Board and Supervisory Board
Report on outlook, risk and opportunity
Risk and opportunity report
Combined Management Report
72.
Macroeconomic risks
In additionto the risks mentioned above, the government debt situation worldwide,
which has changed very little in the 2023 fiscal year, continues to present a risk that,
regardless of our assessment of scenarios and potential outcomes within this complex
set of risks, may have an adverse impact on Infineon’s financial condition, liquidity
and results of operations.
Risks arising from acquisitions and cooperation arrangements (C)
In order to develop or expand our existing business, it may be appropriate for us
to make further acquisitions or enter into other forms of partnership with external
companies. In the case of acquisitions, there is a risk that we may be unsuccessful,
particularly regarding the integration of employees and products in existing business
structures. These issues could adversely impact Infineon’s financial condition and
results of operations.
Operational risks
Purchasing and logistical risks (B)
We cooperate with numerous suppliers who provide us with materials and services
or manage parts of our supply chain for whom there are not always multiple alter-
natives. We therefore partly depend on the delivery capability of our suppliers and the
quality of their supplies. At the same time, we face price increases from our suppliers,
and there is a risk that it will not be possible to pass on these increases in full to
our customers. In addition, the current conflict over Taiwan may affect the supply
situation for our Taiwanese partners. Any failure of one or more of these suppliers
to meet their obligations to Infineon could have an adverse impact on Infineon’s
liquidity and results of operations.
Another risk is the limited global availability of renewable energy, which could jeop-
ardize Infineon’s declared goal of becoming carbon-neutral by 2030. Infineon has
adopted a variety of measures to counter this risk (such as adopting its own efficiency
measures, evaluating the construction of its own solar plants, and forming partnerships
with local solar and wind farm operators).
In general, we seek to minimize procurement-related risks through our purchasing
strategies and the use of appropriate product and cost analyses (“Best Cost Country
Sourcing” and “Focus on Value”), as well as through geographical diversification.
These programs include cross-functional teams of experts who are responsible for
standardizing procurement processes for materials and technical equipment.
To take account of the growing importance of Infineon’s ecosystem partners (enter-
prises with which Infineon shares a significant long-term economic interest and which
represent added value for Infineon’s products), we have implemented a partner risk
evaluation system for Go2Market and IP/RD partners (intellectual property/research
and development). This partner risk assessment addresses Infineon’s dependence
on its ecosystem partners. As a result, the high-risk ecosystem partners throughout
the Group are identified and continuously assessed. Additionally, corrective risk miti-
gation measures are implemented to avoid an adverse impact on Infineon’s financial
condition, liquidity and results of operations and/or on its business objectives, repu-
tation and compliance.
Risks arising from manufacturing (B)
Our South-East Asian and European manufacturing sites are of great importance for
our production. If, for example, political upheavals, natural disasters or pandemic
outbreaks in one of these regions were to restrict or completely obstruct our ability to
manufacture at these sites at the planned scale or to export products manufactured
at the sites, this would have an adverse impact on our financial condition, liquidity
and results of operations.
Furthermore, our medium-term and long-term forecasts are based on expected
manufacturing cost trends for our products. In this context, measures aimed at
optimizing manufacturing costs for raw materials and supplies, energy, labor and
automation, as well as for bought-in services from external partners, may not be
71
Infineon | Annual Report 2023
Further information
Consolidated Financial Statements
Management Board and Supervisory Board
Report on outlook, risk and opportunity
Risk and opportunity report
Combined Management Report
73.
feasible to theextent envisaged. The dynamic markets and the increasing customer
need for flexibility, combined with short-term adjustments to order quantities, could
result in rising costs due to the underutilization of manufacturing capacities, higher
inventory levels and unfulfilled commitments to suppliers.
Thus, despite the fact that our manufacturing processes and sites have become even
more flexible due to cross-location production optimization, fluctuations in capacity
utilization levels or purchase commitments that have been entered into, coupled
with idle costs at the manufacturing sites, nevertheless continue to pose a cost risk.
In addition, frontend and backend manufacturing processes need to be optimally
synchronized to enable Infineon to develop and manufacture competitive, high-quality
products designed to provide new technological solutions. In view of the rapid pace
of technological change and the dynamics of customer requirements, we consider
this coordination needs to be increasingly sophisticated. Failure to make the required
progress in this area could result in quality problems, delays in product development
or market rollout, as well as higher research and development expenses, and hence
adversely impact Infineon’s liquidity and results of operations.
Risks that semiconductor companies operating in-house manufacturing facilities
typically face is that of construction delays at new manufacturing sites and delays
in the ramping up of production volumes at those sites, or delays in the transfer of
technology. One good example is the Automotive division, where customers’ product
approval and testing processes can be conducted over an extended period of time,
thus influencing our global manufacturing strategy as well as our short-term and
medium-term capacity utilization. Failure to anticipate these changes in the manu-
facturing process in good time may result in capacity shortages and hence lower
revenue or lead to idle costs due to underutilized capacity and therefore have an
adverse impact on earnings.
Moreover, our dependence on energy supplies for our production, as well as on
various components (such as wafers), raw materials (including gold and copper) and
specialty gases, exposes us to substantial price and supply risks. Price risks are also
attributable in part to the prevailing rate of inflation. In such a situation, if we are
unable to offset cost increases or pass them on to our customers, it could have an
adverse impact on our liquidity and results of operations.
In particular, a restriction of or interruption in the supply of natural gas for manufac-
turing sites in Europe could lead to significant disruptions to production. In the event
of an interruption to the natural gas supply and associated production disruptions,
we have secured in 2023 the supply of alternative energy sources for the operation of
the combined heat and power plants at selected locations and implemented further
energy-saving measures (such as heat recovery).
In some cases, we have used derivatives to hedge price risks with respect to the
amount of gold wire and electricity required for the 2024 fiscal year.
Risks relating to the areas of cyber security, information security
and IT security (C)
The reliability and security of Infineon’s data, systems and networks are of crucial
importance. At the same time, the world has seen a rise in threats in cyberspace. This
increasingly applies to the use of IT systems to support business processes as well as
supporting internal and external communications. Despite the array of precautionary
measures put in place, any major disruption to these systems could result in risks
relating to the confidentiality, availability and integrity of data used in research and
development, manufacturing, selling or administration functions, which, in turn, could
have an adverse impact on our reputation, production capability, competitiveness
and operations.
72
Infineon | Annual Report 2023
Further information
Consolidated Financial Statements
Management Board and Supervisory Board
Report on outlook, risk and opportunity
Risk and opportunity report
Combined Management Report
74.
Potential cyber-attacks ondata, systems and networks used in our manufacturing
processes present risks that could result in production downtime and supply bottle-
necks. In addition, cyber-attacks with industrial espionage intent and any related
potential loss of intellectual property or patents pose risks that could jeopardize our
investment in research and development and impair our long-term competitiveness.
Infineon has had a global cyber security program in place for many years now to
ensure that it is suitably protected and prepared for the constantly changing cyber
security threat situation. A key element of this program is our Cyber Information
Security Management System (CISMS). This system, which takes a structured approach,
aims to identify and evaluate risks to our data, information systems, networks, products,
solutions and services, to constantly improve our protective measures, processes and
tools and to adapt them to the threat situation. Our CISMS covers all areas of Infineon’s
business and is certified in accordance with international standards (including TISAX).
The effectiveness of the CISMS is continuously monitored in the course of regular
internal and external audits.
Risks relating to the development process and product lifecycle (C)
The ever-increasing complexity of technologies and products, shorter development
cycles and dynamic customer demands can cause a great deal of tension in the
field of product development. Buffer times built into processes to compensate for
potential delays are reduced accordingly. If we are unable to execute our development
plans, this could result in delays and increased development costs.
This situation is exacerbated by the fact that some of our products are highly depen-
dent on the degree of commercial success achieved by individual customers in their
own markets. Furthermore, there is the risk of losing future business and design wins
if we are unable to deliver volumes above our contractual obligations if called upon
by customers to do so. These factors could have an adverse impact on Infineon’s
liquidity and results of operations.
A structured project management system is in place to handle development projects,
including those of a customer-specific nature. To help us identify potential project
risks at an early stage and use specific measures to counter these risks, we require
projects to have clear project milestones, ongoing verification procedures and clearly
defined limits of approval authority.
Product quality assurance is of crucial importance. Shortfalls in product quality can
lead to product recalls at our customers and related potential costs for liability claims.
In addition, quality risks could also damage Infineon’s reputation and thus have a
significant adverse impact on its future business, liquidity and results of operations.
To avoid quality risks, we have adopted various quality management strategies such
as “FMEA” (Failure Mode and Effects Analysis) and “Six Sigma” in order to prevent
or solve problems and to continue to improve all our business processes. Our Group-
wide quality management system has been certified for a number of years in accor-
dance with ISO 9001 and ISO/TS 16949 and also encompasses the development
processes of our suppliers.
Our processes and initiatives to ensure continuous improvement are aimed, among
other things, at identifying and eliminating the causes of quality-related problems
at an early stage.
Risks relating to the availability of qualified employees (C)
One of the key factors in our success is qualified employees. There is a general risk
of not being able to recruit enough people or people who are sufficiently qualified
to work at Infineon, of losing existing qualified staff or failing to provide them with
adequate training, and of not retaining people in the business. A lack of technical or
management personnel could, among other things, restrict future growth and hence
adversely impact Infineon’s liquidity and results of operations.
73
Infineon | Annual Report 2023
Further information
Consolidated Financial Statements
Management Board and Supervisory Board
Report on outlook, risk and opportunity
Risk and opportunity report
Combined Management Report
75.
To counter theserisks, Infineon has set up its own work group. The specific remit of
this work group is employee recruitment, retention and training.
Business continuity risks (C)
An increasing number of events, such as extreme weather conditions (e.g., floods,
drought, storms) and other damaging events (e.g., earthquake, fire, chemical accidents,
power failures) could pose a threat at any time to our production facilities and office
buildings in all the main operating segments and thus have an adverse impact on our
business success.
We counter these risks on an individual site basis with appropriate mitigation mea-
sures, business interruption insurances and other business continuity structures,
all of which are reviewed regularly by conducting stress tests to ensure their appro-
priateness and effectiveness.
Financial risks
Currency risks (C)
The international orientation of our business activities creates cash flows in a num-
ber of currencies other than the euro, primarily in US dollars. A significant share of
revenue, operating costs and capital expenditures is denominated in US dollars and
correlated currencies. For the most part, Infineon generates a US dollar surplus from
these transactions.
Specified currencies are hedged Group-wide by means of derivative financial instru-
ments. These hedges are based on forecasts of future cash flows, the occurrence
of which is uncertain. Under these circumstances and despite hedging measures,
exchange rate fluctuations could adversely impact Infineon’s results of operations.
Risk of default of banks and financing partners (C)
The relatively high level of our holdings of liquid funds (gross cash position) exposes
us to the potential risk of a default of one or more of the banking and financing
partners with whom we do business. We mitigate this risk – which could still arise
despite various state-insured deposit protection mechanisms – by a combination of
risk avoidance analyses and risk-spreading measures. The failure of these measures
could have a materially adverse impact on Infineon’s financial condition and liquidity.
Further information regarding the management of financial risks is provided in
note 28 to the Consolidated Financial Statements. p. 150 ff.
Other financial risks (C)
In principle, there is a risk that a breach in the financial covenants of capital market
instruments (such as the net debt ratio) might lead to a credit event (default) and
potentially to a cross-default, resulting in possible changes to existing or outstanding
debts. However, this risk is currently considered to be very low. Nonetheless, regular
monitoring of our projected Segment Result and of our liquidity and debt enables
us to identify any aggravation of this risk at an early stage and to apply appropriate
countermeasures.
Tax risks (C)
Infineon could be exposed to tax risks arising from prior assessment periods and
changes in tax legislation or jurisdiction. Unforeseen tax expenses might occur relating
to prior assessment periods that have not yet been the subject of a tax audit or are
currently the subject of a tax audit in the various countries in which Infineon operates.
The realization of any of these risks could result in fines and penalties and therefore
have an adverse impact on the Group’s financial condition, liquidity and results
of operations.
Infineon adopts a number of strategies to mitigate these risks. These include,
among others, regular employee training, a Tax Compliance Management System for
selected sites, and internal audits to ensure adherence to important compliance
regulations in all legal entities of the Group (Framework for Internal Controls in the
Tax Process).
74
Infineon | Annual Report 2023
Further information
Consolidated Financial Statements
Management Board and Supervisory Board
Report on outlook, risk and opportunity
Risk and opportunity report
Combined Management Report
76.
Legal and compliancerisks
Regulatory risks (B)
Compliance risks
There is a risk that, due to inappropriate business conduct by employees, Infineon
could violate antitrust regulations or laws combating bribery and corruption. Potential
consequences might include heavy financial penalties, compensation claims, the
cost of external support (such as lawyers’ fees), damage to Infineon’s reputation and
exclusion from tendering for public contracts.
We have therefore introduced a Group-wide Compliance Management System (CMS)
to manage these compliance-related risks in a systematic, comprehensive and sus-
tainable manner. We continue to refine the key elements of our CMS. One of the ways
we are doing this is by providing specific employee training designed to prevent,
detect and react to compliance-related incidents. The Corporate Compliance Officer
reports on a regular basis to the Chief Financial Officer, the Management Board as
a whole and the Investment, Finance and Audit Committee of the Supervisory Board.
Export control risks
As a result of the increasing complexity and frequent changes to export control
regulation in all the countries in which Infineon operates, there is a risk of not com-
plying fully with all applicable national and international export control laws and
regulations, which might result in fines and penalties. This could have an impact on
Infineon’s results of operations or could influence the availability of export permits.
The central Export Control department is responsible for the implementation of
effective measures relating to export control legislation and foreign trade to avoid
sanctions and fines being imposed on Infineon. To prevent divergence from the
relevant regulations, Infineon has introduced organizational measures (such as
appointing local managers responsible for export control) and implemented training
measures for all the employees concerned. It is also using Group-wide approval
routines in all relevant processes, conducting internal audits of export control and
implementing other control measures.
Data protection risks
In principle, there is a risk that there could be a violation of laws and regulations
relating to the processing and use of personal data, which could lead to data breaches,
resulting in severe penalties and/or reputational damage. The Data Protection
Management System (DPMS) established by Infineon to mitigate this risk sets out
rules and standards for the Group-wide processing of personal data and monitors
compliance with these rules and standards.
Other legal risks (C)
Risks arising from the Qimonda insolvency
The insolvency proceedings relating to Qimonda and the resulting actions of the
insolvency administrator expose Infineon to potential risks, which are described in
detail in note 24 to the Consolidated Financial Statements. p. 136 ff.
Provisions are recognized in connection with these matters as of 30 September 2023.
The provisions reflect the amount of those liabilities that management believes are
probable and can be estimated with reasonable accuracy as of that date. There can
be no assurance that these provisions will be sufficient to cover all liabilities that may
be incurred in conjunction with the insolvency proceedings relating to Qimonda.
Risks relating to intellectual property rights and patents
As with many other companies in the semiconductor industry, allegations are made
against us from time to time that we have infringed upon other parties’ protected
rights. Regardless of the prospects of success of such claims, substantial legal defense
costs can arise.
75
Infineon | Annual Report 2023
Further information
Consolidated Financial Statements
Management Board and Supervisory Board
Report on outlook, risk and opportunity
Risk and opportunity report
Combined Management Report
77.
We cannot ruleout that patent infringement claims will be upheld in a court of law,
thus resulting in significant claims for damages or restrictions on selling the products
concerned. Any such outcome could, in turn, have an adverse impact on Infineon’s
financial condition, liquidity and results of operations.
One of the ways in which we counter patent-related risks is by adopting a specific
patent strategy. This includes patent searches in relation to development projects,
the systematic registration of our own patents and patent cross-licensing arrange-
ments with major competitors. However, no such opportunities exist to safeguard
against risks of this nature in the case of companies specializing in the exploitation
of patent rights.
Further information regarding litigation and government inquiries is provided in
note 24 to the Consolidated Financial Statements. p. 136 ff.
Risks arising from our global operations
Our global business strategy requires the maintenance of research and development
locations and manufacturing sites throughout the world. The location of such facilities
is determined by market entry hurdles and by technology and cost factors. Risks
could therefore arise if economic and geopolitical crises were to impact our regional
markets and if country-specific legislation and regulations were to influence invest-
ment activities and the ability to trade freely. Differing practices in the way tax, judicial
and administrative regulations are interpreted could also restrict business activities.
In addition, we could also be exposed to the risk of fines, sanctions and reputational
damage.
Asian markets are particularly important to our long-term growth strategy. Our
operations in China are influenced by a legal system that may be subject to change.
One example is the fact that local regulations could make it mandatory to enter into
partnerships with local companies. These circumstances could lead to Infineon’s
intellectual property no longer being sufficiently protected or to intellectual property
developed by Infineon in China not being freely transferable to other countries and
locations, thus impairing Infineon’s financial condition and results of operations.
Overall statement by Group management
on the risk situation
The overall risk assessment is based on a consolidated view of all significant
individual risks. The risk situation as a whole remains essentially unchanged from
the previous year. We are currently not aware of any individual risks capable of
jeopardizing Infineon’s going-concern status.
Significant opportunities
Opportunities arising from decarbonization, digitization and the strategic approach
“Product to System” have already been included in the forecast report and are
described here as additional overarching opportunities.
The classification into “A”, “B” or “C” in brackets after the respective title of the
opportunity is carried out in the same way as the classification for the risks.
Opportunities arising from decarbonization and the acceleration
of the energy transition
With a constantly growing world population and increasing industrialization, global
demand for energy is rising. Electric power is becoming the most important energy
form of the 21st century, while renewables are playing a key role in curbing carbon
emissions. The long-term objective is to achieve global decarbonization by the end
of the century, as resolved at the Climate Change Conference held in Paris (France)
in December 2015. As part of its Green Deal concept, the European Union intends to
become carbon-neutral by 2050.
To achieve this target, it will be necessary to develop renewable sources of energy
at a faster rate than originally envisaged. This should lead to an increase in demand
for our products, as Infineon’s semiconductors enable electric power to be generated
more efficiently from renewable energy sources. Indeed, they offer efficiency gains
at all stages of the energy industry’s conversion chain, whether in generation, trans-
mission, storage or, above all, in the use of electric power. They form the basis for the
intelligent and efficient use of electric power, for instance, in industrial applications,
power supplies for computers, consumer electronics and vehicles.
76
Infineon | Annual Report 2023
Further information
Consolidated Financial Statements
Management Board and Supervisory Board
Report on outlook, risk and opportunity
Risk and opportunity report
Combined Management Report
78.
Opportunities arising fromdigitalization
The trend towards digitalization offers substantial business potential for Infineon. This
is reflected in the optimization of internal processes, such as for our interconnected
manufacturing lines on a global scale, as well as in sales and administration. Further-
more, our portfolio of sensors, microcontrollers, power semiconductors, security chips
and security solutions, as well as specific software, puts us in an excellent position
to successfully exploit growing market potential. The strategic approach “Product
to System” we have already implemented makes us very well prepared to penetrate
and develop the markets involved. Good examples already apparent today include
automated driving, the smart home and the advancing development of the IoT.
Additional opportunities are arising from accelerated and/or broader market pene-
tration by digital products. In this context, the issue of “security and data integrity”
plays a very important role. We are able to address this issue by offering our customers
appropriate security chips and security solutions.
Opportunities arising from our strategic approach “Product to System”
With the strategic approach “Product to System”, we seek to identify additional
benefits for our customers at a system level from within our broad portfolio of tech-
nologies and products. This strategy enables us to exploit further revenue growth
potential, reduce customers’ development costs and shorten the lead times required
to bring their products to market and thereby support our growth and margin targets.
The principal opportunities are described in the following section, divided into
“Strategic opportunities”, “Operational opportunities” and “Financial opportunities”,
which are to be seen in addition to the future business prospects mentioned in the
forecast report. However, these represent only a selection of the opportunities avail-
able to Infineon. Our assessment of opportunities is also subject to continual change.
This reflects the fact that our business, our markets and the technologies we deploy
are constantly subject to new developments, bringing with them fresh opportunities
and causing others to become less relevant or otherwise changing the significance
of an opportunity from our perspective.
Strategic opportunities
Opportunities arising from cyclical market and sector trends (A)
Growth opportunities relating to data centers and mobile applications
The ongoing trends in the areas of artificial intelligence (AI) training and machine
learning (ML) are reflected in the high level of demand for solutions that will ensure
efficient and effective power management (high-voltage and low-voltage power
transistors, driver ICs and control ICs) for data centers.
Opportunities arising from the growth of semiconductor content in vehicles
We expect semiconductor content per vehicle to continue growing. The primary
driving force behind this trend is the rising demand for electromobility, active safety
and comfort features, and driver assistance systems.
We are convinced that current global carbon emissions targets cannot be achieved
without further electrification. The need for increased efforts in this field is relevant
not only for electromobility (i.e., hybrid, plug-in hybrid and all-electric vehicles)
but also for power units in vehicles with combustion engines. Moreover, the trend
towards automated and assisted driving offers great potential for our sensors and
microcontrollers.
Opportunities arising from new technologies and materials
We are constantly striving to develop new technologies, products and solutions and
to improve on existing ones, both separately and in collaboration with customers.
We therefore continually invest in areas such as research and development into
the use of new technologies and materials. Those in current use may well lose their
predominance in the foreseeable future (such as Si, which is reaching its physical
limits in some applications).
We therefore see numerous opportunities for working with new materials, such as
SiC and GaN, to develop more powerful and/or lower-cost products. These materials
could well have a positive influence on our ability to attain our strategic growth and
profitability targets.
77
Infineon | Annual Report 2023
Further information
Consolidated Financial Statements
Management Board and Supervisory Board
Report on outlook, risk and opportunity
Risk and opportunity report
Combined Management Report
79.
Opportunities relating tomarket access and activities in China
China is one of the world’s largest automotive markets, and its growth potential
remains high. In particular, high rates of growth for electric-powered vehicles make
China one of the largest markets for electromobility.
The expansion of renewable energy sources in China has also become hugely important.
Our presence in this market, alongside our collaboration with leading companies in
the wind and solar power sectors, will create further opportunities for long-term growth.
Operational opportunities
Opportunities relating to our ability to meet supply requirements
with available capacity (C)
Our in-house manufacturing capacities, together with those of our external partners,
provide us with a degree of flexibility to meet demand. In particular, the further
expansion of 300-millimeter production and the planned new investment in the
fourth manufacturing module in Dresden (Germany), the second fully automated
300-millimeter factory at the Villach site (Austria), the third manufacturing module
in Kulim Phase 1 (Malaysia) currently under construction, and the new planned
expansion of wide band gap capacity in Kulim Phase 2 (Malaysia) will strengthen
our ability to meet the growing demand for power semiconductors. Furthermore,
additional production capacity, including external capacity, can help to meet future
customer demand.
Financial opportunities
Currency opportunities (B)
Just as there are risks arising from currencies, as described in the risk section above,
there are also opportunities for Infineon in this area if exchange rates move in a way
that is favorable to the Group. This may have a positive impact on Infineon’s financial
condition, liquidity and results of operations.
Other opportunities arising from Infineon’s liquidity situation (C)
Our current liquidity position, which is described in detail in the chapter “Review of
liquidity”, p. 55 ff., provides us with the financial headroom for organic growth and
growth by acquisition and enables us to make use of favorable refinancing conditions,
if necessary.
78
Infineon | Annual Report 2023
Further information
Consolidated Financial Statements
Management Board and Supervisory Board
Report on outlook, risk and opportunity
Risk and opportunity report
Combined Management Report
80.
In addition toreporting on Infineon as a whole, in the following section we also
provide information on the performance of Infineon Technologies AG.
Infineon Technologies AG is the parent company of Infineon and performs the Group’s
management and corporate functions. It is responsible for key Group-wide functions
such as Finance and Accounting, Treasury Management, Investor Relations, Corporate
Compliance, Internal Audit, Business Continuity, Business Excellence, Information
Technology, Strategy, Mergers and Acquisitions, Legal and Patents, Human Resources,
strategic and production-oriented research and development activities and Corpo-
rate and Marketing Communication worldwide. Furthermore, it manages supply
chain processes throughout the Group. Infineon Technologies AG also has its own
manufacturing facilities, located in Regensburg and Warstein (both in Germany).
Unlike the Consolidated Financial Statements, which are prepared in accordance with
International Financial Reporting Standards (IFRS), the Separate Financial Statements
of Infineon Technologies AG are prepared in accordance with the provisions of the
German Commercial Code (HGB). The complete Separate Financial Statements are
published separately.
www.infineon.com/cms/en/about-infineon/investor/reporting/financial-statements-hgb/
Earnings position
Continuing high demand for semiconductor products (which had an impact on both
volumes and prices) led to an increase in revenue for Infineon Technologies AG of
25 percent to €9,865 million (2022: €7,920 million). Gross profit rose accordingly by
23 percent to €3,971 million (2022: €3,238 million). Operating expenses (research
and development expenses, selling, general and administrative expenses) increased
in the 2023 fiscal year at a lower rate than revenue, by €226 million to €2,453 million
(2022: €2,227 million), thus comprising 24.9 percent of revenue (2022: 28.1 percent).
The net figure for other income/expenses improved, primarily as a result of currency
fluctuations, especially with regard to the US dollar exchange rate. There was also an
improvement in the interest result, due in particular to the positive performance of
the plan assets for pensions and similar commitments. The improvement in earnings
before tax of €928 million resulted in an increase in the income tax expense of
€154 million.
The net profit of Infineon Technologies AG in the 2023 fiscal year was €1,420 million,
following a net profit of €646 million in the previous fiscal year. After transferring a total
of €710 million to retained earnings, unappropriated profit amounted to €710 million.
Statement of income of Infineon Technologies AG in accordance with
the German Commercial Code (condensed)
€ in millions 2023 2022
Change
absolute in %
Revenue 9,865 7,920 1,945 25
Cost of goods sold (5,894) (4,682) (1,212) (26)
Gross profit 3,971 3,238 733 23
Research and development expenses (1,599) (1,394) (205) (15)
Selling expenses (550) (533) (17) (3)
General and administrative expenses (304) (300) (4) (1)
Other income (expense), net 132 (119) 251 +++
Result from investments, net 43 67 (24) (36)
Interest result (14) (201) 187 93
Other financial result 4 (3) 7 +++
Income tax (263) (109) (154) –––
Income after taxes/net profit 1,420 646 774 +++
Transfers to retained earnings (710) (228) (482) –––
Unappropriated profit 710 418 292 70
Infineon Technologies AG
79
Infineon | Annual Report 2023
Further information
Consolidated Financial Statements
Management Board and Supervisory Board Combined Management Report
Infineon Technologies AG
81.
Net assets andfinancial position
Total assets increased by 11 percent, from €20,766 million as of 30 September 2022 to
€22,990 million as of 30 September 2023. Non-current assets rose by €1,041 million,
mainly due to an increase in loans to affiliated companies. Current assets increased
by €1,186 million as a result of the higher volume of business. Receivables and other
assets rose by €627 million and inventories by €614 million. Offsetting these increases
was the decrease in cash and cash equivalents and marketable securities of €55 million
to €3,347 million (30 September 2022: €3,402 million). Cash and cash equivalents
and marketable securities accounted for 39 percent of current assets.
The increase in equity of €1,048 million was mainly due to the net profit for the
2023 fiscal year of €1,420 million, offset by the dividend paid out for the 2022 fiscal year
of €417 million.
Provisions for pensions and similar commitments decreased by a total of €14 million,
due to an increase in the value of the plan assets that exceeded the increase in
the settlement amount. Other provisions rose by €203 million, mainly due to the
increase of €128 million in tax provisions. Liabilities increased in the 2023 fiscal year
by €988 million to €10,608 million, mainly due to the development of liabilities
to affiliated companies as a result of the higher volume of business.
The equity ratio at 30 September 2023 was 47.2 percent, the same figure as of the
end of the previous year.
For information on Infineon’s own shares, please see the comments relating to
section 160, paragraph 1, no. 2 of the German Stock Corporation Act (AktG) provided
in the Separate Financial Statements of Infineon Technologies AG.
www.infineon.com/cms/en/about-infineon/investor/reporting/financial-statements-hgb/
Statement of financial position of Infineon Technologies AG
in accordance with the German Commercial Code (condensed)
30 Septem-
ber 2023
30 Septem-
ber 2022
Change
€ in millions absolute in %
Intangible assets, property, plant and equipment 680 620 60 10
Financial assets 13,663 12,682 981 8
Non-current assets 14,343 13,302 1,041 8
Inventories 2,215 1,601 614 38
Receivables and other assets 2,950 2,323 627 27
Cash and cash equivalents, marketable securities 3,347 3,402 (55) (2)
Current assets 8,512 7,326 1,186 16
Prepaid expenses 135 137 (2) (1)
Active difference resulting from offsetting – 1 (1) –––
Total assets 22,990 20,766 2,224 11
Share capital 2,608 2,605 3 0
Capital reserves 3,581 3,545 36 1
Retained earnings 3,958 3,241 717 22
Unappropriated profit 710 418 292 70
Shareholders’ equity 10,857 9,809 1,048 11
Provisions for pensions and similar commitments 386 400 (14) (4)
Other provisions 1,138 935 203 22
Provisions 1,524 1,335 189 14
Bonds 3,881 4,632 (751) (16)
Loans payable to banks – 1 (1) –––
Advance payments received 52 – 52 +++
Trade payables 657 464 193 42
Liabilities to affiliated companies 5,060 3,627 1,433 40
Other liabilities 958 896 62 7
Liabilities 10,608 9,620 988 10
Deferred income 1 2 (1) (50)
Total liabilities and shareholders’ equity 22,990 20,766 2,224 11
80
Infineon | Annual Report 2023
Further information
Consolidated Financial Statements
Management Board and Supervisory Board Combined Management Report
Infineon Technologies AG
82.
Dividend
In accordance withthe German Stock Corporation Act (AktG), the amount of the divi-
dend available for distribution to shareholders is based on the level of unappropriated
profit recorded by the ultimate parent company, as determined in accordance with
the provisions of the German Commercial Code (HGB).
The ultimate parent company Infineon Technologies AG, after making a transfer to
other retained earnings, reported unappropriated profit of €710 million in its financial
statements for the fiscal year ended 30 September 2023. With regard to the 2023
fiscal year, a proposal will be made to pay a dividend of €456 million, or €0.35 per
dividend-entitled share, out of the unappropriated profit of Infineon Technologies AG.
The disbursement of the proposed dividend is subject to approval by the shareholders.
The Company paid a dividend of €0.32 per share (€417 million in total) for the
2022 fiscal year.
For information regarding Infineon’s long-term dividend policy, see the “Dividend”
paragraph in the chapter “Infineon on the capital market”. p. 60
Expected developments and associated
significant risks and opportunities
Expected developments at Infineon Technologies AG and the associated significant
risks and opportunities are essentially identical to those of the Group as a whole.
As a general rule, Infineon Technologies AG participates in the risks of its subsidiaries
and equity investments on the basis of the extent of its shareholding. As the parent
company of the Group, Infineon Technologies AG is integrated into the Group-wide
risk management and internal control systems. For more information on this topic,
expected developments and associated significant risks and opportunities, see the
chapter “Risk and opportunity report”. p. 65 ff.
Most transactions within the Group involving derivative financial instruments are
handled by Infineon Technologies AG. The comments provided in “Principles and
structure of Infineon’s treasury” within the chapter “Review of liquidity”, p. 57,
regarding the nature and scope of transactions with derivative financial instruments
and hedged risks also apply to Infineon Technologies AG. Information on this subject
is also provided in the Notes to the Separate Financial Statements of Infineon
Technologies AG.
www.infineon.com/cms/en/about-infineon/investor/reporting/financial-statements-hgb/
81
Infineon | Annual Report 2023
Further information
Consolidated Financial Statements
Management Board and Supervisory Board Combined Management Report
Infineon Technologies AG
83.
Information pursuant to
section289a, paragraph 1 and
section 315a, paragraph 1 of the
German Commercial Code (HGB)
Structure of the subscribed capital
The share capital of Infineon Technologies AG stood at €2,611,842,274 as of
30 September 2023. This sum is divided into 1,305,921,137 no par value registered
shares, each of which represents a notional portion of the share capital of €2
per share. Each share carries one vote and gives an equal right to the profit of the
Company based on the profit appropriation resolved by the shareholders at the
Annual General Meeting.
The Company held 2,171,026 of the abovementioned issued shares as own shares
as of 30 September 2023 (30 September 2022: 3,689,901). Own shares held by the
Company on the date of the Annual General Meeting do not carry a vote and are not
entitled to participate in profit.
Restrictions on voting rights or the transfer of shares
Restrictions on the voting rights of shares may, in particular, arise as a result of the
regulations set out in the German Stock Corporation Act (Aktiengesetz – “AktG”). For
example, pursuant to section 136 AktG, shareholders are prohibited from voting under
certain circumstances and, pursuant to section 71b AktG, Infineon Technologies AG
has no voting rights on its own shares. Furthermore, non-compliance with the notifi-
cation requirements pursuant to section 33, paragraphs 1 or 2 of the German Securi-
ties Trading Act (Wertpapierhandelsgesetz - “WpHG”) and section 38, paragraph 1, or
section 39, paragraph 1 WpHG can, pursuant to section 44 WpHG, have the effect that
certain rights (including the right to vote) may, at least temporarily, not exist. We are
not aware of any contractual restrictions on voting rights or on the transfer of shares.
Pursuant to section 67, paragraph 2 AktG, rights and obligations arising from shares
in relation to Infineon Technologies AG exist only for and from the parties entered
in the share register. In order to be recorded in the share register, shareholders are
required to submit to Infineon Technologies AG the number of shares held by them
and their name or company name, their postal and electronic address and, where
applicable, their registered office and their date of birth. Pursuant to section 67,
paragraph 4 AktG, Infineon Technologies AG is entitled to request information from
the party listed in the share register regarding the extent to which the shares relating
to the entry in the share register are actually owned by the registered party and, if
not, to receive the information necessary for the maintenance of the share register
in relation to the party for whom the shares are held. Section 67, paragraph 2 AktG
stipulates that the shares concerned do not confer voting rights until such time as the
information requested has been supplied in the appropriate manner.
Direct or indirect shareholdings exceeding 10 percent
of the voting rights
Section 33, paragraph 1 WpHG requires each shareholder whose voting rights reach,
exceed or, after exceeding, fall below 3, 5, 10, 15, 20, 25, 30, 50 or 75 percent of the
voting rights of a listed corporation to notify such corporation and the German Federal
Financial Supervisory Authority (Bundesanstalt für Finanzdienstleistungsaufsicht –
“BaFin”) immediately. As of 30 September 2023, we have not been notified of any
direct or indirect shareholdings reaching or exceeding 10 percent of the voting rights.
The shareholdings notified to us as of 30 September 2023 are presented in the Notes
to the Separate Financial Statements of Infineon Technologies AG under the infor
mation pursuant to section 160, paragraph 1, number 8 AktG.
Shares with special rights that confer control rights
No shares conferring special control rights have been issued.
Corporate Governance
82
Infineon | Annual Report 2023
Further information
Consolidated Financial Statements
Management Board and Supervisory Board Combined Management Report
Corporate Governance
Information pursuant to the German Commercial Code (HGB)
84.
Nature of controlover voting rights when employees participate in
the Company’s capital and do not exercise their control rights directly
Employees who participate in the capital of Infineon Technologies AG exercise
their control rights directly in accordance with the applicable laws and the Articles
of Association, just like other shareholders.
Statutory regulations and Articles of Association provisions governing
the appointment and dismissal of members of the Management Board
and amendments to the Articles of Association
Section 5, paragraph 1 of the Articles of Association stipulates that the Management
Board of Infineon Technologies AG is required to consist of at least two members.
With effect from 15 April 2021, the Management Board comprises five members
(previously four members). Management Board members are appointed and dis-
missed by the Supervisory Board pursuant to section 84, paragraph 1 AktG. As
Infineon Technologies AG falls within the scope of the German Co-Determination Act
(Mitbestimmungsgesetz – “MitbestG”), the appointment or dismissal of Management
Board members requires a two-thirds majority of the votes of the Supervisory Board
members (section 31, paragraph 2 MitbestG). If the required majority is not achieved
at the first ballot, the appointment may be approved on the recommendation of
the Mediation Committee at a second ballot by a simple majority of the votes of the
Supervisory Board members (section 31, paragraph 3 MitbestG). If the required
majority is still not achieved, a third ballot is held in which the chairman of the Super-
visory Board has two votes (section 31, paragraph 4 MitbestG).
In urgent cases, if the Management Board does not have the required number of
members, the local court (“Amtsgericht” of Munich) makes the necessary appointment
upon the petition of a party concerned pursuant to section 85, paragraph 1 AktG.
Pursuant to section 84, paragraph 1, sentence 1 AktG, the maximum term of appoint-
ment for Management Board members is five years. Re-appointment or an extension
of the term of office, in each case for a maximum of five years, is permitted (section 84,
paragraph 1, sentence 2 AktG). Section 5, paragraph 1 of the Articles of Association
and section 84, paragraph 2 AktG stipulate that the Supervisory Board may appoint
a chairman and a deputy chairman to the Management Board. The Supervisory Board
may revoke the appointment of a Management Board member and the chairman of
the Management Board for good cause (section 84, paragraph 4 AktG).
Pursuant to section 179, paragraph 1 AktG, responsibility for amending the Articles of
Association rests with the Annual General Meeting. However, section 10, paragraph 4
of the Articles of Association gives the Supervisory Board the authority to amend the
Articles of Association insofar as any such amendment relates merely to the wording,
such as changes in the share capital amount resulting from a capital increase out of
conditional or authorized capital or a capital decrease by means of cancellation of own
shares. Unless the Articles of Association provide for another majority, section 179,
paragraph 2 AktG stipulates that resolutions of the Annual General Meeting regarding
the amendment of the Articles of Association require a majority of at least three-
quarters of the share capital represented. Section 17, paragraph 1 of the Articles of
Association of Infineon Technologies AG provides in principle for resolutions to be
passed with a simple majority of the votes cast and, when a capital majority is required,
with a simple majority of the capital, unless a higher majority is required by law or
in accordance with other stipulations contained in the Articles of Association.
Powers of the Management Board, particularly with respect to
issuing or buying back of shares
The power of the Management Board to issue shares derives from section 4 of the
Articles of Association of the Company, in conjunction with applicable legal provisions.
Further information relating to the Company’s existing Authorized and Conditional
Capital can be found in note 20 to the Consolidated Financial Statements, p. 129 ff..
83
Infineon | Annual Report 2023
Further information
Consolidated Financial Statements
Management Board and Supervisory Board Combined Management Report
Corporate Governance
Information pursuant to the German Commercial Code (HGB)
85.
Authorization to issueconvertible bonds and/or bonds with warrants
The Annual General Meeting held on 20 February 2020 authorized the Management
Board, in the period through 19 February 2025, either once or in partial amounts, to
issue convertible bonds and/or bonds with warrants (referred to collectively as “bonds”)
of an aggregate nominal amount of up to €4,000,000,000, to guarantee such bonds
issued by subordinated Group companies of the Company and to grant bond creditors
and/or bondholders conversion or option rights to up to 130,000,000 no par value
registered Company shares, representing a notional portion of the share capital of up
to €260,000,000 in accordance with the relevant terms of the bonds. With the approval
of the Supervisory Board, the Management Board is authorized to exclude the right
of shareholders to subscribe to the bonds
›
if the issue price is not substantially lower than the bonds’ theoretical market
value as determined in accordance with accepted valuation methods, particularly
those based on financial mathematics. However, this right of exclusion only
applies insofar as the aggregate value of the shares to be issued to service the con-
version or option rights established on this basis does not exceed 10 percent of the
share capital, neither at the time the resolution concerning this authorization was
passed by the Annual General Meeting, at the time of this authorization becoming
effective, nor at the time it is exercised;
›
in order to exclude fractional amounts resulting from a given subscription ratio
from the subscription rights of the shareholders to the bonds or insofar as any such
action is necessary in order to grant holders of conversion or option rights arising
from bonds that have already been or will in future be issued by the Company
or its subordinated Group companies subscription rights to that extent to which
they would be entitled after exercising their rights, or after the fulfillment of any
conversion or option obligations; or
›
insofar as bonds are issued in return for a capital contribution in kind, provided
that the value of any such capital contribution in kind is appropriate in relation to
the market value of the bonds.
Even if the dilution protection regulations are applied, the conversion or option
price must equal at least 80 percent of the arithmetic mean of the closing prices
of the Company’s share in Xetra trading on the Frankfurt Stock Exchange (or a com
parable successor system). Further details – including the conditions under which the
conversion or option price may be reduced – are set out in the authorization.
Subject to the requirements resolved by the shareholders at the Annual General
Meeting, the Management Board is authorized to determine the further details of the
bond issue, including its terms and conditions.
Authorization to acquire own shares
A resolution passed by the Annual General Meeting on 16 February 2023 authorized
Infineon Technologies AG, in the period through 15 February 2028, to acquire its own
shares, within the statutory boundaries, in an aggregate amount not exceeding
10 percent of the share capital at the time the resolution was passed or – if the latter
amount is lower – of the share capital in existence at the time the authorization is
exercised. The Company may not use the authorization for the purpose of trading in
its own shares. The Management Board decides whether own shares are acquired
through the stock exchange, by means of a public offer to purchase addressed to
all shareholders, a public invitation to submit offers for sale, or via a bank or other
entity that meets the requirements of section 186, paragraph 5, sentence 1 AktG.
The authorization includes differentiating requirements – in particular with regard to
the permissible purchase price – for each method of acquisition.
84
Infineon | Annual Report 2023
Further information
Consolidated Financial Statements
Management Board and Supervisory Board Combined Management Report
Corporate Governance
Information pursuant to the German Commercial Code (HGB)
86.
Infineon shares acquiredor being acquired on the basis of this or an earlier authoriza-
tion may – if not sold either via the stock exchange or by means of a public offer to
purchase addressed to all shareholders – be used for all legally permissible purposes.
The shares may also be canceled or offered to third parties in conjunction with busi-
ness combinations or the acquisition of companies, parts of companies or participa-
tions in companies, as well as being offered and transferred to other depositable
assets related to such an acquisition project. Under specified circumstances, subject
to the approval of the Supervisory Board, the shares may also be sold to third parties
in return for cash payment (including by means other than through the stock
exchange or through an offer to all shareholders); used to meet the Company’s obli-
gations under convertible bonds and bonds with warrants; offered for sale or granted
as a remuneration component to members of the Company’s Management Board,
members of the management boards and other boards of affiliated companies, and
employees of the Company or of its affiliated companies; and, finally, used to repay
securities-backed loans. The subscription right of shareholders is excluded in the
cases mentioned above. In addition, the subscription rights of shareholders are
excluded in respect of fractional amounts in instances in which the shares are sold
through a public offer addressed to all shareholders.
According to a resolution passed by the Annual General Meeting on 16 February 2023,
shares in Infineon Technologies AG may also be acquired using equity derivatives.
The total number of shares that can be acquired using derivatives may not exceed
5 percent of the Company’s share capital, either at the time of this authorization
becoming effective or at the time of its exercise through the use of the derivatives.
The shares acquired through the exercise of this authorization are to be counted
toward the acquisition threshold for the shares acquired in accordance with the
authorization to acquire own shares as described above. The authorization stipulates
other restrictions when derivatives are deployed, including with regard to their
execution, term, servicing and price.
If own shares are acquired using derivatives in accordance with the requirements
stipulated in the authorization, any right of the shareholders to conclude such deriva-
tive transactions with the Company will be excluded in the analogous application
of section 186, paragraph 3, sentence 4 AktG. Shareholders have no right to conclude
derivative transactions with the Company.
Shareholders have a right to sell their Infineon shares in this connection only insofar
as the Company is required to accept the shares under the derivative transactions.
No other right to sell shares shall apply in this connection.
The use of own shares acquired through derivatives is governed by the same rules
as those applicable for the direct acquisition of own shares.
Significant agreements of the Company that are subject to the
condition of a change of control as a result of a takeover bid and
remuneration agreements with Management Board members
or employees in the event of a takeover bid
Various financing agreements with lending banks and capital market creditors
contain defined change-of-control clauses that give creditors the right to demand
early repayment; these clauses reflect standard market practice.
Furthermore, certain patent cross-licensing agreements, development agreements,
subsidy agreements and approvals, supply contracts, joint venture agreements and
license agreements contain customary change-of-control clauses, which, in the event
of a change of control at Infineon Technologies AG, make the continuation of the
agreement dependent on the consent of the contracting party, grant special rights
to the contracting party that may be unfavorable for Infineon, or even entitle the
contracting party to terminate the agreement.
85
Infineon | Annual Report 2023
Further information
Consolidated Financial Statements
Management Board and Supervisory Board Combined Management Report
Corporate Governance
Information pursuant to the German Commercial Code (HGB)
87.
If a ManagementBoard member leaves their position in connection with a defined
change of control, that member is entitled to continued payment of the relevant
annual remuneration for the remaining contract term up to a maximum period of
24 months. Further details are contained in the Remuneration Report (see the chapter
“Remuneration Report”).
The change-of-control clauses agreed to by Management Board members are
intended to provide financial security to those members in the event of a change of
control, with a view to preserving their independence in this situation.
The conditions of both the Performance Share Plan and the Restricted Stock Unit Plan,
in which Infineon managers and other selected employees worldwide participate,
contain rules that are triggered in the event of a defined change of control. For the
most part, these rules specify that the vesting periods that are envisaged by the
relevant plans are aborted in the event of a change of control. Although Management
Board members also participate in the Performance Share Plan, the rules therein
relating to a change of control do not apply to Management Board members, given
that their service contracts take precedence.
Statement on Corporate Governance
pursuant to sections 289f and 315d
of the German Commercial Code (HGB)
The Statement on Corporate Governance pursuant to sections 289f and 315d of the
German Commercial Code (HGB) is publicly available.
www.infineon.com/declaration-on-corporate-governance
Remuneration Report
The Remuneration Report is publicly available.
www.infineon.com/remuneration-report
The references to the Remuneration Report are not audited as part of the audit of
the financial statements. The Remuneration Report was subjected to a separate
substantive audit by the auditor in accordance with IDW PS 490. This audit also
includes the formal audit required by section 162, paragraph 3 of the German Stock
Corporation Act (AktG).
86
Infineon | Annual Report 2023
Further information
Consolidated Financial Statements
Management Board and Supervisory Board Combined Management Report
Corporate Governance
Information pursuant to the German Commercial Code (HGB) |
Statement on Corporate Governance of the German Commercial Code (HGB) | Remuneration Report
88.
R01 International Monetary Fund(IMF):
World Economic Outlook. October 2023.
R02 World Semiconductor Trade Statistics (WSTS):
Semiconductor Industry Blue Book History. October 2023.
R03 Based on or includes research from Omdia:
Application Market Forecast Tool – 3Q23. September 2023.
R04 Based on or includes research from Omdia:
Competitive Landscaping Tool CLT Quarterly – 2Q23. August 2023.
Neubiberg, 21 November 2023
Management Board
Jochen Hanebeck Elke Reichart Dr. Sven Schneider
Andreas Urschitz Dr. Rutger Wijburg
87
Infineon | Annual Report 2023
Further information
Consolidated Financial Statements
Management Board and Supervisory Board Combined Management Report
List of references
List of references
89.
89 Consolidated Statementof Profit or Loss
90 Consolidated Statement of Comprehensive Income
91 Consolidated Statement of Financial Position
92 Consolidated Statement of Cash Flows
93 Consolidated Statement of Changes in Equity
95 Notes to the Consolidated Financial Statements
Consolidated Financial Statements
88
Infineon | Annual Report 2023
90.
€ in millionsNotes 2023 2022
Change
absolute in %
Revenue 4, 29 16,309 14,218 2,091 15
Cost of goods sold 4 (8,896) (8,087) (809) (10)
Gross profit 7,413 6,131 1,282 21
Research and development expenses 4 (1,985) (1,798) (187) (10)
Selling, general and administrative expenses 4 (1,599) (1,565) (34) (2)
Other operating income 192 129 63 49
Other operating expenses (73) (52) (21) (40)
Operating profit 3,948 2,845 1,103 39
Financial income 4 105 7 98 +++
Financial expenses 4 (159) (168) 9 5
Share of profit (loss) of associates and joint ventures accounted for using the equity method 5 27 39 (12) (31)
Profit (loss) from continuing operations before income taxes 3,921 2,723 1,198 44
Income taxes 6 (782) (537) (245) (46)
Profit (loss) from continuing operations 3,139 2,186 953 44
Profit (loss) from discontinued operations, net of income taxes 7 (2) (7) 5 71
Profit (loss) for the period 3,137 2,179 958 44
Attributable to:
Shareholders and hybrid capital investors of Infineon Technologies AG 3,137 2,179 958 44
Basic earnings per share (in euro) attributable to shareholders of Infineon Technologies AG:1
Basic earnings per share (in euro) from continuing operations 8 2.39 1.66 0.73 44
Basic earnings (loss) per share (in euro) from discontinued operations 8 (0.01) (0.01) – –
Basic earnings per share (in euro) 8 2.38 1.65 0.73 44
Diluted earnings per share (in euro) attributable to shareholders of Infineon Technologies AG:1
Diluted earnings per share (in euro) from continuing operations 8 2.38 1.65 0.73 44
Diluted earnings (loss) per share (in euro) from discontinued operations 8 – – – –
Diluted earnings per share (in euro) 8 2.38 1.65 0.73 44
1 The calculation of earnings per share is based on unrounded figures.
Consolidated Statement of Profit or Loss
89
Infineon | Annual Report 2023
Further information
Combined Management Report
Management Board and Supervisory Board Consolidated Financial Statements
91.
€ in millionsNotes 2023 2022
Change
absolute in %
20
Profit (loss) for the period 3,137 2,179 958 44
Actuarial gains (losses) on pensions and similar commitments 17 310 (293) (95)
Total items that will not be reclassified subsequently to profit or loss 17 310 (293) (95)
Currency effects (718) 1,369 (2,087) –––
Gains (losses) resulting from hedge accounting 9 4 5 +++
Cost of hedging (4) – (4) –––
Total items that may be reclassified subsequently to profit or loss (713) 1,373 (2,086) –––
Other comprehensive income (loss), net of tax (696) 1,683 (2,379) –––
Total comprehensive income (loss), net of tax 2,441 3,862 (1,421) (37)
Attributable to:
Shareholders and hybrid capital investors of Infineon Technologies AG 2,441 3,862 (1,421) (37)
Consolidated Statement of Comprehensive Income
90
Infineon | Annual Report 2023
Further information
Combined Management Report
Management Board and Supervisory Board Consolidated Financial Statements
92.
Notes
30 Sep-
tember
2023
30 Sep-
tember
2022
Change
€in millions absolute in %
ASSETS
Cash and cash equivalents 1,820 1,438 382 27
Financial investments 9 1,770 2,279 (509) (22)
Trade receivables 10 1,991 1,887 104 6
Inventories 11 3,974 3,081 893 29
Current income tax receivables 63 58 5 9
Contract assets 115 85 30 35
Other current assets 12, 27 959 625 334 53
Total current assets 10,692 9,453 1,239 13
Property, plant and equipment 13 7,045 5,545 1,500 27
Goodwill 14 6,547 7,083 (536) (8)
Other intangible assets 13 2,977 3,483 (506) (15)
Right-of-use assets 15 405 405 – –
Investments accounted for
using the equity method 5 114 100 14 14
Non-current income tax receivables 2 2 – –
Deferred tax assets 6 268 527 (259) (49)
Other non-current assets 27 389 314 75 24
Total non-current assets 17,747 17,459 288 2
Total assets 28,439 26,912 1,527 6
Notes
30 Sep-
tember
2023
30 Sep-
tember
2022
Change
€ in millions absolute in %
LIABILITIES AND EQUITY
Short-term financial debt and current portion
of long-term financial debt 16 330 752 (422) (56)
Trade payables 2,765 2,260 505 22
Current provisions 17 799 983 (184) (19)
Current income tax payables 418 356 62 17
Current lease liabilities 15 72 76 (4) (5)
Other current liabilities 18, 27 1,285 1,161 124 11
Total current liabilities 5,669 5,588 81 1
Long-term financial debt 16 4,403 4,910 (507) (10)
Pensions and similar commitments 19 268 297 (29) (10)
Deferred tax liabilities 6 254 371 (117) (32)
Other non-current provisions 17 300 289 11 4
Non-current lease liabilities 15 309 310 (1) –
Other non-current liabilities 27 192 203 (11) (5)
Total non-current liabilities 5,726 6,380 (654) (10)
Total liabilities 11,395 11,968 (573) (5)
Equity: 20
Ordinary share capital 2,612 2,612 – –
Additional paid-in capital 6,684 6,579 105 2
Retained earnings 6,204 3,506 2,698 77
Other reserves 354 1,067 (713) (67)
Own shares (13) (23) 10 43
Hybrid capital 1,203 1,203 – –
Total equity 17,044 14,944 2,100 14
Total liabilities and equity 28,439 26,912 1,527 6
Consolidated Statement of Financial Position
91
Infineon | Annual Report 2023
Further information
Combined Management Report
Management Board and Supervisory Board Consolidated Financial Statements
93.
€ in millionsNotes 2023 2022
Change
absolute in %
26
Profit (loss) for the period 3,137 2,179 958 44
Plus: profit (loss) from discontinued operations,
net of income taxes 2 7 (5) (71)
Adjustments to reconcile profit (loss) for the
period to cash flows from operating activities:
Depreciation and amortization 13, 15 1,754 1,664 90 5
Income tax 6 782 537 245 46
Interest result 4 98 131 (33) (25)
Gains on disposals of
property, plant and equipment (99) (12) (87) –––
Dividends received 5 7 6 1 17
Impairments (reversals of impairments) 13, 14, 29 18 24 (6) (25)
Losses (gains) from sales of businesses,
interests in subsidiaries and investments (30) – (30) –––
Share-based payment 22 92 62 30 48
Other non-cash result (46) (45) (1) (2)
Change in trade receivables 10 (185) (307) 122 40
Change in inventories 11 (1,014) (766) (248) (32)
Change in trade payables 547 640 (93) (15)
Change in provisions 17 (138) 89 (227) –––
Change in other assets and other liabilities (359) 266 (625) –––
Interests received 4 57 10 47 +++
Interests paid 4 (128) (149) 21 14
Income taxes paid 6 (533) (350) (183) (52)
Cash flows from operating activities
from continuing operations 3,962 3,986 (24) (1)
Cash flows from operating activities
from discontinued operations (2) (6) 4 67
Cash flows from operating activities 3,960 3,980 (20) (1)
€ in millions Notes 2023 2022
Change
absolute in %
Purchases of financial investments 9 (5,198) (5,605) 407 7
Proceeds from sales of financial investments 9 5,738 5,502 236 4
Acquisitions of businesses, net of cash acquired 3 (22) (36) 14 39
Proceeds from sales of businesses and
interests in subsidiaries, net of cash disbursed 91 – 91 +++
Investments in related companies (2) (8) 6 75
Purchases of other intangible assets and
other assets 13 (255) (257) 2 1
Purchases of property, plant and equipment 13 (2,739) (2,053) (686) (33)
Proceeds from sales of property, plant and
equipment and other assets 123 16 107 +++
Cash flows from investing activities (2,264) (2,441) 177 7
Net change in related party financial
receivables and payables 25 19 – 19 +++
Proceeds from issuance of
long-term financial debt 16 – 500 (500) –––
Repayments of long-term financial debt 16 (753) (1,893) 1,140 60
Payments for lease liabilities 15 (86) (84) (2) (2)
Change in cash deposited as collateral – (2) 2 +++
Payments for other financial liabilities (25) – (25) –––
Dividend payments 20 (417) (351) (66) (19)
Cash outflow to hybrid capital investors 20 (39) (39) – –
Cash flows from financing activities (1,301) (1,869) 568 30
Net change in cash and cash equivalents 395 (330) 725 +++
Currency effects on cash and cash equivalents (13) 19 (32) –––
Cash and cash equivalents at beginning of period 1,438 1,749 (311) (18)
Cash and cash equivalents at end of period 1,820 1,438 382 27
Consolidated Statement of Cash Flows
92
Infineon | Annual Report 2023
Further information
Combined Management Report
Management Board and Supervisory Board Consolidated Financial Statements
94.
€ in millions
NotesShare capital Capital
reserves
Retained
earnings
Other reserves Own shares Equity
attributable to
shareholders
of Infineon
Technologies
AG
Equity
attributable to
hybrid capital
investors
Total equity
Currency
effects
Hedges Cost of
hedging
Balance as of 1 October 2022 2,612 6,579 3,506 1,060 7 – (23) 13,741 1,203 14,944
Total comprehensive income (loss), net of tax
Profit (loss) for the period – – 3,098 – – – – 3,098 39 3,137
Other comprehensive income (loss), net of tax – – 17 (718) 9 (4) – (696) – (696)
Total comprehensive income (loss), net of tax – – 3,115 (718) 9 (4) – 2,402 39 2,441
Transactions with owners
Contributions by and distributions to owners
Dividends 20 – – (417) – – – – (417) – (417)
Share-based payment 20, 22 – 82 – – – – – 82 – 82
Disposal (purchase) of own shares 20 – – – – – – 10 10 – 10
Other contributions and distributions 20 – 23 – – – – – 23 – 23
Total contributions by and distributions to owners – 105 (417) – – – 10 (302) – (302)
Total transactions with owners – 105 (417) – – – 10 (302) – (302)
Transactions with hybrid capital investors
Compensations to hybrid capital investors 20 – – – – – – – – (39) (39)
Total transactions with hybrid capital investors – – – – – – – – (39) (39)
Balance as of 30 September 2023 2,612 6,684 6,204 342 16 (4) (13) 15,841 1,203 17,044
Consolidated Statement of Changes in Equity
for the fiscal year ended 30 September 2023
93
Infineon | Annual Report 2023
Further information
Combined Management Report
Management Board and Supervisory Board Consolidated Financial Statements
95.
Consolidated Statement ofChanges in Equity
for the fiscal year ended 30 September 2022
€ in millions
Notes Share capital Capital
reserves
Retained
earnings
Other reserves Own shares Equity
attributable to
shareholders
of Infineon
Technologies
AG
Equity
attributable to
hybrid capital
investors
Total equity
Currency
effects
Hedges Cost of
hedging
Balance as of 1 October 2021 2,612 6,513 1,407 (309) 3 – (28) 10,198 1,203 11,401
Total comprehensive income (loss), net of tax
Profit (loss) for the period – – 2,140 – – – – 2,140 39 2,179
Other comprehensive income (loss), net of tax – – 310 1,369 4 – – 1,683 – 1,683
Total comprehensive income (loss), net of tax – – 2,450 1,369 4 – – 3,823 39 3,862
Transactions with owners
Contributions by and distributions to owners
Dividends 20 – – (351) – – – – (351) – (351)
Share-based payment 20, 22 – 57 – – – – – 57 – 57
Disposal (purchase) of own shares 20 – – – – – – 5 5 – 5
Other contributions and distributions 20 – 9 – – – – – 9 – 9
Total contributions by and distributions to owners – 66 (351) – – – 5 (280) – (280)
Total transactions with owners – 66 (351) – – – 5 (280) – (280)
Transactions with hybrid capital investors
Compensations to hybrid capital investors 20 – – – – – – – – (39) (39)
Total transactions with hybrid capital investors – – – – – – – – (39) (39)
Balance as of 30 September 2022 2,612 6,579 3,506 1,060 7 – (23) 13,741 1,203 14,944
94
Infineon | Annual Report 2023
Further information
Combined Management Report
Management Board and Supervisory Board Consolidated Financial Statements
96.
The Infineon Group(“Infineon”), comprising Infineon Technologies AG (hereafter
also referred to as “the Company”) and its direct and indirect subsidiaries, develops,
manufactures and markets a wide variety of semiconductors and semiconductor-
based solutions. The focus is on the key markets: automotive as well as industrial and
consumer-related segments. The product portfolio ranges from standard components,
to special components for digital, analog and mixed-signal applications, as well as
customer-specific solutions, together with the appropriate software. Research and
development sites, manufacturing facilities, investments and customers are located
mainly in Europe, Asia and North America.
Infineon Technologies AG is a listed company under German law and the ultimate
parent company of Infineon. The principal office of the Company is Am Campeon 1–15,
85579 Neubiberg (Germany). The Company is registered in the Commercial Register
of the local court of Munich (Germany) under the number HRB 126492.
1 Basis of the Consolidated Financial Statements
The Consolidated Financial Statements for the year ended 30 September 2023,
prepared by Infineon Technologies AG as the ultimate parent company, have been
prepared in accordance with International Financial Reporting Standards (“IFRS”)
and related interpretations effective as of 30 September 2023 as issued by the Inter-
national Accounting Standards Board (“IASB”) to the extent to which the IFRS and
interpretations have been endorsed by the European Union (“EU”). The Consolidated
Financial Statements also comply with the supplementary requirements set out in
section 315e, paragraph 1 of the German Commercial Code (“Handelsgesetzbuch”
or “HGB”). The aforementioned standards were complied with in full.
The Consolidated Statement of Profit or Loss is presented using the cost of sales
method.
The fiscal year-end for both Infineon and the Company is 30 September of each year.
The Group’s reporting currency is the euro (“€”).
Deviations between amounts presented are possible due to rounding. Negative
amounts are presented in parentheses.
The Company’s Management Board presented the Consolidated Financial Statements
on 21 November 2023.
Financial reporting rules applied for the first time
The IASB has issued the following Standards or amendments to Standards, which are
required to be applied in the Consolidated Financial Statements for the year ended
30 September 2023:
Standard/amendment/interpretation Effective date Impact on
Infineon
IAS 16 Property, plant and equipment – income before intended use
(amendments to IAS 16)
1 January 2022 none
IAS 37 Onerous contracts – costs of fulfilling a contract
(amendments to IAS 37)
1 January 2022 immaterial
IFRS 3 References to the conceptual framework
(amendments to IFRS 3)
1 January 2022 none
Annual IFRS improvement cycle 2018–2020 1 January 2022 none
Notes to the Consolidated Financial Statements
95
Infineon | Annual Report 2023
Further information
Combined Management Report
Management Board and Supervisory Board
Notes to the Consolidated Financial Statements
Consolidated Financial Statements
97.
Financial reporting rulesissued not yet applied
The following new or amended Standards have been issued by the IASB and will
be relevant to Infineon from today’s perspective. They have not been applied in the
Consolidated Financial Statements as of 30 September 2023 since they are not yet
mandatory or, alternatively, have not yet been endorsed by the EU. The new or
amended Standards are applicable for fiscal years beginning on or after their respec-
tive effective date. As a general rule, they are not applied before their effective date,
even if this is permitted for certain Standards.
Standard/amendment/interpretation Effective date Impact on
Infineon
IAS 1 Classification of liabilities as current or non-current
(amendments to IAS 1)
1 January 2024 none
IAS 1 Disclosure of accounting policies
(amendments to IAS 1 and IFRS Practice Statement 2)
1 January 2023 immaterial
IAS 7 and
IFRS 7
Supplier finance arrangements
(amendments to IAS 7 and IFRS 7)
1 January 2024 none
IAS 8 Definition of accounting estimates (amendments to IAS 8) 1 January 2023 none
IAS 12 Deferred tax relating to assets and liabilities arising from
a single transaction (amendments to IAS 12)
1 January 2023 none
IAS 12 International tax reform – pillar two model rules
(amendments to IAS 12)
1 January 2023 immaterial
IFRS 16 Lease liability in a sale and leaseback (amendments to IFRS 16) 1 January 2024 none
IFRS 17 Insurance contracts including amendments to IFRS 17 1 January 2023 none
IAS 21 Lack of exchangeability (amendments to IAS 21) 1 January 2025 none
Individual provisions of the amendments to IAS 12 (International tax reform – pillar
two model rules) published on 23 May 2023 are in principle applicable retrospectively
for the prior fiscal year as a result of the adoption by the EU on 8 November 2023.
No deferred taxes in connection with pillar two income taxes were recorded.
2 Summary of significant accounting policies
Basis of consolidation
The Consolidated Financial Statements presented here include the individual financial
statements of Infineon Technologies AG and its direct and indirect subsidiaries on
a consolidated basis. A subsidiary is defined as an entity, that is directly or indirectly,
controlled by Infineon Technologies AG.
Control exists when Infineon is subjected to variable returns arising from its engage-
ment with the subsidiary or has a right to such and has the ability to influence these
returns as a result of its power over the subsidiary. Power means that Infineon has
existing rights that give Infineon the ability to direct the relevant activities of the
subsidiary, that is the activities that significantly affect the aforementioned returns.
An entity is included in the Consolidated Financial Statements from the date on
which Infineon acquires control. Upon first-time consolidation of an entity, the
acquired assets and assumed liabilities are basically measured on the basis of their
fair value at the acquisition date. Any excess of consideration paid (purchase price)
over the share of the fair value of acquired assets, liabilities and contingent liabilities
is recognized as goodwill. Any excess of Infineon’s share of the fair value of items
acquired over consideration paid is, after re-examination, recognized as a gain.
The financial statements of entities included in the Consolidated Financial Statements
are prepared using uniform valuation and accounting policies.
The balance sheet effects of intragroup transactions as well as gains and losses
arising from intragroup business relationships are eliminated on consolidation.
96
Infineon | Annual Report 2023
Further information
Combined Management Report
Management Board and Supervisory Board
Notes to the Consolidated Financial Statements
Consolidated Financial Statements
98.
A list ofsubsidiaries of Infineon Technologies AG is provided in note 30. p. 165 ff.
In the absence of control over an entity, but where the entity is a joint venture or an
associated company, this is included in the Consolidated Financial Statements using
the equity method (see note 5, p. 110 f.). Where objective indications of impairment
in the carrying amount of an equity-based investment are present, an impairment test
is carried out. If the carrying amount exceeds the recoverable amount, an impairment
loss is recognized in financial expenses.
Functional currency and foreign currency translation
The functional and reporting currency of Infineon Technologies AG is the euro.
Foreign currency transactions of subsidiaries are translated into the functional
currency of the relevant entity using the spot rate prevailing at the transaction date.
Monetary foreign currency assets and liabilities are translated at the spot rate
prevailing at the reporting date. Exchange rate gains and losses from the translation
of foreign currency transactions are recognized in the Consolidated Statement of
Profit or Loss.
The assets and liabilities of subsidiaries with functional currencies other than the
euro are translated into euros for consolidation purposes using the spot rate at the
end of the reporting period. Income and expenses of these entities are translated
using the average spot rate of the reporting period. All currency translation differences
are recognized directly in equity and presented as “Other reserves”.
Recognition and measurement principles
Cash and cash equivalents
Cash and cash equivalents represent cash and all financial resources with a maturity
at acquisition date of three months or less. Cash equivalents partly include invest-
ments in money market funds. The valuation is recorded at amortized acquisition cost
or at fair value through profit or loss.
Financial instruments
Financial instruments are initially recognized at their fair value. Transaction costs
directly attributable to the acquisition or issuance of financial instruments are only
included in the carrying amount if the financial instruments are not measured at fair
value through profit or loss.
Trade receivables are recognized based on the amount to which Infineon has an
unconditional right to receive. With the exception of matters that result in a partial
refund of the purchase price to the customer, this corresponds to the transaction
price determined in accordance with IFRS 15. The subsequent measurement of trade
receivables is carried out at amortized cost.
Purchases and sales of financial assets are recognized on the settlement date.
Financial assets are derecognized when the rights to receive payments from the
investments have expired or have been transferred and Infineon has transferred all
risks and rewards associated with ownership. Financial liabilities are derecognized
when they are extinguished, that is, when the contractual obligation is discharged,
canceled, or expired.
97
Infineon | Annual Report 2023
Further information
Combined Management Report
Management Board and Supervisory Board
Notes to the Consolidated Financial Statements
Consolidated Financial Statements
99.
Financial assets
› Classificationand measurement of financial assets
Upon initial recognition, financial assets are classified for subsequent measurement
either as at amortized cost, fair value through other comprehensive income or fair
value through profit or loss. This classification depends on the characteristics of
the contractual cash flows of the financial assets and Infineon’s business model for
managing its financial assets.
Infineon’s business model for managing financial asset portfolios reflects how the
company controls its financial assets in order to generate cash flows. Depending
on the business model, cash flows arise from the receipt of contractual cash flows,
the sale of financial assets or both.
In order for a financial asset in the form of a debt instrument to be classified and
measured at amortized cost or at fair value through other comprehensive income,
cash flows may only arise from the repayment of principal and interest payments on
the outstanding principal amount. This assessment is referred to as a cash flow or
SPPI test (“solely payments of principal and interest”) and is carried out at the level
of the individual financial instrument.
On this basis, Infineon’s financial asset measurement categories are as follows:
Financial assets measured at amortized cost include all assets whose contractual
provisions result in cash flows at fixed times that represent only interest and repay-
ments of the outstanding principal amount, provided that those assets are held with
the intention of collecting the contractual cash flows expected over their respective
duration. In subsequent periods, financial assets measured at amortized cost are
measured using the effective interest method. Interest income, currency gains and
losses, impairments, and gains or losses from the derecognition of such financial
assets are recognized through profit or loss.
As of the reporting date, Infineon did not hold any financial assets with the intention
to collect contractual cash flows and sell them. Therefore, there was no allocation
of financial assets in the form of debt instruments to the category “fair value through
other comprehensive income”.
Financial assets in the form of debt instruments that are measured at fair value
through profit or loss include all financial assets of Infineon whose cash flows are not
solely payments of principal and interest.
At Infineon, financial assets in the form of equity instruments are consistently
measured at fair value through profit or loss.
Net gains and losses, including interest and dividend income, from financial assets
that are measured at fair value through profit or loss (debt and equity instruments)
are recognized in the Consolidated Statement of Profit or Loss.
“Designated hedging instruments (cash flow hedges)” also belong to financial assets.
› Impairment of financial assets
Infineon determines an allowance for expected credit losses for financial assets in
the form of debt instruments that are measured at amortized cost or at fair value
through other comprehensive income. The calculation of the expected future credit
losses is generally determined by multiplying the probability of default by the carry-
ing amount of the financial asset (exposure at default) and the expected loss ratio
(loss given default).
98
Infineon | Annual Report 2023
Further information
Combined Management Report
Management Board and Supervisory Board
Notes to the Consolidated Financial Statements
Consolidated Financial Statements
100.
Infineon determines allowancesfor expected credit losses primarily for cash and
cash equivalents, financial investments, trade receivables, and contract assets. The
expected credit losses are adjusted at each reporting date to reflect changes in credit
risk since the instrument was first recognized.
For cash and cash equivalents and financial investments measured at amortized cost,
Infineon determines credit losses expected in the next twelve months (twelve-month
expected credit loss) in accordance with the general approach. Due to their short-term
maturity, this corresponds to the lifetime expected credit losses. Infineon rates the
credit risk for cash and cash equivalents and financial investments as low. Infineon
assumes that a financial asset has a low credit risk if it has an investment grade rating
or a corresponding internal investment grade rating. In order to assess whether
there has been a significant increase in credit risk since initial recognition, Infineon
considers appropriate and robust information that is relevant and available without
disproportionately high levels of effort. This includes both quantitative and qualitative
information and analyses, which are based on the company’s historical experience
and a sound credit assessment as well as forward-looking information. Macroeconomic
information is taken into account in the internal rating model (information on Infineon’s
financial risk management is included in note 28, p. 150 ff.). Irrespective of the
above analysis, a significant increase in credit risk is assumed if a debtor is more
than 30 days overdue with the settlement of a contractual payment.
For trade receivables and contract assets, Infineon recognizes lifetime expected
credit losses using a simplified approach. The estimate of expected credit losses on
trade receivables and contract assets is based primarily on the analysis of customer
financial data, ratings, credit default spreads, past payment behavior of customers
and forward-looking information.
In the case of objective indications that expected future cash flows are affected, a
financial asset is classified as credit-impaired and adjusted to its individual value. As
a rule, this is the case for financial assets (unless it is a trade receivable) no later than
90 days after the due date. Trade receivables are not automatically determined as
credit-impaired in the event of a payment overdue by more than 90 days but always
on the basis of the individual assessment of credit management.
A default event occurs when Infineon concludes that the other party would most
likely not be able to meet the payment obligations, or not in full.
Financial assets are partly or completely written off, together with previously
recognized impairments, if there is no reasonable expectation of repayment. This is
generally the case when Infineon finds that the debtor does not have assets or revenue
sources that could generate sufficient cash flows to repay the amounts subject to
derecognition. Even when financial assets are written off, Infineon continues to con-
duct enforcement measures to recover them. Amounts recovered are recognized in
profit or loss.
Financial liabilities
Infineon classifies financial liabilities into the following categories: “Financial liabili-
ties measured at fair value through profit and loss” and “Other financial liabilities”.
Furthermore, “Designated hedging instruments (cash flow hedges)” belong to financial
liabilities.
Liabilities measured at fair value through profit or loss by Infineon include derivatives
to hedge currency risks for which hedge accounting is not applied.
99
Infineon | Annual Report 2023
Further information
Combined Management Report
Management Board and Supervisory Board
Notes to the Consolidated Financial Statements
Consolidated Financial Statements
101.
Upon initial recognition,other financial liabilities are measured at fair value after the
deduction of transaction costs. In subsequent periods, they are measured at amor-
tized cost using the effective interest method. The liabilities are derecognized when
the contractual obligations are discharged, canceled or expired.
Designated hedging instruments (cash flow hedges)
Certain derivative financial instruments are used to hedge foreign currency and
interest risks or risks of commodity price changes (such as gold prices) for firm
commitments as well as expected and highly probable future transactions in order to
minimize the associated risk (cash flow hedges).
Derivative financial instruments are measured at their fair value and included in
“other current assets” or “other current liabilities”.
The effective portion of changes in the fair value of derivative financial instruments,
determined in accordance with IFRS 9, that are designated as cash flow hedges
and are part of hedging relationships that meet the criteria for hedge accounting is
recognized directly in equity. The gain or loss relating to the ineffective portion is
recognized in profit or loss. Amounts accumulated in equity are recycled in profit or
loss in the periods in which the underlying hedged item affects profit or loss, or, if the
expected transaction subsequently results in the recognition of a non-financial asset,
included in the acquisition cost upon initial recognition.
When a hedging instrument expires or is sold, or when a hedging relationship no
longer meets the criteria for hedge accounting, any cumulative gain or loss existing at
that time remains in equity until the underlying transaction actually occurs. When a
forecasted transaction is no longer expected to occur, the cumulative gain or loss that
was reported in equity is immediately transferred to profit or loss.
Hybrid bonds
The recognition of a hybrid bond depends on the specific form of the instrument.
A hybrid bond is measured and recognized in equity when certain conditions are
jointly met. These include, but are not limited to, the fact that the hybrid bond has no
final maturity date, the investors have no rights of termination, and the distributions
are made at Infineon’s discretion. In this case, discounts, transaction costs, tax effects
and the remuneration of hybrid investors are deducted directly from equity.
Inventories
Inventories are measured at the lower of historical acquisition or fully absorbed
production cost – calculated using the weighted-average method – and net realizable
value. Net realizable value corresponds to realizable sale proceeds under normal
business conditions less estimated expected costs to complete and sell. Production
cost comprises costs of material, production wages and an appropriate portion of
attributable overheads, along with attributable depreciation and amortization on
property, plant and equipment and other intangible assets. Overhead mark-ups are
determined on the basis of normal capacity utilization levels.
Write-downs to net realizable value are recorded on inventories using a consistent
approach throughout Infineon and are determined at product level for technically
obsolete and slow-moving inventories on the basis of the amount of revenues
expected to be generated by the relevant product.
Inventories include an asset resulting from sales with a right of return, representing
Infineon’s right to recover products from customers upon payment of the reimburse-
ment obligation (see “Revenue recognition”, p. 104 f.). The valuation is made by
reference to the previous book value of the products.
100
Infineon | Annual Report 2023
Further information
Combined Management Report
Management Board and Supervisory Board
Notes to the Consolidated Financial Statements
Consolidated Financial Statements
102.
Contract assets
Contract assetsare recognized if Infineon has fulfilled its performance obligations
arising from contracts with customers and an unconditional entitlement to customer
consideration does not yet exist.
At Infineon, contract assets result from revenue arising from over time revenue recog-
nition for certain types of contracts, as well as from sales to some customers for
whom Infineon maintains a consignment warehouse and where revenue is recorded
at the time of delivery to the consignment warehouse, whereas the invoice is only
issued at the time of withdrawal of the product by the customer.
Loss allowances for expected credit losses on contract assets are determined in
accordance with the measurement method for trade receivables (see “Financial
instruments”, p. 97).
Property, plant and equipment
Property, plant and equipment are measured at amortized acquisition or construction
cost, and their value is reduced by depreciation and considering any impairment.
Depreciation on property, plant and equipment is recorded using the straight-line
method. Land, property rights and construction in progress are not depreciated
on a scheduled basis. Depreciation on property, plant and equipment is based on
the following useful lives, as applied consistently throughout Infineon:
Years
Buildings 25
Technical equipment and machinery 3–10
Other plant and office equipment 1–10
Other intangible assets
Other intangible assets consist of capitalized development costs and purchased
intangible assets, for example licenses, technologies and customer relationships.
These assets have finite useful lives and are valued at their amortized acquisition
or production costs, with amortization recorded using the straight-line method over
their expected economic life.
Amortization of other intangible assets is based on the following useful lives:
Years
Capitalized development costs 3–10
Customer relationships 1–12
Technologies 1–12
Licenses and similar rights 3–5
Remaining other intangible assets 3–12
Infineon did not hold any intangible assets with indefinite useful lives in either the
2023 or the 2022 fiscal year.
Recoverability of property, plant and equipment and intangible assets
(including goodwill)
Infineon reviews non-current assets, including property, plant and equipment,
goodwill and other intangible assets for possible impairment whenever events or
changes in circumstances indicate that the carrying amount of an asset may not be
recoverable. Regardless of whether an indication of impairment exists, goodwill and
other intangible assets, including capitalized development costs not yet subject to
amortization, undergo an annual impairment test (see also “Research and develop-
ment expenses”, p. 105). The impairment test for goodwill is carried out annually
at the operating segment level.
101
Infineon | Annual Report 2023
Further information
Combined Management Report
Management Board and Supervisory Board
Notes to the Consolidated Financial Statements
Consolidated Financial Statements
103.
The recoverability ofan asset is measured by comparing its carrying amount with
its recoverable amount. To the extent it is not possible to determine the recoverable
amount of an individual asset, the book value of the cash generating unit to which
the asset is allocated is compared to its recoverable amount.
A cash generating unit (“CGU”) represents the smallest identifiable group of assets
that generates cash inflows from continuing activities and that are largely independent
of the cash inflows from other assets or group of assets.
Goodwill arising in connection with a business combination is allocated to the CGUs
or groups of CGUs that will benefit from the synergies generated by the business
combination and the going concern element of the business operations acquired.
The recoverable amount of an asset is defined as the higher of its fair value less costs
to sell and its value in use. The value in use is calculated based on discounted future
cash flows. Considerable management judgment is necessary to estimate future
cash flows.
If an asset or CGU is considered to be impaired, the impairment recognized is measured
as the amount by which the carrying value exceeds the recoverable amount.
Goodwill is impaired when the carrying amount of the operating segment to which
goodwill is allocated exceeds the recoverable amount of that unit.
If the carrying amount of the respective operating segment to which goodwill
is allocated exceeds the recoverable amount of this CGU, the goodwill is impaired
accordingly.
In the case of property, plant and equipment or other intangible assets, if the recover-
able amount of a CGU is less than its carrying value, the impairment loss is allocated
pro rata to the assets within the scope of IAS 36. An impairment loss recognized in
prior periods for property, plant and equipment or other intangible assets is reversed
insofar as, since the last impairment, a change in the underlying assumptions has
occurred, which leads to a lower impairment requirement. The maximum possible
reversal of an impairment loss is that which would lead to the carrying amount that
would have been determined (net of scheduled depreciation and amortization) if
no impairment loss had been recognized for that asset in prior years. The reversal of
impairments recognized on goodwill in subsequent periods is not permitted.
Leased assets
IFRS 16 defines a lease as a contract that conveys the right to use an identifiable asset
over a specified period of time in exchange for consideration.
At the beginning of a lease, Infineon capitalizes a right-of-use asset at amortized
acquisition cost and recognizes as a liability a corresponding lease liability, using the
present value of the outstanding lease payments. Right-of-use assets are amortized
on a straight-line basis over the expected useful life (see “Property, plant and equip-
ment”, p. 101), or over the duration of the contract if shorter. In subsequent valua-
tions, lease liabilities are measured at the current value of the outstanding lease
payments using the effective interest method and are presented as lease liabilities
(current and non-current).
The costs associated with leasing agreements with a term of not more than twelve
months (provided they do not contain an option to purchase), as well as leasing
agreements in which the value of the underlying asset in the leasing contract is low,
are recorded in the profit or loss on a straight-line basis in the functional costs. As
a general rule, leased assets with an acquisition cost of up to €5,000 are defined as
low-value assets.
102
Infineon | Annual Report 2023
Further information
Combined Management Report
Management Board and Supervisory Board
Notes to the Consolidated Financial Statements
Consolidated Financial Statements
104.
Defined benefit pensionplans
The net pension obligation recognized with respect to defined benefit pension plans
comprises the present value of the defined benefit obligation (DBO) at the end of the
reporting period less the fair value of the plan assets. The present value of the DBO
and the resulting pension expense are determined annually in accordance with IAS 19
“Employee Benefits” for each separate plan by independent, qualified actuaries
using the projected unit credit method. The calculation is subject to, among other
things, assumptions on increases in salaries, future developments in pensions as well
as the life expectancy of the beneficiaries. As of the balance sheet date, the obligations
are discounted using discount rates determined primarily on the basis of market
yields of high-grade, fixed-interest corporate bonds from issuers carrying a very high
credit rating.
All items of income and expense relating to defined benefit plans, with the exception
of the net interest result, are recognized on a net basis in the functional costs within
the operating result. The net interest result arising from the multiplication of the
net pension obligation (pension obligation less plan assets) by the discount rate is
presented as a financial expense. Actuarial gains and losses arising from changes to
actuarial assumptions and estimates as well as the difference between the normal-
ized and actual return on plan assets are recognized directly in equity and recorded
in the Consolidated Statement of Comprehensive Income in the periods in which they
arise. Past service costs are recognized immediately in profit or loss.
Other provisions
Other provisions are recognized for present legal and/or constructive obligations
arising from past events that are likely to result in a future outflow of resources, the
amount of which can be reliably estimated.
With regard to legal proceedings and litigation, for example, those connected with the
Qimonda insolvency, Infineon regularly assesses the probability of an unfavorable
outcome. Infineon records provisions and liabilities, including provisions for signifi-
cant legal costs, for those obligations and risks relating to legal disputes which it
assesses at the relevant reporting date are likely to occur. That is where, from Infineon’s
perspective as of the date of assessment, there is compelling evidence that indicates
an obligation or risk, and the obligation or risk can be quantified with reasonable
accuracy at the time of assessment. As soon as additional information is available,
the affected estimates are reviewed and, where necessary, provisions for these pro-
ceedings are revised.
Other provisions are measured at their expected settlement amount. The amount
recognized for a provision is the best estimate of the expenditure required to settle
the present obligation. Estimates of outcomes and financial effects are dependent
upon the judgment of management, supplemented by experience gained from similar
transactions and, where appropriate, the assessment of independent experts. If the
circumstances to be assessed encompass a large number of possible outcomes,
the obligation is estimated by weighting all possible outcomes by their associated
probabilities (expected value method).
Where cash flows are expected to arise after the next twelve months, the expected
settlement amount corresponds to the present value of the expected cash outflows.
Discounting is only carried out if the interest effect is significant.
If the obligation decreases because of a change in the estimate, the provision is
adjusted accordingly and the resulting income recognized in the same functional
cost area of the Consolidated Statement of Profit or Loss in which the original charge
was recognized.
103
Infineon | Annual Report 2023
Further information
Combined Management Report
Management Board and Supervisory Board
Notes to the Consolidated Financial Statements
Consolidated Financial Statements
105.
Contingent liabilities
Contingent liabilitiesare either possible obligations whose actual existence is depen-
dent on the occurrence of one or more uncertain future events not wholly within
Infineon’s control, or they are present obligations that will probably not result in the
outflow of resources or whose outflow of resources cannot be quantified reliably.
Contingent liabilities are not recognized in the Statement of Financial Position, instead
they are disclosed in the Notes to the Consolidated Financial Statements (see note 23,
p. 135 f., and note 24, p. 136 ff.).
Revenue recognition
Infineon generates revenues mainly from the sale of semiconductor products, related
system solutions and relevant software. Revenue is recognized when control over the
products is transferred to the customers in accordance with IFRS 15 (power of disposal),
and where the receipt of consideration from the customer is probable. Typically,
Infineon’s customer contracts only contain one performance obligation which is ful-
filled either over a period of time or at a specific point in time, with fulfillment at a
specific point in time being the far more common case. For sales of customer-specific
products with no alternative use for Infineon, for which Infineon has a legal right to
payment for services rendered prior to delivery, revenue is recognized over time. Per-
formance progress is determined using an input-based method and is based on the
ratio of costs already incurred to the estimated total cost. If product revenue is not
recognized over time, then it is generally recognized upon delivery. The recognition
of revenue for deliveries into consignment warehouses depends on the individual
contractual arrangement. Revenue recognition at the point of delivery into the con-
signment warehouse takes place in cases where the customers gain contractual
power of control over the products at the point of delivery. Accordingly, in such cases,
a contract asset is recorded. Otherwise, revenue is recognized when the products are
withdrawn by the customer.
Invoices for sales of products are issued at the time of delivery or withdrawal by
the customer from the consignment warehouse and have a short payment term.
The amount of revenue corresponds to the expected transaction price to be settled
by the customer.
The transaction price can include variable components such as rebates or discounts.
Infineon can reliably estimate these in accordance with the contractual agreements
and historical experience. Variable consideration is only taken into account in so
far as it is highly probable that there will be no significant reversal of the revenue.
If Infineon expects that the consideration received from the customer is to be partially
reimbursed due to subsequent discounts, a reimbursement obligation is recognized
as a reduction to revenue, and is disclosed within other current liabilities.
Infineon recognizes revenue for deliveries to distributors by using the “sell in” method,
that is, when a product is delivered, to the extent that revenue has not already been
recognized over time. The transaction price for sales to distributors, in particular,
contains variable components. In accordance with established business practices in
the semiconductor industry, distributors can request price adjustments under certain
circumstances. This allows distributors to receive a credit (debit) note for unsold
products held in inventory, where Infineon has reduced (increased) the standard list
price of certain products. In addition, in certain cases and for certain products, dis-
tributors may request what is referred to as a ship and debit credit note. As with all
product sales, Infineon recognizes revenue based on the transaction price and records
an obligation for the estimated consideration to be reimbursed to the customer during
the period in which the relevant revenue is recognized. In the case of price adjustments
and ship and debit, the determination of the transaction price, and thus also the
refund obligation, is based on rolling historical price trends in the difference between
contract prices and standard list prices to the distributors. The refund liability is
disclosed as part of other current liabilities.
104
Infineon | Annual Report 2023
Further information
Combined Management Report
Management Board and Supervisory Board
Notes to the Consolidated Financial Statements
Consolidated Financial Statements
106.
Distributors can, subjectto certain conditions, return a limited amount of inventory
(stock return) or request scrap allowances. The estimation of the transaction price is
based on the expected stock returns in accordance with the contractual agreement,
combined with historical experience. Distributor scrap allowances are taken into
account based on the contractual agreement when determining the transaction price
and, upon submission of a valid claim, are granted up to a certain maximum based
on turnover in a given period. Infineon monitors such product returns on an ongoing
basis and adjusts estimate assumptions accordingly. In the case of stock returns and
scrap allowances, the consideration to be refunded to the customer is recognized as
a reimbursement obligation within other current liabilities. Other returns are only
permitted for quality defects within the ordinary warranty period. These obligations
are taken into consideration through corresponding warranty provisions.
The additional costs to obtain a contract are immediately recognized as an expense
as soon as they arise, providing the otherwise resulting depreciation period would
not exceed one year. Costs to fulfill a contract are capitalized at the earliest when an
expected, specifically identifiable contract exists.
Cost of goods sold
Cost of goods sold includes the manufacturing costs of products sold during the
reporting period. In addition, cost of goods sold contains idle costs, inventory risks,
the cost of warranty cases, as well as the amortization of capitalized development
costs. Recognized currency translation effects, as well as changes in the fair value of
undesignated derivative financial instruments that are connected to the operating
business, are recognized in cost of goods sold.
Research and development expenses
Costs of research activities are expensed as incurred. Costs for development activities
are capitalized if the results lead to a plan or design for the production of new or sub-
stantially improved products or for improved production processes. Capitalization
requires that the development costs can be measured reliably, the product or process
is technically and commercially feasible, and future economic benefits are probable.
In addition, Infineon must intend, and have the ability, to complete development and
use or sell the asset. The costs capitalized include the cost of materials, direct labor
and directly attributable general overhead expenses that serve to prepare the asset
for use. Such capitalized costs are presented as internally generated intangible assets
within “Other intangible assets” (see note 13, p. 118 f.). Development costs, that
do not fulfill the criteria for capitalization, are expensed as incurred. Capitalized
development costs are stated at cost less accumulated amortization and impairment
charges.
Grants
Grants are recognized when it is reasonably assured that Infineon will comply with
the conditions attached to the grant, and it is reasonably assured that the grant
will be received. Investment-related grants are deducted from the purchase and pro-
duction cost of the related asset and thereby reduce depreciation and amortization
expense in future periods.
Grants that are related to expenses are presented as a reduction of the related
expense in the Consolidated Statement of Profit or Loss (see note 4, p. 109 f.).
105
Infineon | Annual Report 2023
Further information
Combined Management Report
Management Board and Supervisory Board
Notes to the Consolidated Financial Statements
Consolidated Financial Statements
107.
Current and deferredtaxes
The current tax expense is calculated in accordance with taxation provisions in force
at the end of the reporting period.
Deferred taxes are calculated on temporary differences between the tax base and
the book value of assets and liabilities and on tax losses available for carry-forward
and tax allowances. By contrast, generally no deferred tax is recognized on initial
recognition of goodwill arising in connection with a business combination. Similarly,
deferred taxes are not recognized on the initial recognition of an asset or liability in
connection with a transaction that is not a business combination and which, at the
time of the transaction, affects neither the pre-tax income according to IFRS nor tax-
able profit. Deferred tax assets and liabilities are measured using applicable tax rates
and laws that have been enacted by the end of the reporting period or are about
to be enacted and are to be applied when the related deferred tax asset is realized,
or the deferred tax liability is settled.
Deferred tax assets with respect to deductible temporary differences, tax loss
carry-forwards and tax allowances that exceed deferred tax liabilities in respect of
taxable temporary differences, are only recognized to the extent that it is probable
that the relevant Group entity can generate sufficient taxable profit to realize the
corresponding benefit. Infineon reviews deferred tax assets for impairment at every
reporting date. The assessment requires management to make assumptions about
future taxable profits as well as other positive and negative influencing factors. This
assessment also takes into account insights from the company’s five-year plan as
approved in the fiscal year just ended.
Deferred tax assets and liabilities are netted to the extent they relate to the same tax
authority and to the same taxpayer or a group of different taxpayers who are jointly
assessed for income tax purposes.
Taxes are recognized in the Consolidated Statement of Profit or Loss, with the
exception of taxes relating to items recognized directly in equity or in other compre-
hensive income.
Tax liabilities are recognized as short-term as they are due immediately, and Infineon
generally has no option of deferring their due date.
For uncertain tax positions, a current tax liability is recorded; in the case of a tax
loss carried forward or a tax allowance, the respective deferred tax asset is reduced
accordingly. Estimates and assumptions must be made for the recognition and
valuation, for example, whether an assessment is made separately or together with
other uncertainties, whether a probable or expected value is used for the uncertainty,
and whether changes have occurred compared to the previous period. The detection
risk for the recognition of uncertain tax positions is not relevant. Recognition assumes
that the tax authorities investigate the matters in question and that they have all
relevant information.
Estimates and assumptions
The preparation of financial statements in accordance with IFRS requires management
to make estimates and assumptions that have an impact on the presented amounts
and the associated disclosures.
Estimates and assumptions are subject to regular review and must be adjusted where
appropriate. Climate risks and opportunities are also analyzed, reported, and evalu-
ated for their potential financial and accounting impact as part of the quarterly risk
management process. They are regularly included in the review of estimates and
assumptions for accounting purposes. Furthermore, in the case of valuations based
on longer-term planning assumptions for business development, sensitivity analyses
of the valuation results are carried out, which appropriately reflect the potential
106
Infineon | Annual Report 2023
Further information
Combined Management Report
Management Board and Supervisory Board
Notes to the Consolidated Financial Statements
Consolidated Financial Statements
108.
impact of climatechange on the valuation results. For a detailed explanation of
climate-related risks and opportunities, we refer you to the risk and opportunity
report in the Combined Management Report as well as to the report “Sustainability
at Infineon” which can be found under the following link: www.infineon.com/cms/en/
about-infineon/sustainability/csr-reporting. The reference to the report “Sustainability at
Infineon” is not audited as part of the audit of the Consolidated Financial Statements
but is subject to a separate audit to obtain limited assurance and for certain non-
financial information reasonable assurance.
Assumptions and estimates regarding cyclical market, industry, and geopolitical
risks are made to the best of management’s knowledge based on current events
and actions. Actual results may deviate from these estimates. This is especially true
against the backdrop of the geopolitical risks that continue to exist, particularly due
to the ongoing war in Ukraine, the conflict over Taiwan, and tensions in the Middle
East. The war in Ukraine can lead to further price increases and shortages of energy
and raw materials. An extension of the conflict situation beyond Ukraine would
further increase the risk of a global economic downturn. Rising inflation and higher
interest rates could also lead to a significant decline in consumption. Both customs
disputes and trade restrictions, for example between the USA and China, can affect
global trade and thus global economic growth, and include the risk of a decline in
foreign demand from the Chinese perspective and an accompanying decline in the
Chinese gross domestic product. There is also the risk that semiconductors previously
supplied to China will increasingly be replaced by locally manufactured products,
and of growing exports of such semiconductors produced in China. Developments
in the wake of the geopolitical risks are dynamic, so it cannot be ruled out that the
actual results deviate significantly from the estimates and assumptions made in the
preparation of these Consolidated Financial Statements, or that the estimates and
assumptions made will have to be adjusted in future periods. These could have a sig-
nificant impact on Infineon’s financial position, results of operations and cash flows.
Areas containing estimates and assumptions and that are consequently most likely to
be affected when actual results vary from estimates and assumptions are the following:
›
valuation of inventory (see “Inventories”, p. 100, and note 11, p. 117),
›
recoverability of non-financial assets, in particular property, plant and equipment
(see note 13, p. 118 f.) and goodwill (see note 14, p. 120 f.),
›
recognition and valuation of provisions (see “Other provisions” notes 17, p. 124,
and 24, p. 136 ff.) and
›
revenue where the transaction price contains a variable element (see “Revenue
recognition”, p. 104 f.).
All assumptions and estimates are based on the circumstances and assessments
as of the balance sheet date, taking into account the knowledge gained up to the
approval by the Management Board of the Consolidated Financial Statements on
21 November 2023.
3 Acquisitions
Acquisition of 100 percent of the shares in GaN Systems Inc.
On 24 October 2023, Infineon acquired all of the shares in GaN Systems Inc. (“GaN
Systems”), which is based in Ottawa (Canada). GaN Systems develops GaN-based
power conversion solutions. With this acquisition, Infineon strengthens its leading
position in the power systems sector. The provisional purchase price is €828 million,
of which €825 million resulted in a cash outflow at the time of acquisition, and a
further €3 million will be paid later to former shareholders under a terminated stock
option program. According to the preliminary opening balance sheet, the net assets
acquired by the Company amounted to €57 million. The acquired assets mainly relate
to cash, inventories, rights of use under leasing arrangements, and property, plant
and equipment. Acquired liabilities primarily relate to trade payables and leasing
liabilities. The estimated excess of purchase price over assets acquired is around
€771 million. The purchase price allocation was not yet completed at the time of
107
Infineon | Annual Report 2023
Further information
Combined Management Report
Management Board and Supervisory Board
Notes to the Consolidated Financial Statements
Consolidated Financial Statements
109.
preparing the ConsolidatedFinancial Statements, so the preliminary results are
not yet available. The excess purchase price is expected to be primarily attributable
to goodwill and, downstream, to technologies and customer relationships. Due to the
proximity of the acquisition to the date of preparation of the Consolidated Financial
Statements and the resulting insufficient information, other disclosures required by
IFRS 3 cannot be made.
Acquisition of Imagimob AB and 3db Access AG
On 15 May 2023, Infineon acquired Imagimob AB in full. The startup, based in Stock-
holm (Sweden), is a platform provider for Machine Learning solutions for edge devices.
Infineon further advances its position as a provider of machine learning solutions
with this acquisition and, once again, significantly supplements its artificial intelli-
gence offering.
On 4 October 2023, Infineon also acquired all shares in the startup 3db Access AG,
based in Zurich (Switzerland). The startup is a pioneer in secured low power
ultra-wideband technology. The acquisition strengthens Infineon’s portfolio of
secure and intelligent access control, precise localization and enhanced sensing.
The last two acquisitions mentioned have only minor or no financial impacts during
the reporting period, therefore no further disclosures in accordance with IFRS 3
are required.
4
Notes to the Consolidated Statement
of Profit or Loss
Revenue
Breakdowns of revenue by segments, product groups and geographic areas are
disclosed in note 29. p. 156 ff.
The aggregate amount of the transaction prices of the unsatisfied and partially
unsatisfied performance obligations, arising from contracts with customers within
the meaning of IFRS 15 with original expected durations of more than one year, was
as follows as of 30 September 2023 and 2022:
Revenue expected in (€ in millions)
Total Less than
1 year
1 year
and after
As of 30 September 2023 4,111 1,804 2,307
As of 30 September 2022 1,257 488 769
The increase in expected revenue is mainly due to capacity reservation agreements.
Infineon refrains from disclosing the remaining performance obligations arising
from contracts with customers within the meaning of IFRS 15 with original expected
durations of one year or less.
108
Infineon | Annual Report 2023
Further information
Combined Management Report
Management Board and Supervisory Board
Notes to the Consolidated Financial Statements
Consolidated Financial Statements
110.
Cost of materialsand purchased services as well as
personnel expenses
The Consolidated Statement of Profit or Loss includes the following expenses for
materials, purchased services, and personnel:
Change
€ in millions 2023 2022 absolute in %
Cost of raw materials, supplies
and purchased goods 3,372 2,788 584 21
Cost of purchased services 3,749 3,433 316 9
Total 7,121 6,221 900 14
Change
€ in millions 2023 2022 absolute in %
Wages and salaries 3,684 3,544 140 4
Social insurance levies and employee benefits 600 555 45 8
Expenses for pensions 69 71 (2) (3)
Total 4,353 4,170 183 4
The average number of employees by geographic region was as follows for the 2023
and 2022 fiscal years:
Change
2023 2022 absolute in %
Europe 23,536 21,703 1,833 8
therein: Germany 14,609 13,687 922 7
Asia-Pacific (excluding Japan, Greater China) 25,191 23,762 1,429 6
Greater China1 3,024 2,698 326 12
therein: Mainland China, Hong Kong 2,611 2,313 298 13
Japan 670 653 17 3
Americas 5,241 5,470 (229) (4)
therein: USA 3,734 3,908 (174) (4)
Total 57,662 54,286 3,376 6
1 Greater China comprises Mainland China, Hong Kong and Taiwan.
Grants
Infineon has received grants from various governmental institutions under government
business development programs, including grants for the construction of manufac-
turing facilities, research and development activities and employee development.
Grants included directly in profit or loss in the Consolidated Financial Statements
during the 2023 and 2022 fiscal years were as follows:
Change
€ in millions 2023 2022 absolute in %
Included in the Consolidated Statement
of Profit or Loss in:
Cost of goods sold 75 61 14 23
Research and development expenses 130 113 17 15
Selling, general and administrative expenses 3 2 1 50
Total 208 176 32 18
Of the grants included in profit or loss in the 2023 fiscal year, €3 million relate to
expenses incurred in the prior year (prior year: €0 million).
109
Infineon | Annual Report 2023
Further information
Combined Management Report
Management Board and Supervisory Board
Notes to the Consolidated Financial Statements
Consolidated Financial Statements
111.
In the 2023fiscal year, investment grants of €45 million (adjusted previous fiscal
year amount: €22 million) were deducted from acquisition or construction costs for
property, plant and equipment and intangible assets. In the 2023 fiscal year, Infineon
received investment grants of €27 million (2022: €22 million).
For compliance with the conditions attached to the grants received and potential
repayment requirements in case of nonfulfillment, see note 23. p. 135 f.
Financial income and expenses
Financial income comprised the following in the 2023 and 2022 fiscal years:
Change
€ in millions 2023 2022 absolute in %
Interest income 60 11 49 +++
Other financial income1 45 (4) 49 +++
Total 105 7 98 +++
1
The negative amount in other financial income in the 2022 fiscal year arose from the negative change in the fair value of the
derivative financial instruments, recorded as a reversal of unrealized gains recognized in previous fiscal years.
Financial expenses comprised the following in the 2023 and 2022 fiscal years:
Change
€ in millions 2023 2022 absolute in %
Interest expenses (158) (142) (16) (11)
Other financial expenses (1) (26) 25 96
Total (159) (168) 9 5
Further information on Infineon’s financial income and expenses is contained in
note 27. p. 146 f.
5
Investments accounted for using
the equity method
The investments accounted for using the equity method comprise shares in joint
ventures and in associated companies.
Summarized financial information for joint ventures
As of 30 September 2023 and 2022, the carrying amounts of joint ventures accounted
for using the equity method were €74 million and €56 million, respectively.
For the 2023 and 2022 fiscal years, Infineon’s proportion of selected items from the
statement of comprehensive income of the joint ventures accounted for using the
equity method were aggregated as follows:
Change
€ in millions 2023 2022 absolute in %
Profit (loss) for the period 28 29 (1) (3)
Other comprehensive income (loss), net of tax – 3 (3) –––
Total comprehensive income (loss), net of tax 28 32 (4) (13)
The pro rata result of the joint ventures accounted for using the equity method is not
part of the Segment Result (see note 29, p. 159).
110
Infineon | Annual Report 2023
Further information
Combined Management Report
Management Board and Supervisory Board
Notes to the Consolidated Financial Statements
Consolidated Financial Statements
112.
Summarized financial informationfor associated companies
As of 30 September 2023 and 2022, the carrying amount of the associated companies
accounted for using the equity method was €40 million and €44 million, respectively.
For the 2023 and 2022 fiscal years, Infineon’s proportion of selected items from the
statement of comprehensive income of the associated companies accounted for
using the equity method were aggregated as follows:
Change
€ in millions 2023 2022 absolute in %
Profit (loss) for the period (1) 10 (11) –––
Other comprehensive income (loss), net of tax – – – –
Total comprehensive income (loss), net of tax (1) 10 (11) –––
The pro rata result of the associated companies accounted for using the equity method
is not part of the Segment Result (see note 29, p. 159).
6 Income tax
Income tax from continuing operations for the fiscal years ending 30 September 2023
and 2022 amounted to:
Change
€ in millions 2023 2022 absolute in %
Current tax expense (626) (393) (233) (59)
Deferred tax income (156) (144) (12) (8)
Income tax (782) (537) (245) (46)
The German combined statutory tax rate for Infineon Technologies AG was 28 percent
for both the 2023 and 2022 fiscal years. This is based on a corporate income tax rate of
15 percent, plus a solidarity surcharge of 5.5 percent and a trade tax rate of 12 percent.
Taxable income earned by foreign subsidiaries is determined on the basis of the
tax laws applicable in the relevant countries and is taxed based on the respective
country-specific tax rates.
The reconciliation of income taxes from continuing operations for the fiscal years
ended 30 September 2023 and 2022, based on the German combined statutory income
tax rate of 28 percent for the 2023 and 2022 fiscal years, is as follows:
Change
€ in millions 2023 2022 absolute in %
Expected income tax expense (1,098) (760) (338) (44)
Tax rate differential 136 93 43 46
Effects due to changes in tax rates (1) 13 (14) –––
Effects from the difference between
local and functional currency (28) 8 (36) –––
Previous year taxes 86 77 9 12
therein: current tax income 69 73 (4) (5)
Non-deductible expenses (47) (52) 5 10
Tax-exempt income 96 73 23 32
Change in permanent balance sheet effects (10) (43) 33 77
Change in valuation allowance
on deferred tax assets 25 (43) 68 +++
Change in available tax credits 71 96 (25) (26)
Other (12) 1 (13) –––
Actual income taxes (782) (537) (245) (46)
111
Infineon | Annual Report 2023
Further information
Combined Management Report
Management Board and Supervisory Board
Notes to the Consolidated Financial Statements
Consolidated Financial Statements
113.
“Change in valuationallowances on deferred tax assets” consisted of the following:
In the 2023 fiscal year, amounts recognized in profit or loss included valuation
allowances or non-recognition of deferred tax assets for tax loss carry-forwards
of €0 million (2022: €27 million) and tax credits of €20 million (2022: €67 million).
A write-up of deferred tax assets for tax loss carry-forwards of €10 million was
recorded (2022: €0 million). Within tax credits, the write-up of deferred tax assets
amounted to €35 million in the 2023 fiscal year (2022: €10 million) and temporary
differences amounted to €0 million (2022: €41 million).
The utilization of tax loss carry-forwards, tax credits and temporary differences for
which deferred tax assets had not previously been recorded resulted in current tax
income of €61 million in the 2023 fiscal year (2022: €1 million).
Deferred tax assets and liabilities as of 30 September 2023 and 2022 comprised the
following:
€ in millions
30September 2023 Change 2023 30September 2022 Change 2022
Deferred
tax assets
Deferred
tax liabilities
Total Therein through
profit or loss
Deferred
tax assets
Deferred
tax liabilities
Total Therein through
profit or loss
Intangible assets 23 (511) 219 177 44 (751) (15) 74
Property, plant and equipment 166 (207) (32) (39) 156 (165) (13) (2)
Inventories 35 (28) (7) (6) 39 (25) 8 6
Provisions, pensions and similar commitments 213 (22) (113) (81) 339 (35) 24 21
Other 50 (47) 13 14 29 (39) (5) (6)
Total deferred taxes on temporary differences 487 (815) 80 65 607 (1,015) (1) 93
Tax loss carry-forwards 156 – (238) (240) 394 – (183) (197)
Unused tax credits and excess foreign tax credits 186 – 16 19 170 – (31) (40)
Total deferred taxes 829 (815) (142) (156) 1,171 (1,015) (215) (144)
Netting (561) 561 – – (644) 644 – –
Total 268 (254) (142) (156) 527 (371) (215) (144)
112
Infineon | Annual Report 2023
Further information
Combined Management Report
Management Board and Supervisory Board
Notes to the Consolidated Financial Statements
Consolidated Financial Statements
114.
Infineon assessed theneed for a valuation allowance of its deferred tax assets. Based
on the results of this assessment, considering all positive and negative factors and
information relating to the foreseeable future based on business plans, Infineon
recognized deferred tax assets, after netting, of €268 million as of 30 September 2023
(30 September 2022: €527 million).
Taxable losses brought forward and tax credits amount to the following:
Change
€ in millions 2023 2022 absolute in %
Corporate tax loss carry-forwards – Germany – 716 (716) –––
Trade tax loss carry-forwards – Germany 982 1,940 (958) (49)
Corporate tax loss carry-forwards and
local tax loss carry-forwards (particularly
US state tax loss carry-forwards) – foreign 509 625 (116) (19)
Tax credits 632 714 (82) (11)
No deferred taxes were recorded for the following items (gross amounts):
Change
€ in millions 2023 2022 absolute in %
Corporate tax loss carry-forwards and
local tax loss carry-forwards (particularly
US state tax loss carry-forwards) – foreign 345 412 (67) (16)
Thereof expire within the next five years 53 87 (34) (39)
Tax credits 446 544 (98) (18)
Thereof expire within the next five years – – – –
Deductible temporary differences 45 36 9 25
The change in the net amount of deferred tax assets and liabilities is as follows:
€ in millions 2023 2022
Deferred taxes, net as of the end of the previous fiscal year 156 371
Deferred tax income (expense), recognized through profit or loss:
From continuing operations (156) (144)
From discontinued operations – –
Change of deferred taxes, recognized directly in equity:
Deferred tax arising from business acquisitions – (1)
Deferred taxes recognized directly in equity 5 5
Deferred taxes recognized in other comprehensive income (13) (26)
Currency effects 22 (49)
Deferred taxes, net as of the end of the fiscal year 14 156
In connection with investments in subsidiaries, there were temporary taxable differ-
ences of €299 million (2022: €242 million) for which no deferred taxes have been
recognized because the timing of the reversal can be controlled, and it is not probable
that the temporary differences will reverse in the foreseeable future.
113
Infineon | Annual Report 2023
Further information
Combined Management Report
Management Board and Supervisory Board
Notes to the Consolidated Financial Statements
Consolidated Financial Statements
115.
Including the itemsrecognized directly in equity and in other comprehensive income
and the expense/benefit from continuing and discontinued operations, the income
tax consisted of the following:
Change
€ in millions 2023 2022 absolute in %
Income taxes from continuing operations,
recognized in profit or loss (782) (537) (245) (46)
Income taxes from discontinued operations,
recognized in profit or loss 1 – 1 +++
Income taxes recognized directly in equity 22 9 13 +++
Income taxes recognized in
other comprehensive income (12) (26) 14 54
Income taxes (771) (554) (217) (39)
As in the previous fiscal year, income taxes recognized directly in equity in the 2023
fiscal year were the result of tax effects in connection with the compensation for
hybrid capital and with share-based compensation.
The income taxes recognized in other comprehensive income in the 2023 fiscal year
comprise mainly actuarial gains and losses arising from pension commitments of
€15 million (2022: €25 million).
7 Disposals and discontinued operations
Qimonda – discontinued operations
On 23 January 2009, Qimonda AG (“Qimonda”), a majority-owned company, filed
an application at the Munich local court to commence insolvency proceedings. On
1 April 2009, the insolvency proceedings formally opened. Insolvency proceedings
were also opened for further domestic and foreign subsidiaries of Qimonda. Some
of these insolvency proceedings have already been completed. The impacts of these
proceedings are reported as discontinued operations in Infineon’s Consolidated
Statement of Profit or Loss and Consolidated Statement of Cash Flows to the extent
that the underlying events occurred before the commencement of insolvency pro-
ceedings.
The current risks and provisions relating to Qimonda’s insolvency are described in
note 24 “Proceedings in relation to Qimonda”. p. 136 ff.
In the 2023 and 2022 fiscal years, adjustments to individual provisions arose as a
result of recent developments in connection with the insolvency of Qimonda, which
resulted in a loss from discontinued operations, net of income taxes of €2 million
and €7 million, respectively.
114
Infineon | Annual Report 2023
Further information
Combined Management Report
Management Board and Supervisory Board
Notes to the Consolidated Financial Statements
Consolidated Financial Statements
116.
8 Earnings pershare
Basic earnings per share are calculated by dividing profit (loss) for the period by
the weighted-average number of shares outstanding during the reporting period.
The calculation of the diluted earnings per share is based on the assumption that
all potentially dilutive instruments are converted into ordinary shares, resulting
in a corresponding increase in the number of shares.
The hybrid bond issued in the 2020 fiscal year is classified as equity (see note 20,
p. 130 f.). The related hybrid investors’ remuneration (after tax) represents payments
for a component of equity that reduces the earnings available to shareholders for
distribution and was therefore taken into account in determining earnings per share
(basic and diluted).
Basic and diluted earnings per share are calculated as follows for the fiscal years
ended 30 September 2023 and 2022:
Change
€ in millions (unless otherwise stated) 2023 2022 absolute in %
Profit (loss) for the period – basic and diluted 3,137 2,179 958 44
Remuneration of hybrid capital investors¹ (29) (29) – –
Profit (loss) for the period attributable to
shareholders of Infineon Technologies AG –
basic and diluted 3,108 2,150 958 45
thereof from continuing operations 3,110 2,157 953 44
thereof from discontinued operations (2) (7) 5 71
Weighted-average number of shares
outstanding (in millions):
Ordinary share capital 1,305.9 1,305.9 – –
Adjustment for own shares (2.9) (4.1) 1.2 29
Weighted-average number of shares
outstanding – basic 1,303.0 1,301.8 1.2 0
Adjustments for:
Effect of share-based payment 2.8 1.8 1.0 56
Weighted-average number of shares
outstanding – diluted 1,305.8 1,303.6 2.2 0
Basic earnings per share (in euro):2
Earnings per share (in euro)
from continuing operations 2.39 1.66 0.73 44
Earnings (loss) per share (in euro)
from discontinued operations (0.01) (0.01) – –
Earnings per share (in euro) – basic 2.38 1.65 0.73 44
Diluted earnings per share (in euro):2
Earnings per share (in euro)
from continuing operations 2.38 1.65 0.73 44
Earnings (loss) per share (in euro)
from discontinued operations – – – –
Earnings per share (in euro) – diluted 2.38 1.65 0.73 44
1 Including the cumulative tax effect.
2 The calculation of earnings per share is based on unrounded figures.
115
Infineon | Annual Report 2023
Further information
Combined Management Report
Management Board and Supervisory Board
Notes to the Consolidated Financial Statements
Consolidated Financial Statements
117.
9 Financial investments
Financialinvestments comprise fixed-term deposits with banks and investment
funds. Fixed-term deposits with banks are categorized as financial assets and mea-
sured at amortized cost. Investment funds are categorized as financial assets and
measured at fair value through profit or loss (see also note 2, p. 98 f., and note 27,
p. 142 ff.).
Financial investments as of 30 September 2023 and 2022 comprised the following:
30 Septem-
ber 2023
30 Septem-
ber 2022
Change
€ in millions absolute in %
Fixed-term bank deposits – 240 (240) –––
Investment funds 1,770 2,039 (269) (13)
Financial investments, gross 1,770 2,279 (509) (22)
Loss allowances – – – –
Financial investments, net 1,770 2,279 (509) (22)
The loss allowances on financial investments that are measured at amortized cost
changed as follows during the 2023 and 2022 fiscal years:
Change
€ in millions 2023 2022 absolute in %
Loss allowances as of the beginning
of the fiscal year – 1 (1) –––
Revaluation of loss allowances, net – (1) 1 +++
Loss allowances as of the end of the fiscal year – – – –
Information on Infineon’s credit risk management is contained in note 28. p. 153 f.
10 Trade receivables
Trade receivables result from contracts with customers that are due within one year.
As of 30 September 2023 and 2022, they consisted of the following:
30 Septem-
ber 2023
30 Septem-
ber 2022
Change
€ in millions absolute in %
Trade receivables, third parties 1,977 1,883 94 5
Trade receivables, related parties 19 10 9 90
Trade receivables, gross 1,996 1,893 103 5
Loss allowances (5) (6) 1 17
Trade receivables, net 1,991 1,887 104 6
Changes in the loss allowances for trade receivables in the 2023 and 2022 fiscal years
were as follows:
Change
€ in millions 2023 2022 absolute in %
Loss allowances as of the beginning
of the fiscal year 6 5 1 20
Current year’s loss allowance, net of reversals (1) 1 (2) –––
Loss allowances as of the end of the fiscal year 5 6 (1) (17)
Information about Infineon’s credit risk management is contained in note 28. p. 153 f.
116
Infineon | Annual Report 2023
Further information
Combined Management Report
Management Board and Supervisory Board
Notes to the Consolidated Financial Statements
Consolidated Financial Statements
118.
11 Inventories
Inventories asof 30 September 2023 and 2022 consisted of the following:
30 Septem-
ber 2023
30 Septem-
ber 2022
Change
€ in millions absolute in %
Raw materials and supplies 612 470 142 30
Work in progress 2,593 1,949 644 33
Finished goods and merchandise 769 662 107 16
Total 3,974 3,081 893 29
Cost of goods sold consisted mainly of inventory-related expenses in the 2023 and
2022 fiscal years.
As of 30 September 2023 and 2022, finished goods and merchandise included an asset
of €22 million and €16 million, respectively, which resulted from sales with a right
of return.
Inventory write-downs as of 30 September 2023 and 2022 amounted to €414 million
and €282 million, respectively.
12 Other current assets
Other current assets as of 30 September 2023 and 2022 consisted of the following:
30 Septem-
ber 2023
30 Septem-
ber 2022
Change
€ in millions absolute in %
Prepayments 347 58 289 +++
VAT and other receivables from tax authorities 204 2441 (40) (16)
Grants receivables 186 1451 41 28
Prepaid expenses 150 131 19 15
Derivative financial instruments
(see note 27, p. 147 ff.) 10 5 5 +++
Other 62 42 20 48
Total 959 625 334 53
1
The previous year’s figures for “VAT and other receivables from tax authorities” and “Grants receivables” have been adjusted.
Further information on Infineon’s financial assets can be found in note 27. p. 142 ff.
117
Infineon | Annual Report 2023
Further information
Combined Management Report
Management Board and Supervisory Board
Notes to the Consolidated Financial Statements
Consolidated Financial Statements
119.
13 Property, plant andequipment and
other intangible assets
The development of property, plant and equipment, as well as other intangible assets
for the years ended 30 September 2023 and 2022, was as follows:
€ in millions
Cost Depreciation/amortization Carrying amount
1 October
2022
Additions Disposals Reclassi-
fication
Currency
effects
30 Sep
tember
2023
1 October
2022
Depre
ciation/
amorti
zation
Disposals Impair-
ments/
reversals
of impair-
ments
Currency
effects
30 Sep
tember
2023
30 Sep
tember
2023
30 Sep
tember
2022
Property, plant and equipment
Land, land rights and buildings 2,565 109 (37) 28 (39) 2,626 (1,080) (80) 22 – 14 (1,124) 1,502 1,485
Technical equipment and machinery 12,540 829 (286) 623 (79) 13,627 (9,600) (916) 279 – 57 (10,180) 3,447 2,940
Other plant and office equipment 1,560 135 (93) 64 (18) 1,648 (1,338) (147) 93 – 12 (1,380) 268 222
Payments on account and construction in progress 904 1,656 (6) (715) (4) 1,835 (6) – – (1) – (7) 1,828 898
Total 17,569 2,729 (422) – (140) 19,736 (12,024) (1,143) 394 (1) 83 (12,691) 7,045 5,545
Other intangible assets
Capitalized development costs 1,444 214 (10) – (8) 1,640 (547) (93) 10 (13) – (643) 997 897
Customer relationships 1,545 – (14) – (107) 1,424 (841) (152) 9 – 50 (934) 490 704
Technologies 2,618 – (11) – (204) 2,403 (892) (245) 7 – 68 (1,062) 1,341 1,726
Licenses and similar rights 338 41 (5) – (3) 371 (261) (31) 5 – 3 (284) 87 77
Remaining other intangible assets 126 – – – (10) 116 (47) (10) – – 3 (54) 62 79
Total 6,071 255 (40) – (332) 5,954 (2,588) (531) 31 (13) 124 (2,977) 2,977 3,483
118
Infineon | Annual Report 2023
Further information
Combined Management Report
Management Board and Supervisory Board
Notes to the Consolidated Financial Statements
Consolidated Financial Statements
120.
€ in millions
CostDepreciation/amortization Carrying amount
1 October
2021
Additions Additions
through
business
combi
nation
Disposals Reclassi-
fication
Currency
effects
30 Sep
tember
2022
1 October
2021
Depre
ciation/
amorti
zation
Disposals Reclassi-
fication
Impair-
ments/
reversals
of impair-
ments
Currency
effects
30 Sep
tember
2022
30 Sep
tember
2022
30 Sep
tember
2021
Property, plant
and equipment
Land, land rights
and buildings 2,302 69 3 (6) 136 61 2,565 (989) (83) 5 – 6 (19) (1,080) 1,485 1,313
Technical equipment
and machinery 11,129 972 6 (130) 455 108 12,540 (8,822) (829) 127 (8) – (68) (9,600) 2,940 2,307
Other plant and
office equipment 1,457 131 – (85) 38 19 1,560 (1,279) (138) 83 8 – (12) (1,338) 222 178
Payments on account and
construction in progress 645 889 – (1) (629) – 904 – – 1 – (6) (1) (6) 898 645
Total 15,533 2,061 9 (222) – 188 17,569 (11,090) (1,050) 216 – – (100) (12,024) 5,545 4,443
Other intangible assets
Capitalized
development costs 1,220 209 – – – 15 1,444 (448) (94) – – (4) (1) (547) 897 772
Customer relationships 1,333 – – – – 212 1,545 (595) (156) – – – (90) (841) 704 738
Technologies 2,214 – – – – 404 2,618 (528) (243) – – – (121) (892) 1,726 1,686
Licenses and similar rights 306 31 – (5) – 6 338 (230) (30) 5 – – (6) (261) 77 76
Remaining other
intangible assets 106 – – – – 20 126 (29) (11) – – – (7) (47) 79 77
Total 5,179 240 – (5) – 657 6,071 (1,830) (534) 5 – (4) (225) (2,588) 3,483 3,349
Depreciation on property, plant and equipment is presented in the Consolidated
Statement of Profit or Loss, mainly in cost of goods sold. Amortization of intangible
assets is mainly presented in cost of goods sold or selling, general and administrative
expenses. Impairments on property, plant and equipment and other intangible
assets are reported under other operating expenses.
119
Infineon | Annual Report 2023
Further information
Combined Management Report
Management Board and Supervisory Board
Notes to the Consolidated Financial Statements
Consolidated Financial Statements
121.
14 Goodwill
Changes ingoodwill during the 2023 and 2022 fiscal years were as follows:
€ in millions 2023 2022
Cost
Balance as of the beginning of the fiscal year 7,083 5,962
Additions through business combination 27 28
Disposals (10) –
Currency effects (553) 1,093
Balance as of the end of the fiscal year 6,547 7,083
Accumulated impairments and other changes
Balance as of the beginning of the fiscal year – –
Impairments – –
Disposals – –
Currency effects – –
Balance as of the end of the fiscal year – –
Carrying amount
Balance as of the beginning of the fiscal year 7,083 5,962
Balance as of the end of the fiscal year 6,547 7,083
Infineon carried out the annual goodwill impairment test at the operating segment
level in the fourth quarter of the 2023 fiscal year.
Infineon determines the recoverable amount of a particular cash generating unit to
which goodwill has been allocated on the basis of its value in use. The value in use is
measured by estimating the present value of future cash flows that will be generated
by the continuing operations of the CGU discounted using an appropriate discount rate.
Cash flows, including the underlying parameters such as revenue growth and margins,
are projected based on past experience, current operating results and the business
plan approved in the fiscal year just ended, which is calculated bottom-up based on
certain central assumptions applied consistently throughout Infineon. Cash flows over
a five-year period are used to derive the value in use. The derivation of the terminal
value is based on a stable business state, reflecting synergies resulting from the
acquisition of Cypress. The average revenue growth rates over the planning period
are between 10.5 percent and 16.4 percent, which is in part higher than the average
historical growth rates of the sectors in which the relevant segments operate because,
among other things, the segments benefit to varying degrees from the businesses
acquired with Cypress and the related revenue synergies. Investments to increase
capacity for which no cash outflow has taken place are not taken into account. Cash
flows for periods beyond the planning horizon are estimated using a terminal value.
The discount rate for future cash flows is based on the after-tax weighted-average
cost of capital (“WACC”) for the CGU in question. The Capital Asset Pricing Model
(“CAPM”) is used to calculate the cost of equity. The relevant pre-tax WACC used to
discount future pre-tax cash flows in line with IAS 36 is derived from estimated future
after-tax cash flows and the after-tax WACC using a typical tax rate for each operating
segment. The risk-free interest rate is derived using the Svensson method taking
into account risk premiums, the beta factor and debt ratio are derived from a group
of companies comparable to the operating segment. In this way, the discount rate
derived reflects the current market rate of return as well as the specific risks attached
to the respective operating segment.
120
Infineon | Annual Report 2023
Further information
Combined Management Report
Management Board and Supervisory Board
Notes to the Consolidated Financial Statements
Consolidated Financial Statements
122.
The following tableshows the allocation of the carrying amount of goodwill to the
segments, as well as the valuation parameters used:
Book value of allocated goodwill
€ in millions
Pre-tax WACC1
in %
After-tax WACC1
in %
Terminal growth rate1
in %
Operating segment 2023 2022 2023 2022 2023 2022 2023 2022
Automotive 1,556 1,686 14.5 13.2 10.7 9.9 1.5 1.5
Green Industrial Power 244 261 15.2 13.4 11.0 10.0 1.5 1.5
Power Sensor Systems 1,843 2,011 14.2 14.1 11.1 10.7 1.5 1.5
Connected Secure Systems 2,902 3,123 14.0 12.9 10.6 10.0 1.5 1.5
Corporate 2 2
Total 6,547 7,083
1 Valuation parameters as of 30 June 2023 and 2022 for the respective impairment test in the fourth quarter.
As a result of the impairment tests carried out, Infineon concluded that none of the
operating segments gave rise to an impairment of goodwill in the year under report.
Business planning is affected, among other things, by uncertainties regarding the
assessment of markets and the macroeconomic environment. Therefore, sensitivity
analyses were carried out at operating segment level, taking into account changes
considered possible in the main assumptions. Even taking these changes into
account, no impairment on goodwill was observed as a result of the sensitivity
analyses at operating segment level.
In addition, up to the date of preparation of the Consolidated Financial Statements,
there was no indication that the recoverable amount of an operating segment to which
goodwill had been allocated could have fallen below the book value.
121
Infineon | Annual Report 2023
Further information
Combined Management Report
Management Board and Supervisory Board
Notes to the Consolidated Financial Statements
Consolidated Financial Statements
123.
15 Leases
Leases concludedrelate mainly to the rental of office and warehouse space, IT equip-
ment, other plant and office equipment, as well as vehicles for selected employees.
The changes in the right-of-use assets in the 2023 and 2022 fiscal years were as follows:
€ in millions
Starting
balance
Additions Additions
through
business
combi
nations
Depreciation Other
changes
Carrying
amount
The 2023 fiscal year
Land, land rights
and buildings 389 92 – (70) (22) 389
Technical equip-
ment and machinery 6 2 – (3) – 5
Other plant and
office equipment 10 9 – (7) (1) 11
Total 405 103 – (80) (23) 405
The 2022 fiscal year
Land, land rights
and buildings 319 119 1 (71) 21 389
Technical equip-
ment and machinery 8 1 – (3) – 6
Other plant and
office equipment 9 7 – (6) – 10
Total 336 127 1 (80) 21 405
The allocation of discounted and undiscounted lease liabilities by maturity as of
30 September 2023 and 2022 was as follows:
30 September 2023 30 September 2022
€ in millions
Discounted
lease liabilities
Undiscounted
lease liabilities
Discounted lease
liabilities
Undiscounted
lease liabilities
Due within one year 72 82 76 81
Due after one year to five years 197 230 209 235
Due after more than five years 112 133 101 115
Total 381 445 386 431
The Consolidated Statement of Profit or Loss includes the following amounts in the
2023 and 2022 fiscal years that are attributable to leases:
Change
€ in millions 2023 2022 absolute in %
Depreciation 80 80 – –
Interest expenses 11 5 6 +++
Expenses for short-term leases
with a term of twelve months or less 5 5 – –
Expenses for low-value leases 11 6 5 83
The Consolidated Statement of Cash Flows includes the following amounts in the
2023 and 2022 fiscal years that are attributable to leases:
Change
€ in millions 2023 2022 absolute in %
Payments for short-term leases
and low-value leases 16 11 5 45
Payments for lease prepayments – 17 (17) –––
Payments for lease liabilities 86 84 2 2
Interest payments 11 5 6 +++
Total 113 117 (4) (3)
122
Infineon | Annual Report 2023
Further information
Combined Management Report
Management Board and Supervisory Board
Notes to the Consolidated Financial Statements
Consolidated Financial Statements
124.
Some leases containrenewal options that may be exercised by Infineon prior to
the expiration of the non-cancelable lease term. Infineon has possible future (undis-
counted) leasing payments amounting to €45 million that are not included in
lease liabilities because it is not sufficiently certain that the leases will be renewed.
In addition, there are future payment obligations for leases that have not yet started
but have already been contracted amounting to €48 million.
Future payment obligations relating to short-term leases with a term of twelve months
or less are immaterial in value.
The lease contracts, in which Infineon subleases and acts as a lessor, are not material
from the Group’s point of view.
The expected non-discounted future minimum lease payments from operating leases
for land and buildings owned by Infineon and in which Infineon acts as lessor are as
follows:
€ in millions
30 Septem-
ber 2023
30 Septem-
ber 2022
Due within one year 12 18
Due after one year to five years 16 23
Due after more than five years 1 –
Total 29 41
16 Financial debt
Financial debt as of 30 September 2023 and 2022 consisted of the following:
€ in millions
30 Septem-
ber 2023
30 Septem-
ber 2022
Short-term financial debt and current portion of long-term financial debt,
weighted average interest rate 2022: 0.87% – 3
Bond €750 million, coupon 0.75%, due 2023 – 749
USPP note US$350 million, interest rate 3.94%, due 2024 330 –
Short-term financial debt and current portion of long-term financial debt 330 752
Bond €500 million, coupon 0.625%, due 2025 498 497
Bond €750 million, coupon 1.125%, due 2026 746 745
Bond €750 million, coupon 1.625%, due 2029 743 742
Bond €650 million, coupon 2.00%, due 2032 640 639
USPP notes US$585 million,
weighted average interest rate 4.18%, due 2026–2028 552 958
USPP notes US$1,300 million,
weighted average interest rate 2.88%, due 2027–2033 1,224 1,329
Long-term financial debt 4,403 4,910
Total 4,733 5,662
A €750 million bond maturing on 24 June 2023 was repaid as scheduled.
The total lines of credit as of 30 September 2023 and 2022 are summarized in the
following table:
Term, € in millions
30 September 2023 30 September2022
Aggregate
facility
Drawn Available Aggregate
facility
Drawn Available
Short-term 69 – 69 83 3 80
Long-term – – – – – –
Total 69 – 69 83 3 80
123
Infineon | Annual Report 2023
Further information
Combined Management Report
Management Board and Supervisory Board
Notes to the Consolidated Financial Statements
Consolidated Financial Statements
125.
Nominal amounts offinancial debt and interest maturing in the coming years were
as follows:
€ in millions
30 September 2023 30 September 2022
Financial
debt
Interest Financial
debt
Interest
Due within one year 330 108 753 120
Due after one year to five years 2,133 319 2,327 385
Due after more than five years 2,297 143 2,616 215
Total 4,760 570 5,696 720
17 Provisions
Current and non-current provisions as of 30 September 2023 consisted of the following:
€ in millions
1 October
2022
Addition Usage Reversal 30 Septem-
ber 2023
Obligations to employees 952 610 (737) (40) 785
Provisions related to Qimonda
(see note 7, p. 114,
and note 24, p. 136 ff.) 211 9 (3) (5) 212
Warranties 39 30 (6) (13) 50
Other 70 15 (36) 3 52
Total provisions 1,272 664 (782) (55) 1,099
thereof current 983 799
thereof non-current 289 300
Obligations to employees included, among others, costs of variable remuneration,
outstanding vacation and flextime, service anniversary awards, other personnel costs
and social security costs.
Provisions for warranties mainly represented the estimated future cost of fulfilling
contractual requirements associated with products sold.
Other provisions comprised mainly provisions for litigations (other than those relating
to Qimonda), asset retirement obligations and miscellaneous other liabilities.
Of the total provisions as of 30 September 2023 and 2022, cash outflows of €799 million
and €983 million, respectively, were expected to occur within one year. For the non-
current provisions, the cash outflow was expected to occur after more than one year.
Besides the provisions in connection with Qimonda, €49 million as of 30 September
2023 and €42 million as of 2022 of non-current provisions were attributable to length-
of-service related anniversary awards.
18 Other current liabilities
Other current liabilities as of 30 September 2023 and 2022 consisted of the following:
30 Septem-
ber 2023
30 Septem-
ber 2022
Change
€ in millions absolute in %
Reimbursement obligations 688 593 95 16
Payroll and similar obligations to employees 241 248 (7) (3)
Contract liabilities 99 26 73 +++
Accrued interest expense 91 93 (2) (2)
VAT payables 38 50 (12) (24)
Other 128 151 (23) (15)
Total 1,285 1,161 124 11
124
Infineon | Annual Report 2023
Further information
Combined Management Report
Management Board and Supervisory Board
Notes to the Consolidated Financial Statements
Consolidated Financial Statements
126.
Contract liabilities amountedto €126 million and €32 million as of 30 September 2023
and 2022, respectively. Of this amount, €27 million (30 September 2022: €6 million)
related to non-current contract liabilities reported under other non-current liabilities.
The increase in contract liabilities mainly results from advance payments from
customers based on capacity reservation agreements.
Further information on Infineon’s financial liabilities can be found in note 27. p. 142 ff.
19 Pension plans
Defined benefit pension plans
Infineon’s employee benefit plans consist of domestic and foreign defined benefit
and defined contribution pension plans providing retirement, disability and
surviving dependents’ benefits. For Infineon, the significant benefit plans in
Germany pertain to Infineon Technologies AG and, within the foreign benefit plans,
to Infineon Technologies Austria AG, Austria.
In Germany, Infineon primarily offers defined contribution benefits which provide
for the employees when they reach retirement age, or in the event of disability or
death. The statutory framework is provided by the Company Pension Act (in German:
Betriebsrentengesetz or “BetrAVG”) and by employment law in general. With the
Infineon pension plan, new entrants receive a defined contribution benefit, which is
funded by Infineon. Payments by the Infineon pension plan are generally made in
twelve annual installments. For active employees who were entitled to benefits in the
form of an annuity before the Infineon Pension Plan came into force, this commitment
was transferred into the Infineon Pension Plan and thereby the possibility of an
annuity is guaranteed. Together with former employees whose pension benefit obli-
gations were not transferred into the Infineon Pension Plan, this group makes up the
largest part of the obligation at this time. A corresponding provision is recorded for
the German defined benefit pension plans, which are partly backed by plan assets.
Individual agreements are in place for the members of the Management Board, which
are backed by plan assets. The major portion of the plan assets is managed by a pen-
sion trust in the legal form of a registered association. This is composed of executives
of Infineon Technologies AG, and the investment strategy is defined by Infineon
Technologies AG.
The benefit obligation of some foreign plans is measured according to the income
in the last month or year of service; others are dependent on average income over
the service period. Foreign pension plans are managed by country-specific external
pension funds or other pension schemes. The obligations arising from foreign defined
benefit pension plans are partly covered by plan assets. The management of existing
foreign plan assets is performed by the respective pension scheme.
The valuation date of the pension plans is 30 September.
The Group-defined benefit pension plans are exposed to risks arising from changes
to actuarial assumptions such as discount factors, salary and pension trends,
investment risks and longevity risks. A lower discount rate leads to higher pension
liabilities. Lower than expected growth in plan assets could lead to a deterioration
of the funded status.
125
Infineon | Annual Report 2023
Further information
Combined Management Report
Management Board and Supervisory Board
Notes to the Consolidated Financial Statements
Consolidated Financial Statements
127.
The development ofInfineon’s German (domestic) and non-German (foreign) pension
plans and the plan assets as of 30 September 2023 and 2022 is presented in the
following table:
€ in millions
2023 2022
Domestic plans Foreign plans Total Domestic plans Foreign plans Total
Change in defined benefit obligations taking into account future salary increases:
Present value as of the beginning of year (802) (183) (985) (1,161) (220) (1,381)
Current service cost (20) (8) (28) (28) (7) (35)
Past service income (cost) – – – (1) 2 1
Interest cost (29) (8) (37) (14) (5) (19)
Actuarial gains (losses) for:
Experience adjustments (36) (8) (44) 23 (10) 13
Adjustments to demographic assumptions – 1 1 32 – 32
Adjustments to financial assumptions 72 – 72 333 53 386
New plans created and plan amendments (4) – (4) – – –
Benefits paid 26 12 38 24 11 35
Employee contributions (8) – (8) (10) – (10)
Currency effects – 6 6 – (7) (7)
Present value of defined benefit obligation as of the end of year (801) (188) (989) (802) (183) (985)
Change in fair value of plan assets:
Fair value of plan assets as of the beginning of year 617 71 688 671 93 764
Expected return on plan assets 23 3 26 8 2 10
Actuarial gains (losses) 8 (5) 3 (70) (29) (99)
Contributions from Infineon 23 10 33 22 11 33
Employee contributions 8 – 8 10 – 10
Benefits paid (26) (12) (38) (24) (11) (35)
Reclassification of fair value of plan assets 4 – 4 – – –
Currency effects – (3) (3) – 5 5
Fair value of plan assets as of the end of year 657 64 721 617 71 688
Net pension liability (144) (124) (268) (185) (112) (297)
thereof: Infineon Technologies AG (128) – (128) (167) – (167)
thereof: Infineon Technologies Austria AG – (58) (58) – (51) (51)
126
Infineon | Annual Report 2023
Further information
Combined Management Report
Management Board and Supervisory Board
Notes to the Consolidated Financial Statements
Consolidated Financial Statements
128.
Pension obligations arereported in the Consolidated Statement of Financial Position
under “Pensions and similar commitments”. p. 91
Since no asset ceilings applied, the funded status of the Infineon pension plans
corresponded to the amounts reported in the Consolidated Statement of Financial
Position as of 30 September 2023 and 2022.
The funding of the defined benefit obligations as of 30 September 2023 and 2022 was
as follows:
€ in millions
30 September 2023 30 September 2022
Domestic
plans
Foreign
plans
Total Domestic
plans
Foreign
plans
Total
Plans that are wholly
unfunded 48 92 140 48 82 130
Plans that are wholly
or partly funded 753 96 849 754 101 855
Total 801 188 989 802 183 985
Actuarial assumptions
The weighted-average assumptions used in calculating the actuarial values for the
pension plans were as follows:
in %
30 September 2023 30 September 2022
Domestic
plans
Foreign
plans
Domestic
plans
Foreign
plans
Discount rate at the end of the fiscal year 4.1 5.1 3.8 4.8
Rate of salary increase 2.4 5.7 2.5 5.0
Projected future pension increases 2.1 2.8 2.3 2.9
In order to determine the present value as of the balance sheet date, the Willis Towers
Watson RATE:Link approach was applied, which is based on high-grade fixed-interest
corporate bonds from issuers carrying a very high credit rating, with the same maturity
and in the same currency as the pension obligations to be assessed.
The 2018 G mortality tables by Dr. Klaus Heubeck were used for Germany as in the
previous year, and for Austria, the AVÖ 2018-P tables were applied.
Sensitivity analysis
The following sensitivity analysis table shows how the present value of all defined
benefit pension obligations would be affected by changes in the aforementioned
actuarial assumptions. In each case, they reflect the effect of changes in one actuarial
assumption while all other assumptions remain constant.
€ in millions
30 September 2023 30 September 2022
Domestic
plans
Foreign
plans
Total Domestic
plans
Foreign
plans
Total
Present value of defined
benefit pension plans with:
a 50 basis points
higher discount rate 756 179 935 753 173 926
a 50 basis points
lower discount rate 851 198 1,049 857 193 1,050
a 50 basis points
higher expected rate
of salary increase 808 193 1,001 809 187 996
a 50 basis points
lower expected rate
of salary increase 795 183 978 796 179 975
a 50 basis points
higher expected rate
of pension increase 821 191 1,012 825 186 1,011
a 50 basis points
lower expected rate
of pension increase 783 185 968 781 180 961
Increase in life expectancy
of one year 818 190 1,008 820 185 1,005
127
Infineon | Annual Report 2023
Further information
Combined Management Report
Management Board and Supervisory Board
Notes to the Consolidated Financial Statements
Consolidated Financial Statements
129.
Investment strategy
The pensionplans’ assets are invested with several fund managers. The investment
guidelines require a mix of active and passive investment management programs
covering different asset classes. Taking the duration of the underlying liabilities into
account, a portfolio of investments of plan assets in equity, debt and other securities,
as well as real estate and reinsurance policies, is targeted to maximize the total long-
term return on assets for a given level of risk. Investment risk is monitored on an
ongoing basis through periodic portfolio reviews, in coordination with investment
managers and annual liability measurements. Investment policies and strategies are
periodically reviewed as part of detailed studies of assets and liabilities by indepen-
dent investment advisors and actuaries to ensure the objectives of the plans are met,
taking into account any changes in benefit plan structure, market conditions or other
material items. The aim is to optimize the risk-return profile of plan assets against
the liabilities using a diversified portfolio of investments within a defined risk budget
and to thereby increase the funding ratio in the long term.
Plan asset allocation
As of 30 September 2023 and 2022, the allocation of invested plan assets to the major
asset categories was as follows:
€ in millions
30 September 2023 30 September 2022
Quoted
in an
active market
Not quoted
in an
active market
Quoted
in an
active market
Not quoted
in an
active market
Government bonds 146 1 130 1
Corporate bonds 159 – 173 –
Equity securities 261 – 231 –
Cash and cash equivalents 22 – 29 –
Reinsurance policies – 42 – 39
Property 3 29 3 30
Other 37 21 36 16
Total 628 93 602 86
Government and corporate bonds are traded in liquid markets and the majority have
an investment grade rating. The geographical allocation of the equity component
of plan assets is globally diversified. As a matter of policy, Infineon’s pension plans
do not invest in the shares or debt instruments of Infineon. The position “Other” in
the previous table comprises exchange-traded commodities (ETC) and other invest-
ment funds. The market value of the ETC held domestically was €36 million as of
30 September 2023 (previous year: €35 million).
The market value of the land and real estate leased to Infineon group companies by
the legally independent pension trust amounted to €29 million and €30 million as of
30 September 2023 and 2022 respectively.
The realized return on plan assets in the fiscal year ended 30 September 2023 was
positive €29 million (30 September 2022: negative €89 million).
Amounts recognized in the Consolidated Statement of Profit or Loss
and in the Consolidated Statement of Comprehensive Income
The expenses and income of defined benefit plans for the 2023 and 2022 fiscal years
comprised the following:
€ in millions
2023 2022
Domestic
plans
Foreign
plans
Total Domestic
plans
Foreign
plans
Total
Current service cost (20) (8) (28) (28) (7) (35)
Past service (cost) benefit – – – (1) 2 1
Interest cost (29) (8) (37) (14) (5) (19)
Expected return
on plan assets 23 3 26 8 2 10
Pension cost (26) (13) (39) (35) (8) (43)
128
Infineon | Annual Report 2023
Further information
Combined Management Report
Management Board and Supervisory Board
Notes to the Consolidated Financial Statements
Consolidated Financial Statements
130.
Service costs wererecorded within cost of goods sold, research and development
expenses or selling, general and administrative expenses. Interest costs and expected
return on plan assets were recorded net as part of financial expenses.
Actuarial gains before taxes of €32 million and €332 million for the 2023 and
2022 fiscal years, respectively, had been recognized outside of profit (loss) for the
period in other comprehensive income.
As of 30 September 2023 and 2022, cumulative actuarial losses amounted to €39 million
and €71 million, respectively.
In the 2024 fiscal year, payments of €38 million are expected to be made to plan
assets, of which €35 million relate to benefits paid directly to pension recipients by
the Group companies.
The weighted-average duration of defined benefit plans was around 12 and 13 years
as of 30 September 2023 and 2022, respectively.
The following table shows the expected disbursements for defined benefit plans for
the next ten fiscal years as of 30 September 2023 and 2022:
€ in millions
30 Septem-
ber 2023
30 Septem-
ber 2022
Due within one year 48 46
Due after more than one year to five years 218 192
Due after more than five years up to ten years 354 325
Total 620 563
Defined contribution plans
In connection with defined contribution plans, fixed contributions are made to external
insurance providers or funds. Infineon has no further performance obligations or
risks with regard to these pension plans in excess of the fixed contributions paid.
Additionally, the Group makes contributions to government pension schemes.
Expenses for defined contribution plans amounted to €333 million and €309 million
in the 2023 and 2022 fiscal years.
20 Equity
Ordinary share capital
The following table shows a reconciliation of the number of ordinary shares issued as
of 30 September 2023 and 2022:
quantity 2023 2022
Shares outstanding at the beginning of the fiscal year 1,302,231,236 1,301,375,535
Transfer of own shares under the Performance Share
and Restricted Stock Unit Plans (see note 22, p. 133 ff.) 1,518,875 855,701
Shares outstanding at the end of the fiscal year 1,303,750,111 1,302,231,236
Repurchased own shares 2,171,026 3,689,901
Shares issued at the end of the fiscal year 1,305,921,137 1,305,921,137
As of 30 September 2023, the ordinary share capital amounted to €2,611,842,274 and
was fully paid up. It was divided into 1,305,921,137 no par value registered shares,
each representing €2 of the Company’s ordinary share capital. Each share grants the
holder one vote and an equal portion of the profits in the form of a dividend, as
resolved by the Annual General Meeting. Own shares held by the Company as of the
date of the Annual General Meeting carry no voting rights and are not entitled to
a dividend.
Additional paid-in capital
The pro rata expense for share-based payments resulted in an increase in additional
paid-in capital of €92 million in the 2023 fiscal year (2022: €62 million). Due to the
transfer of own shares within the framework of share-based payment to employees
and members of the Management Board, additional paid-in capital, as well as the line
129
Infineon | Annual Report 2023
Further information
Combined Management Report
Management Board and Supervisory Board
Notes to the Consolidated Financial Statements
Consolidated Financial Statements
131.
item for ownshares, decreased by €10 million (2022: €5 million). Tax effects totaling
€23 million (2022: €9 million) increased the additional paid-in capital.
Authorized share capital
As of 30 September 2023, the Company’s Articles of Association provided for two
authorized share capitals amounting to up to €670,000,000:
›
Section 4, paragraph 4 of the Articles of Association provides that the Management
Board is authorized, with the approval of the Supervisory Board, to increase the
share capital in the period until 19 February 2025 once or in several partial amounts
by a total of up to €640,000,000 through the issue of new no par value registered
shares, against contributions in cash or in kind (Authorized Capital 2020/I). The
new shares participate in profits from the beginning of the fiscal year of their issue.
To the extent legally permissible, the Management Board may, with the approval
of the Supervisory Board, and contrary to section 60, paragraph 2 of the German
Stock Corporation Act, stipulate that the new shares participate in the profits from
the beginning of an already ended fiscal year for which no resolution of the Annual
General Meeting on the use of the distributable profit has yet been made at the
time of their issue. The originally authorized capital 2020/I of €750,000,000 was
reduced to €640,000,000 by the capital increase of €110,000,000 as decided by the
Management Board and the Supervisory Board on 26 May 2020 and entered in
the Commercial Register on 27 May 2020. Within the framework of the Authorized
Capital 2020/I, the Management Board is authorized, with the approval of the
Supervisory Board, to exclude the subscription rights of the shareholders in certain
cases. Cash capital increases with subscription rights excluded pursuant to section
186, paragraph 3, sentence 4 of the German Stock Corporation Act, are not permit-
ted to exceed 10 percent of a company’s share capital – neither at the time of the
resolution of the authorization in the Annual General Meeting, nor at the effective
date of the authorization, or its exercise. The capital increase of 26/27 May 2020
utilized around 4 percent of this framework. For share capital increases against
contributions in kind or a combination of cash contributions and contributions in
kind, the authorization further provides an upper limit of 10 percent of the share
capital in place at the date of the authorization in the Annual General Meeting.
›
Section 4, paragraph 7 of the Articles of Association provides that the Manage-
ment Board is authorized, with the approval of the Supervisory Board, to increase
the share capital in the period up to 24 February 2026 – either once or in partial
amounts – by a total of up to €30,000,000 by issuing new no par value registered
shares against contributions in cash for the purpose of increasing the issue to
employees and members of the Executive Board of the Company or its Group
companies. The subscription rights of the shareholders are excluded in relation
to these shares. The shares may be issued to employees in such a manner that the
contribution to be paid on such shares is covered by the portion of the profit for
the year that the Management Board and Supervisory Board could transfer to
retained earnings in accordance with section 58, paragraph 2 of the German Stock
Corporation Act. The Management Board, with the approval of the Supervisory
Board, decides on the additional content of the share rights and the conditions of
share issue (Authorized Capital 2021/I).
Conditional capital
As of 30 September 2023, the Company’s Articles of Association provided for a
conditional capital amounting to up to €260,000,000:
›
Pursuant to section 4, paragraph 6 of the Articles of Association the share capital
is conditionally increased by up to €260,000,000 through the issue of up to
130,000,000 new no par value registered shares for the granting of shares to
creditors or the holders of warrants or convertible bonds, which due to the autho-
rization by the Annual General Meeting on 20 February 2020 are issued by the
Company or a subsidiary company (Conditional Capital 2020/1).
Hybrid capital
Infineon Technologies AG issued a perpetual hybrid bond on 1 October 2019 to
refinance the acquisition of Cypress, which is an equity instrument under IAS 32.
The term is not contractually limited; the bond has no final maturity date. The hybrid
bond can only be canceled by Infineon subject to certain conditions. The investors
have no cancellation rights and cannot trigger a premature repayment liability for
Infineon. Distributions are at Infineon’s sole discretion.
130
Infineon | Annual Report 2023
Further information
Combined Management Report
Management Board and Supervisory Board
Notes to the Consolidated Financial Statements
Consolidated Financial Statements
132.
In the 2023fiscal year, €39 million (2022: €39 million) was recognized in equity as
compensation to hybrid capital investors. For the purpose of calculating earnings per
share, the profit (loss) for the period attributable to the shareholders and hybrid
capital investors of Infineon Technologies AG of €3,137 million (2022: €2,179 million)
was reduced by compensation to the hybrid capital investors of €29 million (2022:
€29 million; net of tax), to €3,108 million (2022: €2,150 million) (see note 8, p. 115).
The hybrid capital investors’ compensation is paid in arrears on 1 April of each year,
subject to repayment or redemption. On 1 April 2023, €39 million (2022: €39 million)
was paid out to the hybrid capital investors.
Retained earnings
The following table shows a reconciliation of retained earnings as of 30 September 2023
and 2022:
€ in millions
As of 1 October 2021 1,407
Profit (loss) for the period attributable to shareholders
and hybrid capital investors of Infineon Technologies AG 2,179
Dividends to shareholders of Infineon Technologies AG (351)
Compensation of hybrid capital investors (39)
Actuarial gains (losses) on pensions and similar commitments
net of tax of minus €25 million 310
As of 30 September 2022 3,506
Profit (loss) for the period attributable to shareholders
and hybrid capital investors of Infineon Technologies AG 3,137
Dividends to shareholders of Infineon Technologies AG (417)
Compensation of hybrid capital investors (39)
Actuarial gains (losses) on pensions and similar commitments
net of tax of minus €16 million 17
As of 30 September 2023 6,204
“Actuarial gains (losses) on pensions and similar commitments” contain the share of
profit (loss) of associates and joint ventures accounted for using the equity method in
the 2023 fiscal year of €0 million (2022: €3 million).
Dividends
For the 2022 fiscal year, a cash dividend of €0.32 per share (total amount: €417 million)
was paid. For the 2021 fiscal year, a cash dividend of €0.27 per share (total amount:
€351 million) was paid.
With regard to the 2023 fiscal year, a dividend of €0.35 for each share entitled to a
dividend shall be proposed to be paid from the €710 million of distributable profits
of Infineon Technologies AG. This would result in an expected distribution of approxi-
mately €456 million. The payment of this dividend depends on the approval of the
Annual General Meeting on 23 February 2024.
Other reserves
Changes in other reserves during the 2023 and 2022 fiscal years were as follows:
€ in millions
2023 2022
Pre-tax Tax Net of tax Pre-tax Tax Net of tax
Currency effects (718) – (718) 1,369 – 1,369
Unrealized gains (losses)
resulting from
hedge accounting 2 (1) 1 (2) – (2)
Realized gains (losses)
resulting from
hedge accounting 5 3 8 7 (1) 6
Cost of hedging (5) 1 (4) – – –
Total (716) 3 (713) 1,374 (1) 1,373
131
Infineon | Annual Report 2023
Further information
Combined Management Report
Management Board and Supervisory Board
Notes to the Consolidated Financial Statements
Consolidated Financial Statements
133.
21 Capital management
Infineon’smain capital management objective is to ensure financial flexibility at all
times on the basis of a solid capital structure. It is of prime importance that sufficient
cash funds are available to finance operating activities and planned investments
throughout all phases of the business cycle. On the other hand, debt should only
constitute a modest portion of the financing mix.
Infineon derives its long-term key objectives for capital management based on these
principles and the clear target to remain investment grade. For liquidity, the gross
cash should amount to €1 billion, plus at least 10 percent of revenue. Gross financial
debt should not exceed two times EBITDA.
Infineon is not subject to any statutory capital requirements, nor are any such
defined in the Articles of Association.
Capital management, as well as the corresponding targets and definitions, are based
on indicators derived from the consolidated IFRS financial statements. Gross cash
is defined as the total of cash and cash equivalents and financial investments. Gross
financial debt comprises short-term and long-term financial debt. Infineon defines
EBITDA as earnings from continuing operations before interest, taxes and depreciation
and amortization.
The gross cash position decreased from €3,717 million as of 30 September 2022,
to €3,590 million as of 30 September 2023 (for details, see the chapter “Review
of liquidity” in the Combined Management Report, p. 56). Based on revenues of
€16,309 million, the ratio of gross cash to revenue as of 30 September 2023 was
€1 billion, plus an additional 15.9 percent of revenue (30 September 2022: €1 billion,
plus 19.1 percent of revenue).
With gross financial debt of €4,733 million as of 30 September 2023 (30 September
2022: €5,662 million), and EBITDA of €5,773 million for the 2023 fiscal year (2022:
€4,518 million), the gross debt to EBITDA ratio was 0.8 as of 30 September 2023
(30 September 2022: 1.3). Infineon continues to have sufficient financial flexibility
to ensure that, in addition to financing its planned investments, it is also able to
regularly pay dividends (see note 20, p. 131).
The USPP notes totaling US$2,235 million issued in April 2016 and June 2021 contain
a number of standard covenants, including a debt coverage ratio, which provides
for a certain relationship between the size of debt (adjusted) and earnings (adjusted).
In the 2023 fiscal year, Infineon has met the minimum requirements of all covenants.
Should Infineon not comply with the covenants attached to the USPP notes, then
all USPP notes outstanding as of 30 September 2023 amounting to US$2,235 million
(see note 16, p. 123) could become immediately repayable.
132
Infineon | Annual Report 2023
Further information
Combined Management Report
Management Board and Supervisory Board
Notes to the Consolidated Financial Statements
Consolidated Financial Statements
134.
22 Share-based payment
TheCompany makes use of the Performance Share Plan and the Restricted Stock
Unit Plan in order to provide share-based payments.
Performance Share Plan
A Long-Term Incentive (LTI) plan, the so-called Performance Share Plan, was developed
for employees and members of the Management Board.
Under this plan, (virtual) performance shares are initially provisionally granted on
1 April (up to the 2020 fiscal year: 1 March) of the fiscal year according to a predeter-
mined LTI grant amount in euros.
Plan conditions for tranches up to and including 1 March 2020
With the granting of a (virtual) performance share, the participants in the plan acquire
the right to receive (real) Infineon shares once a personal investment in Infineon
shares – depending on position and LTI grant amount – has reached a four-year
holding period.
For the tranches up to and including 1 March 2020, the performance shares are split
between 50 percent performance-related shares and 50 percent that are not dependent
on performance. The performance-related shares are finally granted only when the
Infineon share outperforms the Philadelphia Semiconductor Index (SOX) during
the period between the date of the provisional allocation and the end of the vesting
period. If at the end of the vesting period the requirements for an allocation of perfor-
mance shares – either all or only those that are not performance-related – are fulfilled,
then entitlement to the transfer of the corresponding number of (real) Infineon shares
is acquired. The value of the performance shares ultimately assigned to members
of the Management Board must not exceed 250 percent of the respective LTI grant
amount; above this cap, performance shares lapse.
The fair value of the performance shares at the date of allocation was determined by
an external expert using a recognized financial-mathematical method (Monte Carlo
simulation model for the prediction of share price and index developments). The
fair value of the instruments granted was determined, taking into account future
dividends as well as the payment cap.
The following is an overview of the allocations made:
Tranche End of the
waiting period
Average share
price in the
nine months
before grant
in €
Number of
performance
shares
outstanding
as of 30 Sep-
tember 2023
Fair value per
performance
share in €
2020 fiscal year: Employees 29 February 2024 18.10 938,666 12.95
2020 fiscal year:
Members of the Management Board 29 February 2024 18.10 70,850 12.50
Plan conditions for tranches from 1 April 2021
With the granting of a (virtual) performance share, the participants in the plan
acquire the right to receive (real) Infineon shares when one of the position-dependent
personal investments in Infineon shares has reached a four-year holding period.
The number of real Infineon shares to be transferred depends on the achievement
of targets during the performance period.
The performance period begins on 1 October of the first fiscal year of the perfor-
mance period and ends four years later on 30 September. Performance during the
performance period is measured using the relative total shareholder return (TSR)
financial performance criterion compared to companies in a selected industry peer
group, together with non-financial performance criterion comprising strategy-derived
environmental, social and governance (ESG) objectives. The TSR target accounts
for 80 percent and the ESG targets 20 percent of the overall target achievement. For
tranches from 1 April 2023, the TSR target accounts for 70 percent to 80 percent and
the ESG targets for 20 percent to 30 percent of the overall target achievement. TSR and
the ESG target achievements can be between 0 percent and 150 percent.
133
Infineon | Annual Report 2023
Further information
Combined Management Report
Management Board and Supervisory Board
Notes to the Consolidated Financial Statements
Consolidated Financial Statements
135.
The tranche isgranted on 1 April in the first fiscal year of the performance period
(allocation day). The vesting period begins on the allocation day. In contrast to the
performance period, the vesting period ends four years after the allocation day, i.e.,
on 31 March. At the end of the four-year performance period, the target achievement
is determined.
The final number of performance shares to be allocated after the expiry of the
vesting period is determined by multiplying the number of provisionally allocated
performance shares by the overall target achievement of the two performance criteria
during the performance period. The final allocation of the performance shares
within an LTI tranche may not result in a profit (before tax) of more than 250 percent
of the respective LTI grant amount; above this cap, all performance shares still to
be allocated lapse.
The fair value of the performance shares at the date of allocation was determined by
an external expert using a recognized financial-mathematical method (Monte Carlo
simulation model for the prediction of the share price development and the TSR target
achievements). The fair value of the instruments granted is determined taking into
account future dividends as well as the payment cap.
The following is an overview of the allocations made:
Tranche End of the
waiting period
Average share
price in the
60 trading
days before
the start of the
performance
period in €
Number of
performance
shares
outstanding
as of 30 Sep-
tember 2023
Fair value per
performance
share in €
2023 fiscal year: Employees 31 March 2027 25.00 683,239 32.31
2023 fiscal year:
Members of the Management Board 31 March 2027 25.00 207,343 32.31
2022 fiscal year: Employees 31 March 2026 34.85 464,798 27.63
2022 fiscal year:
Members of the Management Board 31 March 2026 34.85 148,737 27.63
2021 fiscal year: Employees 31 March 2025 22.82 500,510 28.87
2021 fiscal year:
Members of the Management Board 31 March 2025 22.82 178,213 28.87
The development of the performance shares is as follows:
in number of shares (in millions) 2023 2022
Outstanding performance shares at the beginning of the fiscal year 3.2 3.3
Granted 0.9 0.7
Allocated (0.4) (0.3)
Forfeited (0.5) (0.5)
Outstanding performance shares as of the end of the fiscal year 3.2 3.2
Restricted Stock Unit Plan
Under this plan, (virtual) restricted stock units are initially provisionally granted on
1 April (up to the 2020 fiscal year: 1 March) of the fiscal year according to a predeter-
mined LTI grant amount in euros. With the allocation of a (virtual) restricted stock
unit, the plan participants acquire the right to receive a (real) Infineon share after the
expiry of the vesting period, provided that the employees are still employed by Infineon
at this time. The final allocation is made in stages (each representing 25 percent of
the provisionally allocated restricted stock units) after the expiry of the vesting period
of one year following allocation.
The fair value of the restricted stock units at the date of allocation was determined
by an external expert using a recognized financial-mathematical method (Monte Carlo
simulation model for the prediction of share price developments). The fair value of
the instruments granted is determined, taking into account future dividends.
134
Infineon | Annual Report 2023
Further information
Combined Management Report
Management Board and Supervisory Board
Notes to the Consolidated Financial Statements
Consolidated Financial Statements
136.
The following isan overview of the allocations made:
Tranche End of the
waiting period
Price of an
Infineon share
as of the
grant date in €
Number of
restricted
stock units
as of 30 Sep-
tember 2023
Fair value per
restricted
stock unit
in €
2023 fiscal year:
1st tranche 31 March 2024 37.68 920,464 37.34
2nd tranche 31 March 2025 37.68 920,464 36.53
3rd tranche 31 March 2026 37.68 920,464 36.16
4th tranche 31 March 2027 37.68 920,464 35.77
2022 fiscal year:
2nd tranche 31 March 2024 30.99 721,280 30.33
3rd tranche 31 March 2025 30.99 721,280 29.96
4th tranche 31 March 2026 30.99 721,280 29.56
2021 fiscal year:
3rd tranche 31 March 2024 36.16 278,708 35.29
4th tranche 31 March 2025 36.16 278,708 34.87
2020 fiscal year:
4th tranche 29 February 2024 18.62 73,146 17.31
The development of the restricted stock units is as follows:
in number of shares (in millions) 2023 2022
Outstanding restricted stock units at the beginning of the fiscal year 4.3 1.8
Granted 3.7 3.3
Allocated (1.2) (0.5)
Forfeited (0.3) (0.3)
Outstanding restricted stock units as of the end of the fiscal year 6.5 4.3
Costs for share-based payment
The costs for share-based payment amounted to €92 million in the 2023 fiscal year
(2022: €62 million).
23 Other financial commitments
In addition to provisions and liabilities, there were other financial obligations that
were not recognized in the Consolidated Statement of Financial Position. These
resulted, in particular, from legal risks (see note 24, p. 136 ff.) and unconditional
purchase commitments, which are explained in more detail below.
Contracts already entered into for commenced or planned investments in property,
plant and equipment (purchase commitments) as of 30 September 2023 amounted
to €2,921 million (30 September 2022: €2,344 million). Commitments arising from
orders placed for investments in intangible asset projects amount to €1 million as of
30 September 2023 (30 September 2022: €6 million).
Furthermore, Infineon has committed to invest €500 million in the “European Semi-
conductor Manufacturing Company (ESMC) GmbH” in Dresden (Germany), 100 percent
of whose shares are currently held by Taiwan Semiconductor Manufacturing Company
Limited (TSMC). Infineon’s participation will amount to 10 percent.
In the course of its investing activities, Infineon also receives government grants
related to the construction and financing of certain of its manufacturing facilities.
Grants are also received for selected research and development projects, and for
employee development initiatives. Certain grants have been received contingent upon
Infineon complying with particular project-related requirements, such as creating
a specified number of jobs over a defined period of time. From today’s perspective,
Infineon expects to comply with these requirements. Nevertheless, should such
requirements not be met, as of 30 September 2023, a maximum of €290 million
(30 September 2022: €275 million) of subsidies already received could be refundable.
Through certain sales and other agreements, Infineon may be obligated in the normal
course of business to indemnify or compensate its counterparties under certain con-
ditions for warranties, patent infringement or other matters. The maximum amount
of potential future payments under these types of agreements is not predictable with
any degree of certainty since the potential obligations are contingent on events that
may or may not occur in the future and depend on certain facts and circumstances
135
Infineon | Annual Report 2023
Further information
Combined Management Report
Management Board and Supervisory Board
Notes to the Consolidated Financial Statements
Consolidated Financial Statements
137.
specific to eachagreement. Historically, payments made by Infineon under these
types of agreements have not had a material effect on Infineon’s financial condition,
liquidity position and results of operations.
24 Legal risks
Litigation and government inquiries
Smart card chips antitrust litigation
In October 2008, the EU Commission initiated an investigation into the Company and
other manufacturers of chips for smart cards for alleged violations of antitrust laws.
In September 2014, the EU Commission imposed a fine of €83 million on Infineon,
which in July 2020 was reduced to €76.9 million by the General Court of the European
Union.
In July 2019, a direct customer filed a lawsuit against Infineon Technologies UK Limited
and several Renesas entities in London (United Kingdom) relating to the aforemen-
tioned EU antitrust case. The London court dismissed the complaint for being time-
barred. The dismissal was confirmed by the Court of Appeal. The plaintiff filed a further
appeal to the UK Supreme Court. In December 2022, the UK Supreme Court finally
dismissed the complaint.
Proceedings in relation to Qimonda
All significant assets, liabilities and business activities attributable to the memory
business (Memory Products) were carved out from Infineon and transferred to
Qimonda in the form of a contribution in kind with economic effect from 1 May 2006.
Qimonda filed an application at the Munich local court to commence insolvency
proceedings on 23 January 2009. On 1 April 2009, the insolvency proceedings were
formally opened. The insolvency of Qimonda has given rise to various disputes
between the insolvency administrator and Infineon.
Alleged activation of a shell company and liability for impairment of capital
The insolvency administrator filed a request for declaratory judgment in an unspeci-
fied amount against Infineon Technologies AG and, by way of third-party notice,
Infineon Technologies Holding B.V. and Infineon Technologies Investment B.V., at the
Regional Court Munich I in November 2010. This requested that Infineon be deemed
liable to make good the deficit balance of Qimonda as it stood when the insolvency
proceedings with respect to the assets of Qimonda began, i.e., to refund to Qimonda
the difference between the latter’s actual business assets when the insolvency pro-
ceedings began and its share capital (in German: “Unterbilanzhaftung”). The insolvency
administrator contended that the commencement of operating activities by Qimonda
amounted to what is considered in case law to be the activation of a shell company
(in German: “Wirtschaftliche Neugründung”), and that this activation of a shell com-
pany was not disclosed in the correct manner. On 6 March 2012, with respect to
another matter, the German Federal High Court issued a ruling on principle that any
liability resulting from the activation of a shell company only depends on the situa-
tion at the date of the activation of a shell company and not, as asserted by the insol-
vency administrator, on the situation at the date on which insolvency proceedings
are opened.
In addition to the request for declaratory judgment against Infineon in an unspecified
amount, on 14 February 2012 the insolvency administrator also lodged a request for
payment based on an alternative claim (in German: “Hilfsantrag”), as well as making
other additional claims. In conjunction with this alternative claim, the insolvency
administrator has requested the payment of at least €1.71 billion plus interest in con-
nection with the alleged activation of a shell company. On 15 June 2012, the insolvency
administrator increased his request for the payment of 14 February 2012 on the
grounds of activation of a shell company to at least approximately €3.35 billion plus
interest. Furthermore, the insolvency administrator continues to base a substantial
part of his alleged payment claims, as already asserted out of court against Infineon
in August 2011 for an unspecified amount, on liability for impairment of capital (in
German: “Differenzhaftung”). This claim is based on the allegation that, from the
very beginning, the carved-out memory products business had a negative billion
euro value. The insolvency administrator therefore asserts that Infineon is obliged
to make good the difference between this negative value and the lowest issue price
(in German: “geringster Ausgabebetrag”) of the subscribed stock. Additionally, the
insolvency administrator has asserted a claim for repayment of allegedly unjustly
charged consultancy fees in the amount of €10 million in connection with the flotation
of Qimonda.
136
Infineon | Annual Report 2023
Further information
Combined Management Report
Management Board and Supervisory Board
Notes to the Consolidated Financial Statements
Consolidated Financial Statements
138.
The alleged impairmentof capital runs contrary to two valuations prepared as part
of the preparatory documentation for the capital increase by independent auditing
companies, one of which had been engaged by Infineon and the other of which was
acting in the capacity of a court-appointed auditor of contributions in kind and
post-formation acquisitions. The auditing company engaged by Infineon concluded
in its valuation that the business area contributed had a value of several times the
lowest issue price of the shares issued, while the court-appointed auditor of contribu-
tions in kind and post-formation acquisitions confirmed to the court that the lowest
issue price of the shares issued was covered – as legally required – by the value of
the contributions in kind. Additionally, in the course of its defense against the claims
asserted by the insolvency administrator, Infineon has commissioned several expert
opinions, all of which arrived at the same conclusion that the objections raised by
the insolvency administrator against the valuation of the contribution in kind are
not valid.
The legal dispute has, in the meantime, focused on the claims asserted for alleged
lack of value. On 29 August 2013, the court appointed an independent expert to
clarify the valuation issues raised by the insolvency administrator and to address
technical matters.
The legal dispute is being pursued with great effort by both parties, and many
extensive written submissions have already been exchanged between the parties.
Both sides have engaged numerous specialists and experts who are supporting the
respective parties with assessments and opinions.
On 21 September 2018, in consultation with the parties, the independent expert
appointed by the court presented an interim report on his preliminary assessment
of the value of the contribution in kind. The Company is in principle prepared to
conduct discussions about an out-of-court settlement of the legal dispute on the
basis of the interim report.
The parties are exchanging further written submissions. It is not clear at this stage
if the legal dispute can be resolved with an out-of-court settlement, or, if this is not
the case, when a first-instance court decision would be reached.
Residual liability of Infineon as former shareholder of
Qimonda Dresden GmbH Co. OHG
Infineon was a shareholder with personal liability of Qimonda Dresden until the
carve-out of the memory business; as a result, certain long-standing creditors have
residual liability claims against Infineon. These claims can only be exercised by the
insolvency administrator acting in the name of the creditors concerned. In the mean-
time, settlements have been concluded with most of the major liability creditors.
Liabilities, provisions and contingent liabilities relating to Qimonda
Infineon recognizes provisions and liabilities for such obligations and risks, which it
assesses at the end of each reporting period, are more likely than not to be incurred
(that is where, from Infineon’s perspective at the end of each reporting period, the
probability of having to settle an obligation or risk is greater than the probability of
not having to) and the obligation or risk can be estimated with reasonable accuracy
at this time.
As described above, Infineon faces certain risks in connection with the insolvency
proceedings relating to the assets of Qimonda and that entity’s subsidiaries. In con-
sideration of the interim report from the court-appointed expert, Infineon recorded
provisions relating to Qimonda of €212 million in total as of 30 September 2023. This
comprises mainly provisions for the still pending legal dispute over the alleged acti-
vation of a shell company and liability for impairment of capital, including legal costs.
As of 30 September 2022, provisions relating to Qimonda amounted to €211 million.
137
Infineon | Annual Report 2023
Further information
Combined Management Report
Management Board and Supervisory Board
Notes to the Consolidated Financial Statements
Consolidated Financial Statements
139.
There can beno certainty that the provisions recorded for Qimonda will be sufficient
to cover all of the liabilities that could ultimately be incurred in relation to the insol-
vency of Qimonda and, in particular, the matters discussed above. In addition, it is
possible that liabilities and risks materialize that are currently considered to be unlikely
to do so and, accordingly, represent contingent liabilities that are not included in
provisions. Should the alleged claims relating to the activation of a shell company and
liability for impairment of capital prove to be valid, substantial financial obligations
above the provisions already recorded could arise for Infineon, which could have an
adverse effect on its business and its financial condition, liquidity position and results
of operations.
Other
Infineon is also involved in various other legal disputes and proceedings in connection
with its existing or previous business activities. These can relate, in particular, to
products, services, patents, export control and environmental issues and other matters.
Based on its current knowledge, Infineon does not believe that the ultimate resolution
of these other pending legal disputes and proceedings will have a material adverse
effect on Infineon’s financial condition, liquidity position and results of operations.
However, future revisions to this assessment cannot be ruled out, and any reassess-
ment of the miscellaneous legal disputes and proceedings could have a material
adverse effect on the financial condition, liquidity position and results of operations,
particularly in the period in which reassessment is made.
Furthermore, in connection with its existing or previous business operations, Infineon
is also exposed to numerous legal risks, which until now have not resulted in legal
disputes. These include risks related to product liability, environment, capital market,
anti-corruption, competition and antitrust legislation as well as export control and
other compliance regulations. Claims could also be made against Infineon in connec-
tion with these matters in the event of breaches of law committed by individual
employees or third parties.
As part of an audit finding relating to the tax treatment of losses from the repurchase
of convertible bonds in the 2011, 2012 and 2014 fiscal years, there were contingent
liabilities of €63 million as of 30 September 2023 (2022: €63 million) for withholding
tax on capital gains to be paid in arrears as well as corporate income tax and trade
tax of €3 million (2022: €3 million), in each case plus interest. Suspension of enforce-
ment was granted as part of the ongoing appeal proceedings for 2011 and 2012. After
completion of the current tax audit, suspension of enforcement will also be applied
for 2014 and the appeal proceedings will be extended accordingly. Infineon expects
that there is a sufficient degree of likelihood of winning any potential appeal or
legal action.
Provisions and contingent liabilities for legal proceedings
and other uncertain legal issues
Provisions relating to legal proceedings and other uncertain legal issues are recorded
when it is probable that a liability has been incurred and the associated amount can
be reasonably estimated. To the extent that liabilities arising from legal disputes and
other uncertain legal positions are not probable or cannot be reliably estimated, then
they qualify as contingent liabilities. Any potential liability is reviewed again as soon
as additional information becomes available and the estimates are revised if necessary.
Provisions with respect to these matters are subject to future developments or changes
in circumstances in each of the matters, which could have a material adverse effect
on Infineon’s financial condition, liquidity position and results of operations.
138
Infineon | Annual Report 2023
Further information
Combined Management Report
Management Board and Supervisory Board
Notes to the Consolidated Financial Statements
Consolidated Financial Statements
140.
A settlement oradverse judicial decision in any of the matters described above
could result in significant financial liabilities for Infineon and other adverse effects,
and these in turn could have a material adverse effect on its business and financial
condition, liquidity position and results of operations. Irrespective of the validity
of the allegations and the success of the aforementioned claims and other matters
described above, Infineon could incur significant costs in the defense of these matters.
25 Transactions with related companies and persons
Infineon has transactions in the normal course of business with joint ventures, asso-
ciates and other related companies (collectively “related companies”). The related
companies are disclosed in note 30, p. 165 ff.. Related persons are persons in key
management positions, in particular members of the Management and Supervisory
Board (see note 30, p. 162 f.) and their close relatives (collectively “related persons”).
Related companies
Infineon purchases certain raw materials and services from and sells certain products
and services to related companies.
Related companies receivables and payables as of 30 September 2023 and 2022
consisted of the following:
€ in millions
30 September 2023 30 September 2022
Joint
ventures
Associates Other
related
companies
Joint
ventures
Associates Other
related
companies
Trade and other receivables 16 3 1 8 2 –
Financial receivables 12 – 1 35 – –
Trade and other payables 30 – 2 8 – 2
Financial payables – – 1 – – 1
Sales and service charges to and products and services received from related
companies in the 2023 and 2022 fiscal years consisted of the following:
€ in millions
2023 2022
Joint
ventures
Associates Other
related
companies
Joint
ventures
Associates Other
related
companies
Sales and service charges 132 29 1 115 21 1
Products and
services received 120 – 21 100 – 19
As of 30 September 2023, sales and services relationships with related companies
resulted in purchase commitments of €36 million (30 September 2022: €37 million).
139
Infineon | Annual Report 2023
Further information
Combined Management Report
Management Board and Supervisory Board
Notes to the Consolidated Financial Statements
Consolidated Financial Statements
141.
Related persons
Total remunerationof the Management Board and Supervisory Board
according to IAS 24.17
The members of the Management Board and Supervisory Board active in the 2023
and 2022 fiscal years received the following remuneration for their activities in
accordance with IAS 24.17:
Change
€ in millions 2023 2022 absolute in %
Expense for short-term benefits1 9 11 (2) (18)
Expense for share-based payment 3 2 1 50
Expense from post-employment benefits 1 1 – –
Expense for termination benefits2 – 11 (11) –––
Total remuneration of the Management Board 13 25 (12) (48)
Total remuneration of the Supervisory Board3 3 3 – –
Total remuneration of the executive bodies 16 28 (12) (43)
1 The expense includes the fixed remuneration, including fringe benefits and the one-year variable remuneration (STI).
2
Both Dr. Reinhard Ploss and Dr. Helmut Gassel resigned from the Management Board of Infineon Technologies AG in the 2022 fiscal year.
Their employment contracts continued until 31 December 2022 and 30 September 2022, respectively. For this period, Dr. Reinhard Ploss
and Dr. Helmut Gassel were entitled to remuneration in full. In addition, Dr. Helmut Gassel was granted a severance payment and agreed
to a post-contractual non-competition clause that runs until November 2023, for which Dr. Helmut Gassel received compensation.
3 Employee representatives on the Supervisory Board who are employed by Infineon also receive a salary for their activities as employees.
Total remuneration of the Management Board and Supervisory Board
pursuant to section 314, paragraph 1, no. 6 in conjunction with
section 315e, paragraph 1, HGB
The total remuneration of the members of the Management Board for their active
service pursuant to section 314, paragraph 1, no. 6 in conjunction with section 315e,
paragraph 1, HGB amounted to €9 million (2022: €15 million). This includes a long-term
incentive (LTI) in the form of a performance share plan (see note 22, p. 133 f.). A total
of 193,373 (virtual) performance shares (2022: 148,737) were provisionally allocated
to the members of the Management Board in the 2023 fiscal year. The fair value of
these provisionally allocated (virtual) performance shares amounted to €6 million
(2022: €4 million).
The total remuneration of the members of the Supervisory Board in the 2023 fiscal year
amounted to €3 million (2022: €3 million).
Former members of the Management Board received payments of €7 million in the
2023 fiscal year (2022: €3 million).
As of 30 September 2023, pension obligations for former members of the Management
Board amounted to €63 million (30 September 2022: €63 million).
In the 2023 and 2022 fiscal years, there were no significant transactions between
Infineon and related persons that fell outside of the scope of the existing employ-
ment, service or appointment terms, or the contractual arrangements for their
remuneration.
Constanze Hufenbecher resigned from her position on the Management Board with
effect from 31 October 2023; her contract of employment will end on 14 April 2024.
The Supervisory Board appointed Elke Reichart to succeed Constanze Hufenbecher
with effect from 1 November 2023 until 31 October 2026.
With regard to the disclosures on the individual remuneration of the members of the
Management Board and Supervisory Board pursuant to section 162 of the German
Stock Corporation Act (AktG), reference is made to the Remuneration Report prepared
according to stock corporation law, which can be found under the following link:
www.infineon.com/remuneration-report
The references to the Remuneration Report were not audited as part of the audit
of the financial statements. The Remuneration Report was subjected to a separate
substantive audit by the auditor in accordance with IDW PS 490. This audit also
includes the formal audit required by section 162, paragraph 3 of the German Stock
Corporation Act (AktG).
140
Infineon | Annual Report 2023
Further information
Combined Management Report
Management Board and Supervisory Board
Notes to the Consolidated Financial Statements
Consolidated Financial Statements
142.
26 Supplemental cashflow information
Cash and cash equivalents reported as of 30 September 2023 and 2022 totaling
€1,820 million and €1,438 million, respectively, included €50 million and €69 million,
respectively, which were subject to legal transfer restrictions and so were not avail-
able for general use by Infineon. This amount represented cash and cash equivalents
of consolidated companies located in countries where the transfer of cash is legally
restricted, for example, China.
The reconciliation below shows changes in those financial liabilities and hedging
transactions for which payments received and made are shown under cash flows from
financing activities in the statement of cash flows.
€ in millions
Starting balance Cash-effective
changes
Non-cash-effective changes Carrying amount
Acquisitions Currency effects New leases Other changes
The 2023 fiscal year
Short-term and long-term financial debt 5,662 (753) – (182) – 6 4,733
Related party financial payables 1 – – – – – 1
Current and non-current lease liabilities 386 (86) – (17) 100 (2) 381
Total 6,049 (839) – (199) 100 4 5,115
The 2022 fiscal year
Short-term and long-term financial debt 6,585 (1,393) 3 461 – 6 5,662
Related party financial payables 2 (1) – – – – 1
Current and non-current lease liabilities 331 (84) – 17 122 – 386
Total 6,918 (1,478) 3 478 122 6 6,049
141
Infineon | Annual Report 2023
Further information
Combined Management Report
Management Board and Supervisory Board
Notes to the Consolidated Financial Statements
Consolidated Financial Statements
143.
27 Additional disclosureson financial instruments
Categories of financial instruments
The following tables present the carrying amounts and the fair values of financial
instruments by their respective classes and a breakdown by category of financial
instruments as of 30 September 2023 and 2022 according to IFRS 9:
€ in millions
Carrying amount Categories of financial assets Not assignable to any
IFRS 9 measurement
category
Fair value
At fair value through
profit or loss
At amortized cost Designated hedging
instruments
(cash flow hedges)
As of 30 September 2023
Current assets:
Cash and cash equivalents 1,820 1,169 651 – 1,820
Financial investments 1,770 1,770 – – 1,770
Trade receivables 1,991 – 1,991 – 1,991
Other current assets 363 2 353 8 363
Non-current assets:
Other non-current assets 208 113 95 – 208
Total 6,152 3,054 3,090 8 6,152
As of 30 September 2022
Current assets:
Cash and cash equivalents 1,438 1,045 393 – 1,438
Financial investments 2,279 2,039 240 – 2,279
Trade receivables 1,887 – 1,887 – 1,887
Other current assets1 93 5 88 – 93
Non-current assets:
Other non-current assets1 205 108 97 – 205
Total 5,902 3,197 2,705 – 5,902
1 The presentation of grants receivables as well as of some of the advance payments made was corrected in the 2023 fiscal year. These are now no longer reported under current or non-current financial assets. The previous year’s figures have been adjusted to improve comparability.
142
Infineon | Annual Report 2023
Further information
Combined Management Report
Management Board and Supervisory Board
Notes to the Consolidated Financial Statements
Consolidated Financial Statements
144.
€ in millions
Carryingamount Categories of financial assets Not assignable to any IFRS 9
measurement category
Fair value
At fair value through
profit or loss
Other
financial liabilities
(amortized cost)
Designated hedging
instruments
(cash flow hedges)
Others
As of 30 September 2023
Current liabilities:
Short-term financial debt and current portion
of long-term financial debt 330 – 330 – – 333
Trade payables 2,765 – 2,765 – – 2,765
Current lease liabilities 72 – – – 72 –
Other current liabilities 993 4 987 2 – 993
Non-current liabilities:
Long-term financial debt 4,403 – 4,403 – – 3,915
Non-current lease liabilities 309 – – – 309 –
Other non-current liabilities 130 – 130 – – 130
Total 9,002 4 8,615 2 381 8,136
As of 30 September 2022
Current liabilities:
Short-term financial debt and current portion
of long-term financial debt 752 – 752 – – 742
Trade payables 2,260 – 2,260 – – 2,260
Current lease liabilities 76 – – – 76 –
Other current liabilities 975 22 950 3 – 975
Non-current liabilities:
Long-term financial debt 4,910 – 4,911 – – 4,333
Non-current lease liabilities 310 – – – 310 –
Other non-current liabilities 67 – 67 – – 67
Total 9,350 22 8,940 3 386 8,377
143
Infineon | Annual Report 2023
Further information
Combined Management Report
Management Board and Supervisory Board
Notes to the Consolidated Financial Statements
Consolidated Financial Statements
145.
Within financial assetsmeasured at amortized cost, financial assets with a
carrying amount of €13 million (previous year: €14 million) were included as of
30 September 2023, which Infineon has pledged mainly as collateral for rental
liabilities.
In the 2023 and 2022 fiscal years, there were no reclassifications between the
categories of financial instruments.
Disclosures about fair value
Financial instruments at fair value
Financial instruments measured at fair value are allocated to the following measure-
ment levels in accordance with IFRS 13. The allocation to the different levels is
based on the market proximity of the valuation parameters used in the determination
of the fair values:
›
Level 1:
quoted prices (unadjusted) in active markets for identical assets and
liabilities,
›
Level 2: valuation parameters whose prices are not considered in level 1, but which
can be observed either directly or indirectly for the asset or liability,
›
Level 3: valuation parameters for assets and liabilities that are not based on
observable market data.
The allocation to the levels as of 30 September 2023 and 2022 was as follows:
€ in millions
Fair value Fair value by category
Level 1 Level 2 Level 3
30 September 2023
Current assets:
Cash and cash equivalents 1,169 1,169 – –
Financial investments 1,770 1,770 – –
Other current assets 10 – 2 8
Non-current assets:
Other non-current assets 113 103 – 10
Total 3,062 3,042 2 18
Current liabilities:
Other current liabilities 6 – 5 1
Total 6 – 5 1
30 September 2022
Current assets:
Cash and cash equivalents 1,045 1,045 – –
Financial investments 2,039 2,039 – –
Other current assets 5 – 5 –
Non-current assets:
Other non-current assets 108 94 – 14
Total 3,197 3,178 5 14
Current liabilities:
Other current liabilities 25 – 25 –
Total 25 – 25 –
Cash equivalents and financial investments included investments in money market
funds and investment funds (level 1).
144
Infineon | Annual Report 2023
Further information
Combined Management Report
Management Board and Supervisory Board
Notes to the Consolidated Financial Statements
Consolidated Financial Statements
146.
Other current assetsand other current liabilities contained derivative financial instru-
ments (including cash flow hedges). Their fair value was determined by discounting
future cash flows according to the discounted cash flow method. Where possible,
valuation parameters observed on the reporting date in the relevant markets (such
as currency rates, interest rates, or commodity prices) drawn from reliable external
market data providers were used (level 2). Where fair values are determined on the
basis of non-observable factors, these are assigned to level 3.
The determination of the fair values of the deal contingent forward and deal contingent
option designated as cash flow hedges (see “Derivative financial instruments and
hedging activities”, p. 147 ff.) were determined on the basis of factors observable in
markets such as forward prices, interest rate curves and volatilities. In addition, the
assumption about the date of completion of the acquisition was taken into account
as a non-observable factor (level 3).
Other non-current assets included equity investments and investments in funds. Where
these are traded on an active market, the fair value was based on the actual market
price (level 1). In addition, other non-current assets included derivative financial
instruments whose fair value was calculated using recognized financial-mathematical
models, with only observable input parameters included in the measurement (level 2).
For equity investments where no market price from an active market is available, the
fair value was determined by considering existing contractual arrangements based
on externally observable dividend policy (level 3).
The following table shows the reconciliation of financial instruments classified as
level 3 (before tax):
€ in millions
Deal contingent
option
Deal contingent
forward
Equity
investments
1 October 2021 – – 16
Unrealized losses recognized in profit or loss1 – – (2)
30 September 2022 – – 14
Acquisitions (including additions) 13 – –
Unrealized losses recognized in profit or loss1 – – (4)
Losses in equity (5) (1) –
30 September 2023 8 (1) 10
1 This relates to gains recognized in financial income or losses recognized in financial expenses.
A hypothetical change in the material on the market non-observable valuation
parameters at the balance sheet date of ± 10 percent or one month would have resulted
in a theoretical reduction in fair values of €1 million or an increase of €1 million
(previous year: both €1 million).
145
Infineon | Annual Report 2023
Further information
Combined Management Report
Management Board and Supervisory Board
Notes to the Consolidated Financial Statements
Consolidated Financial Statements
147.
Financial instruments atamortized cost
For assets allocated to the category “At amortized cost”, it is assumed that the
fair values correspond to their carrying amounts. The same assumption applies to
liabilities resulting from trade payables and other current liabilities categorized as
“Other financial liabilities (amortized cost)”.
The fair value of current and non-current financial debt that is measured at amortized
cost is based either on quoted prices as of the reporting date (level 1) or is determined
based on expected future cash flows discounted using a current market interest rate
(level 2).
The allocation to the levels of current and non-current financial debt measured at
amortized cost as of 30 September 2023 and 2022 was as follows:
€ in millions
Fair value Fair value by category
Level 1 Level 2 Level 3
30 September 2023
Short-term financial debt and current portion
of long-term financial debt 333 – 333 –
Long-term financial debt 3,915 2,370 1,545 –
Total 4,248 2,370 1,878 –
30 September 2022
Short-term financial debt and current portion
of long-term financial debt 742 739 3 –
Long-term financial debt 4,333 2,353 1,980 –
Total 5,075 3,092 1,983 –
Gains and losses in relation to financial instruments
The net gain or loss on financial instruments (including interest income and expense)
in the Consolidated Statement of Profit or Loss amounted to the following as of
30 September 2023 and 2022:
Change
€ in millions 2023 2022 absolute in %
Financial assets measured at amortized cost (57) 255 (312) –––
therein interest income 42 11 31 +++
therein impairment losses 1 1 – –
therein currency effects (101) 243 (344) –––
therein other financial expenses 1 – 1 +++
Financial assets measured at fair value
through profit and loss (3) (13) 10 77
Financial liabilities measured at amortized cost 51 (544) 595 +++
therein interest expenses (126) (129) 3 2
therein currency effects 177 (414) 591 +++
therein other financial expenses – (1) 1 +++
Financial assets or liabilities measured at fair value
through profit and loss – held for trading (17) 118 (135) –––
therein currency effects (17) 118 (135) –––
Total (26) (184) 158 86
Interest expense on financial liabilities measured at amortized cost mainly included
interest on financial debt and effects from using the effective interest method.
146
Infineon | Annual Report 2023
Further information
Combined Management Report
Management Board and Supervisory Board
Notes to the Consolidated Financial Statements
Consolidated Financial Statements
148.
Infineon does notnet financial instruments. The Company conducts derivative
transactions according to the global netting agreement (Master Agreement) of the
International Swaps and Derivatives Association (ISDA) and other comparable
national framework agreements. Under the terms of these agreements, any netting
arising from the occurrence of certain future events would have had no material
effect on the balance sheet presentation of these financial instruments.
Derivative financial instruments and hedging activities
Infineon holds derivative financial instruments exclusively for hedging purposes. This
includes the use of forward exchange contracts and interest- and commodity swaps.
The objective is to reduce the impact of the exchange rate, interest rate and commodity
price fluctuations on future net cash flows.
Derivative financial instruments not designated as a hedging relationship
The nominal values and fair values of Infineon’s derivative instruments as of
30 September 2023 and 2022 that were not designated as cash flow hedges were
as follows:
€ in millions
30 September 2023 30 September 2022
Nominal
value
Fair value Nominal
value
Fair value
Forward exchange contracts sold 191 (4) 420 (18)
Forward exchange contracts purchased 384 2 337 1
Total (2) (17)
Derivative financial instruments designated as a hedging relationship
As of 30 September 2023 and 2022, Infineon held the following instruments, which
were designated as cash flow hedges and were used to hedge against foreign
exchange and commodity price changes:
Short term
30 September 2023
Hedging of foreign exchange risks
Deal contingent forward
Nominal value (US dollar in millions) 415
Average forward rate (euro/US dollar) 1.0574
Deal contingent option
Nominal value (US dollar in millions) 415
Average forward rate (euro/US dollar) 1.0575
Hedging of other risks
Commodity swaps
Nominal value (€ in millions) 24
Average price (US dollar/ounce) 2,008
30 September 2022
Hedging of other risks
Commodity swaps
Nominal value (€ in millions) 51
Average price (US dollar/ounce) 1,797
In order to hedge the foreign currency risks attributable to the purchase price obliga-
tion arising from the acquisition of GaN Systems (see note 3, p. 107 f.), a contingent
(transaction-dependent) euro/US dollar foreign currency forward (deal contingent
forward) and a contingent (transaction-dependent) euro/US dollar foreign currency
option (deal contingent option), each with a nominal value of US$415 million, were con-
cluded on 2 March 2023 and were accounted for as cash flow hedges. At the inception
of the hedging transaction, and on a continuing basis, Infineon verifies the existence
of an economic relationship between the hedged item and the hedging instrument
(critical term). For the abovementioned hedging transactions, the hedge ratio was 1:1.
147
Infineon | Annual Report 2023
Further information
Combined Management Report
Management Board and Supervisory Board
Notes to the Consolidated Financial Statements
Consolidated Financial Statements
149.
As part ofthe hedging, only the spot component of the deal contingent forward and the
intrinsic value of the deal contingent option were designated as hedging instruments.
The forward elements of the deal contingent forward, and the time value of the deal
contingent option, each containing a contingency component, are excluded from the
designation of hedging instrument and were considered in the recognition of costs
of hedging and disclosed in equity in a reserve for the costs of hedging, to the extent
that they can be attributed to the hedged item. No material ineffective elements arising
from the deal contingent forward or the deal contingent option were recognized in
the Consolidated Statement of Profit or Loss in the 2023 fiscal year. Any ineffectiveness
was attributable to changes in the expected timing of the payment of the purchase
price in US dollars as well as the contingency component contained within the hedg-
ing instruments and the credit default risk. With the completion of the acquisition
of GaN Systems on 24 October 2023, the deal contingent forward and deal contingent
option became due and the hedge was closed. The effective portion of the hedge
and the cumulative amounts recognized in the reserve for the costs of hedging were
reclassified as costs of the acquisition of GaN Systems and were therefore taken into
account in determining the goodwill arising from the transaction.
To hedge the price risks of highly probable gold purchases in the 2024 fiscal year,
Infineon entered into swaps, which are designated as cash flow hedges. The designated
hedged items and the hedging instruments were subject to the same risk. The eco-
nomic connection was proven by means of a regression analysis. Due to the execu-
tion of only highly effective hedging transactions, Infineon assumes that significant
ineffective elements will normally not be generated. Infineon applies a hedging ratio
of 1:1. Ineffectiveness can be caused mainly by the impact of the credit risks arising
from the counterparty and Infineon on the fair value of the swap that is not reflected
in the change in the fair value of hedged cash flows attributable to changes in raw
material prices. As in the previous year, no hedge ineffectiveness was recorded in the
Consolidated Statement of Profit or Loss for these hedging relationships. As in the
previous year, no gains or losses were transferred from other reserves to profit or loss
as a result of cash flow hedges for future raw material purchases being canceled
following the decision that the occurrence of the hedged transaction had become
unlikely.
Effects from derivative financial instruments designated
as a hedging relationship
The amounts relating to positions that were designated as hedged items as of
30 September 2023 and 2022 are shown in the table below.
€ in millions
Change in the value
of the hedged item
used to determine
ineffectiveness
Hedge reserve
(before taxes)
Cost of
hedging reserve
(before taxes)
30 September 2023
Hedging of foreign exchange risk
Deal contingent forward 1 (1) –
Deal contingent option 5 – (5)
Hedging of commodity price risks 1 (1) –
Total (2) (5)
30 September 2022
Hedging of commodity price risks 2 (2) –
Total (2) –
In the 2023 and 2022 fiscal years, no balances remained in other comprehensive
income for which hedge accounting was no longer applied.
148
Infineon | Annual Report 2023
Further information
Combined Management Report
Management Board and Supervisory Board
Notes to the Consolidated Financial Statements
Consolidated Financial Statements
150.
The relevant amountsof the derivative financial instruments designated as hedging
instruments as of 30 September 2023 and 2022 (before taxes) were as follows:
€ in millions
Carrying amount Changes in fair value
for the measurement
of the ineffectiveness
in the reporting period
Changes in fair value
of the hedging instrument
recognized in other
comprehensive income
Changes in fair value
of cost of hedging
recognized in other
comprehensive income
Amount reclassified
from the hedge reserve
to the cost of
non-financial assets
Line item of the Statement
of Financial Position
or the Statement of
Profit or Loss affected
by the reclassification
30 September 2023
Other current assets:
Hedging of foreign exchange risks
Deal contingent option 8 5 – (5)
Other current liabilities:
Hedging of foreign exchange risks
Deal contingent forward 1 1 (1) –
Hedging of commodity price risks 1 1 (1) 1 Inventories
Total 7 (2) (5) 1
30 September 2022
Other current liabilities:
Hedging of commodity price risks 3 (2) (2) – – Inventories
Total (2) (2) – –
149
Infineon | Annual Report 2023
Further information
Combined Management Report
Management Board and Supervisory Board
Notes to the Consolidated Financial Statements
Consolidated Financial Statements
151.
The following tableshows the reconciliation for the reserve for cash flow hedges
(before taxes) by risk category:
€ in millions
Hedging of
foreign
exchange
risks
Hedging of
interest risks
Hedging of
commodity
price risks
Total
1 October 2021 – (49) (1) (50)
Change in fair value – – (2) (2)
Amount reclassified to Statement
of Profit or Loss – 8 – 8
30 September 2022 – (41) (3) (44)
Change in fair value (6) – 3 (3)
Amount reclassified to Statement
of Profit or Loss – 7 – 7
Amount reclassified to the
cost of non-financial items – – (1) (1)
30 September 2023 (6) (34) (1) (41)
28 Financial risk management
Infineon’s activities are exposed to a variety of financial risks: market risk (including
foreign exchange risk, interest rate risk and price risk), credit risk, financing and
liquidity risk. Infineon’s financial risk management seeks to minimize potential
adverse effects on its profitability and liquidity. Infineon uses derivative financial
instruments to hedge certain risks to which it is exposed. Financial risk management
is undertaken by the central Finance Treasury (FT) department in accordance
with policies approved by the Chief Financial Officer. The FT department identifies,
evaluates and hedges financial risks in close cooperation with the operating units.
The FT department’s policies contain principles for overall risk management as well
as guidance covering specific areas such as foreign exchange risk, interest rate risk,
credit risk, the use of derivative and non-derivative financial instruments, and the
investment of excess liquidity.
Developments in cyclical market and segment risks as well as geopolitical risks are
dynamic and can have direct and indirect effects on financial risks. The course of
events and their impact on Infineon’s risk position is continually monitored and
taken into account in the methods, models and processes used to control financial
risks. Possible longer-term effects on Infineon and the associated volatility in the
financial markets cannot actually be estimated more precisely.
Market risk
Market risk is defined as the risk of losses resulting from adverse changes in the
market prices of financial instruments, including those related to foreign exchange
rates, interest rates and other price risks.
Infineon is exposed to various market risks in the ordinary course of business, primar-
ily resulting from changes in foreign exchange rates and interest rates. Infineon enters
into a range of derivative financial transactions with various counterparties to limit
such risks. Derivative instruments are used only for hedging purposes and not for
trading or speculative purposes.
Foreign exchange risk
Foreign exchange risk within the meaning of IFRS 7 is the risk arising from changes
to foreign exchange rates. Accordingly, foreign exchange risks are associated with
financial instruments that are denominated in a foreign currency that does not
correspond to the functional currency, and the foreign currency represents the
relevant risk variable. Risks arising from the translation into Infineon’s reporting
currency are not risks within the meaning of IFRS 7.
150
Infineon | Annual Report 2023
Further information
Combined Management Report
Management Board and Supervisory Board
Notes to the Consolidated Financial Statements
Consolidated Financial Statements
152.
Although Infineon preparesthe Consolidated Financial Statements in euros, a varying
but significant portion of its revenue, as well as cost of goods sold, research and
development and product distribution costs, are denominated in currencies other
than the euro, primarily the US dollar. Fluctuations in the exchange rates of these
currencies compared to the euro had an effect on the results of Infineon in the 2023
and 2022 fiscal years.
The Management Board has established policies that require Infineon’s individual
legal entities to manage the foreign exchange risk with respect to their functional
currency. Group entities prepare a monthly rolling cash flow forecast by currency
in order to determine foreign exchange risks. The net foreign exchange positions
determined in these forecasts are required to be hedged, usually by entering into
internal hedging contracts. Infineon’s policy with respect to limiting short-term
foreign currency exposure is to hedge at least 75 percent of its estimated net cash
flow for the following two months, at least 50 percent of its estimated net cash flow
for the third month and, depending on the nature of the underlying transactions,
a certain additional portion for the periods thereafter. Part of the foreign currency
risk cannot be mitigated due to differences between actual and forecasted amounts.
Infineon calculates this remaining risk based on net cash flows considering items
in the Statement of Financial Position, actual orders received or placed and all other
planned cash receipts and payments.
In order to hedge the foreign currency risks arising from the purchase price obligation
arising from the acquisition of GaN Systems, a deal contingent forward and a deal
contingent option were concluded by Infineon in the 2023 fiscal year and were
accounted for as cash flow hedges (see note 27, p. 145).
For the net result related to foreign currency hedging transactions and foreign currency
transactions included within profit (loss) for the period, see note 27. p. 142 ff.
Foreign exchange risk at Infineon arises predominantly from main foreign currency
positions. The following table shows the value of the net risk position as of
30 September 2023 and 2022:
€ in millions
30 Septem-
ber 2023
30 Septem-
ber 2022
Euro/US dollar 187 (292)
Euro/Japanese yen (171) (131)
Euro/Singapore dollar (47) (82)
Euro/Malaysian ringgit (104) (106)
Euro/British pound – (7)
Financial position exposure (135) (618)
Euro/US dollar (101) (330)
Euro/Japanese yen 129 82
Euro/Singapore dollar 53 50
Euro/Malaysian ringgit 107 102
Euro/British pound 5 5
Forward exchange contracts 193 (91)
Net risk position 58 (709)
The following table shows the effects on profit or loss for the 2023 and 2022 fiscal years
of a ±10 percent shift in exchange rates. The assumed exchange rate changes relate
only to financial instruments within the meaning of IAS 32.
€ in millions
Profit or Loss Equity
plus 10% minus 10% plus 10% minus 10%
30 September 2023 (9) (2) (44) 72
Euro/US dollar (12) 2 (44) 72
Euro/Japanese yen 4 (5) – –
Euro/Singapore dollar (1) 1 – –
30 September 2022 65 (79) – –
Euro/US dollar 57 (69) – –
Euro/Japanese yen 5 (6) – –
Euro/Singapore dollar 3 (4) – –
151
Infineon | Annual Report 2023
Further information
Combined Management Report
Management Board and Supervisory Board
Notes to the Consolidated Financial Statements
Consolidated Financial Statements
153.
Interest rate risk
Inaccordance with IFRS 7, interest rate risk is defined as the risk that the fair value
or future cash flows of a financial instrument will fluctuate because of changes in
interest rates.
Infineon is exposed to interest rate risk through its financial investment instruments
and financial debt resulting from bond issuances and debt financing. Due to the
cyclical nature of its core business and the need to maintain high operational flexibil-
ity, Infineon holds a relatively high level of liquid financial assets that are invested
in short-term fixed-interest instruments. These financial assets generally are invested
with a contract duration of between one day and twelve months maturity at interest
rates achievable in the short-term. The associated interest rate risk is compensated
to a certain extent by financial liabilities, which generally have fixed interest rates.
To reduce the net remaining risks caused by changes in interest rates, Infineon is able
to make use of interest rate derivatives in order to align the fixed interest periods of
assets and liabilities.
IFRS 7 requires a sensitivity analysis showing the effect of possible changes in market
interest rates on profit or loss. Infineon prepares this using the iteration method.
Changes in market interest rates affect Infineon’s interest income and expenses from
variable-yield financial instruments as well as from fixed-yield financial instruments
that were measured at fair value through profit or loss.
The following table shows the effects on profit or loss for the 2023 and 2022 fiscal years
of a ±100 basis points shift in market interest rates:
€ in millions
Nominal
value
Profit or loss
plus 100
basis points
minus 100
basis points
30 September 2023 2,940 29 (29)
Variable-interest financial assets 2,940 29 (29)
30 September 2022 3,084 31 (31)
Variable-interest financial assets 3,084 31 (31)
Other price risk
According to IFRS 7, other price risk is defined as the risk that the fair value or future
cash flows of a financial instrument could fluctuate because of changes in market prices
(other than those arising from interest rate risk or exchange rate risk), irrespective
of whether those changes are caused by factors specific to the individual financial
instrument or its issuer, or by factors affecting all similar financial instruments traded
in the market.
In the 2023 and 2022 fiscal years, Infineon held financial instruments that were
exposed to market price risks. A change in the relevant market prices would have had
no significant impact on the results of the 2023 and 2022 fiscal years.
Additionally, Infineon is exposed to price risks with respect to raw materials upon
which it is dependent. Infineon seeks to minimize these risks through its procure-
ment policy (including the use of multiple sources, where possible) and its operating
procedures. In line with these measures, Infineon concluded additional financial
derivative contracts for certain commodity supplies (gold) for the following fiscal year
in order to mitigate the remaining risk arising from the fluctuation of commodity
prices (see note 27, p. 147).
152
Infineon | Annual Report 2023
Further information
Combined Management Report
Management Board and Supervisory Board
Notes to the Consolidated Financial Statements
Consolidated Financial Statements
154.
The following tablepresents the effect on equity of a change in the relevant market
prices by ±10 percent as of 30 September 2023 and 2022.
€ in millions
Nominal
value
Equity
plus 10% minus 10%
30 September 2023
Commodity swaps 24 2 (2)
30 September 2022
Commodity swaps 51 5 (5)
Credit risk
Credit risk arises when a customer or other counterparty of a financial instrument
fails to discharge its contractual obligations. Infineon is exposed to this risk as a con-
sequence of its ongoing operations, its financial investments and certain financing
activities. Infineon’s credit risk arises primarily from cash and cash equivalents, finan-
cial investments, trade receivables and derivative financial instruments. Excluding
the impact of any collateral received, in the case of financial investments, cash and
cash equivalents, trade receivables, and financial assets measured at amortized cost,
the carrying amount corresponds to the maximum credit risk.
Foreign exchange hedging contracts, as well as the investment of liquid assets in cash
equivalents and financial investments, are entered into with major financial institu-
tions worldwide that have high credit ratings. Infineon assesses the creditworthiness
of banks using a methodology that establishes investment limits for individual banks
that are updated on a daily basis according to current external ratings and credit
default swap premiums. Possible breaches of stipulated investment thresholds result
in immediate notification and the requirement to reduce the risk. This methodology
is also used to identify a significant increase in credit risk in the context of the recog-
nition of expected credit losses within the meaning of IFRS 9 at the balance sheet date.
Infineon applies the general impairment model in accordance with IFRS 9 for cash and
cash equivalents as well as financial investments. Since Infineon invests exclusively
in high-quality financial assets from issuers with a rating of at least investment grade
in order to minimize default risk, Infineon assumes that its financial assets carry low
credit risk arising from the creditworthiness of its contract parties, so that any impair-
ment loss recorded at first-time recognition is limited to the twelve-month expected
credit losses. Infineon considers low credit risk to be an internal credit rating “Holding
Quality 1”. A change in the internal rating from “Holding Quality 1” to “Holding Qual-
ity 0” indicates a significant increase in credit risk. The impairment is calculated using
a weighted-probability method. This impairment is calculated as a measure of the
probability of default based on the exposure at the balance sheet date, the loss ratio
for that exposure, and the credit default swap spread.
The following table provides information on the credit risk for cash and cash equi
valents
measured at amortized cost, as well as financial investments as of 30 September 2023
and 2022:
€ in millions At amortized cost
Infineon rating External rating
Basis for the
determination of
the loss allowance
Expected 12-month
credit loss
Expected lifetime
credit loss
non-credit-impaired
30 September 2023
Holding Quality 1 AA– to BBB 651 – –
Holding Quality 0 – – – –
Total 651 – –
30 September 2022
Holding Quality 1 AA– to BBB 633 – –
Holding Quality 0 – – – –
Total 633 – –
153
Infineon | Annual Report 2023
Further information
Combined Management Report
Management Board and Supervisory Board
Notes to the Consolidated Financial Statements
Consolidated Financial Statements
155.
As in theprevious year, Infineon had no financial assets that were overdue or impaired
as of 30 September 2023. There was no reclassification between the impairment
levels in the 2023 and 2022 fiscal years.
Infineon had slightly reduced the distribution of its cash investments over around
ten banks as of 30 September 2023. As of 30 September 2023, no financial institution
was responsible for more than 18 percent (30 September 2022: 13 percent) of
Infineon’s cash investments. This gave rise to a maximum risk position of €76 million
(30 September 2022: €55 million) in the event of the default of a single financial
institution, assuming no deposit insurance scheme is in place. In addition, to spread
the risk of investment, investments were made in money market funds with the
best rating and in money market investment funds. Infineon also held derivative
financial instruments with a positive fair value of €10 million as of 30 September 2023
(30 September 2022: €5 million).
Infineon manages the credit risk with respect to trade receivables through a com
prehensive credit evaluation for all major customers, the use of credit limits and
continual monitoring procedures. New customers are evaluated for creditworthiness
in accordance with Infineon guidelines. Credit limits are also in place per customer,
and creditworthiness and credit limits are constantly monitored. A further measure
taken to reduce credit risk is the use of reservation of title clauses. However, despite
continuous monitoring, Infineon cannot fully exclude the possibility of a loss arising
from the default of one of its contract parties.
Infineon assigns trade receivables to different risk classes based on external ratings,
the analysis of customer balance sheet figures, default probabilities (credit default
swaps), customer payment behavior and country risks. The simplified method is used
to determine the expected losses from trade receivables. The expected losses over
the entire term of the trade receivables are determined. The allowance is calculated
for each customer using a weighted-probability method. In calculating the expected
credit losses, for each customer, Infineon takes into account a forward-looking
probability of default provided by a credit rating agency. Individual allowances are
recorded based on case-by-case facts or other risk indicators.
The following table provides information about the credit risk position for trade
receivables from third parties as of 30 September 2023 and 2022:
€ in millions At amortized cost
Infineon rating Risk class External rating Basis for the determination
of the loss allowance
30 September 2023 30 September 2022
1 low risk A– to AAA 586 300
2 average risk BBB to BBB+ 490 714
3 above average risk BB+ to BBB– 450 559
4 increased risk BB– to BB 304 221
5 high risk C to B+ 102 62
– individual none 3 4
– others none 43 23
Total 1,978 1,883
Expected credit losses on trade receivables (see note 10, p. 116) amounted to €2 million
for all risk classes in both the 2023 and 2022 fiscal years. The individual allowances
on trade receivables (no rating) amounted to €3 million as of 30 September 2023
(30 September 2022: €4 million).
Developments in cyclical market and segment risks as well as geopolitical risks are
dynamic, so it cannot be ruled out that the actual credit losses deviate significantly
from the expected credit losses recognized based on current estimates and assump-
tions or that the affected estimates and assumptions will have to be adjusted in future
periods and this could have a significant impact on Infineon’s expected credit losses.
154
Infineon | Annual Report 2023
Further information
Combined Management Report
Management Board and Supervisory Board
Notes to the Consolidated Financial Statements
Consolidated Financial Statements
156.
Financing and liquidityrisk
Financing and liquidity risk is the risk that an entity will encounter difficulties in
meeting obligations associated with financial liabilities.
Liquidity risk could arise from a potential inability of Infineon to meet maturing
financial obligations. Infineon’s liquidity management provides that sufficient
levels of cash and other liquid assets are available and ensures the availability
of funding through adequate levels of committed credit facilities.
The following table discloses the maturity profile for non-derivative financial liabilities
and a cash flow analysis for derivative financial instruments with negative fair values.
The table shows the undiscounted contractually agreed cash flows that result from
the respective financial liability. Cash flows are recognized at the date when Infineon
becomes a contractual partner to the financial instrument. Amounts in foreign cur-
rencies were translated using the closing rate at the reporting date. The cash outflows
of financial liabilities that can be repaid at any time are assigned to the period in
which the earliest redemption is possible.
€ in millions
Due in the fiscal year
Total 2024 2025 2026 2027 2028 Beyond 2028
30 September 2023
Non-derivative financial liabilities 9,544 4,168 705 1,246 456 324 2,645
Derivative financial liabilities:
Cash outflow 574 574 – – – – –
Cash inflow1 (526) (526) – – – – –
Total 9,592 4,216 705 1,246 456 324 2,645
Total 2023 2024 2025 2026 2027 Beyond 2027
30 September 2022
Non-derivative financial liabilities 10,081 4,133 554 681 1,294 473 2,946
Derivative financial liabilities:
Cash outflow 596 596 – – – – –
Cash inflow1 (557) (557) – – – – –
Total 10,120 4,172 554 681 1,294 473 2,946
1 Cash inflows from derivative financial liabilities that arise upon settlement of the instrument.
Future cash flows from derivative financial instruments (see note 27, p. 147 ff.) may
differ from the amounts shown in the table, since exchange rates or relevant factors
are subject to change.
155
Infineon | Annual Report 2023
Further information
Combined Management Report
Management Board and Supervisory Board
Notes to the Consolidated Financial Statements
Consolidated Financial Statements
157.
29 Segment reporting
Identificationof segments
The basis for identifying the reporting segments is the differences between the
products and applications. In the 2023 fiscal year, Infineon’s business was structured
into the four operating segments Automotive, Green Industrial Power, Power Sensor
Systems and Connected Secure Systems. In addition, Infineon differentiates Other
Operating Segments as well as Corporate and Eliminations.
Automotive
The Automotive segment designs, develops, manufactures and markets semicon
ductor products for automotive applications. These include powertrain and energy
management, connectivity and infotainment, body and comfort electronics, safety
and data security. The product portfolio ranges from sensors, microcontrollers,
software solutions, reliable power supplies, storage systems for specific applications,
Si and SiC power semiconductors, as well as components for human-machine
interaction and vehicle connectivity.
Green Industrial Power
The Industrial Power Control segment was renamed Green Industrial Power with
effect from 1 April 2023. Decarbonization, electrification and energy efficiency are key
business drivers in this segment. This focus, together with the decisive contribution
that the segment makes to CO2 reduction, is reflected in the new name. The name
change has no impact on the organizational structure, the strategy, or the scope of
the business. The Green Industrial Power segment specializes in semiconductor solu-
tions for the intelligent management and efficient conversion of electrical energy
across the entire conversion chain, comprising the generation, transmission, storage
and use of electricity. The product portfolio comprises mainly IGBT power transistors
and the driver ICs to control them, as well as power semiconductors based on SiC.
Power Sensor Systems
The Power Sensor Systems segment comprises a wide range of power semiconductor,
radio frequency and sensor technologies. The portfolio of products consists of control
ICs, drivers and MOSFET power transistors, USB controllers and radio frequency
products such as RF antenna switches, RF power transistors and signal amplifiers.
Connected Secure Systems
The Connected Secure Systems segment provides comprehensive systems which are
based on microcontrollers as well as on wireless connectivity and security solutions.
Notably, this includes microcontroller, Wi-Fi, Bluetooth and combined connectivity
solutions (so-called combo chips), hardware-based security technologies, and a
powerful software environment for programming and configuring microcontrollers
and connectivity components, covering a wide range of applications including:
devices for IoT applications, home appliances and smart home appliances, IT equip-
ment, consumer electronics, cloud security and connected vehicles, as well as credit
and debit cards, electronic passports and national identity cards.
Other Operating Segments
Other Operating Segments comprise the remaining activities of divested businesses
and other business activities. Since the sale of the Wireless mobile phone business,
services to Intel Mobile Communications and MaxLinear are included in this segment.
Also included are supplies of LDMOS wafers and related components and services
to Wolfspeed, Inc. (formerly Cree, Inc.), since the sale of the major part of Infineon’s
Radio Frequency Power Components business.
156
Infineon | Annual Report 2023
Further information
Combined Management Report
Management Board and Supervisory Board
Notes to the Consolidated Financial Statements
Consolidated Financial Statements
158.
Corporate and Eliminations
Theelimination of intragroup revenue and profits/losses to the extent that these
arise between the segments is presented in Corporate and Eliminations.
Similarly, certain items are included in Corporate and Eliminations which are not
allocated to the other segments. These include certain corporate headquarters costs
and selected topics, which are not allocated to the segments since they arise from
corporate decisions and are not within the direct control of segment management.
Furthermore, raw materials and supplies are mostly not under the control or respon-
sibility of the operating segment management and are therefore mostly allocated
to corporate functions. Work in progress and finished goods are almost entirely
allocated to the operating segments.
Chief Operating Decision Maker, definition of Segment Result and
allocation of assets and liabilities to the individual segments
The Management Board, as joint Chief Operating Decision Maker, decides how
resources are allocated to the segments.
Based on revenue and Segment Result, the Management Board assesses performance
and defines operating targets and budgets for the segments.
Segment Result is defined as operating profit excluding certain net impairments
and reversal of impairments (in particular on goodwill), the impact on earnings of
restructuring and closures, share-based payment, acquisition-related depreciation/
amortization and other expense, impact on earnings of sales of businesses or interests
in subsidiaries, and other income (expense).
Decisions relating to financing and the investment of cash funds are taken at a
Group level and not at a segment level. For this reason, neither financial income nor
financial expense (including interest income and expense) is allocated internally to
the segments.
Neither assets, liabilities nor cash flows per segment is reported to the Management
Board on a regular basis, nor is segment performance assessed on this basis.
The exception to this approach is certain inventory information which is regularly
analyzed at a segment level. Infineon also allocates depreciation and amortization
expense to the operating segments based on production volume and products
produced using standard costs.
157
Infineon | Annual Report 2023
Further information
Combined Management Report
Management Board and Supervisory Board
Notes to the Consolidated Financial Statements
Consolidated Financial Statements
159.
Segment information
€ inmillions
Total
Product category
Power semiconductors Embedded control
connectivity
RF sensors Memory ICs for
specific applications
2023 2022 2023 2022 2023 2022 2023 2022 2023 2022
Revenue from contracts with customers:
Automotive 8,242 6,516 4,040 3,298 2,796 1,742 710 733 696 743
Green Industrial Power 2,205 1,790 2,205 1,790 – – – – – –
Power Sensor Systems 3,798 4,070 2,997 3,034 332 330 469 706 – –
Connected Secure Systems 2,046 1,822 – – 2,046 1,822 – – – –
Subtotal 16,291 14,198 9,242 8,122 5,174 3,894 1,179 1,439 696 743
Other Operating Segments 18 20
Corporate and Eliminations – –
Total 16,309 14,218
There were limited levels of trading relationships between the operating segments
during the 2023 and 2022 fiscal years. Costs are generally recharged without impact
on profit or loss.
Change
€ in millions 2023 2022 absolute in %
Segment Result:
Automotive 2,380 1,490 890 60
Green Industrial Power 662 384 278 72
Power Sensor Systems 861 1,137 (276) (24)
Connected Secure Systems 488 378 110 29
Other Operating Segments 5 5 – –
Corporate and Eliminations 3 (16) 19 +++
Total 4,399 3,378 1,021 30
158
Infineon | Annual Report 2023
Further information
Combined Management Report
Management Board and Supervisory Board
Notes to the Consolidated Financial Statements
Consolidated Financial Statements
160.
The following tableprovides the reconciliation of Segment Result to profit (loss) from
continuing operations before income taxes:
Change
€ in millions 2023 2022 absolute in %
Segment Result: 4,399 3,378 1,021 30
Plus/minus:
Certain reversal of impairments (impairments)
(in particular on goodwill) – 6 (6) –––
Gains (losses) on earnings of
restructuring and closures 4 – 4 +++
Share-based payment (92) (62) (30) (48)
Acquisition-related depreciation/
amortization and other expenses (464) (484) 20 4
Gains (losses) on sales of businesses,
or interests in subsidiaries 30 – 30 +++
Other income and expenses 71 7 64 +++
Operating profit 3,948 2,845 1,103 39
Financial income 105 7 98 +++
Financial expenses (159) (168) 9 5
Share of profit (loss) of associates
and joint ventures accounted for using
the equity method 27 39 (12) (31)
Profit (loss) from continuing operations
before income taxes 3,921 2,723 1,198 44
Of the €464 million (2022: €484 million) “Acquisition-related depreciation/amortization
and other expenses” incurred in the 2023 fiscal year, €276 million (2022: €288 million)
was attributable to cost of goods sold, €9 million (2022: €12 million) to research and
development expenses, €168 million (2022: €177 million) to selling, general and
administrative expenses and €11 million (2022: €7 million) to the balance of other
operating income and expense.
2023 2022
Change
€ in millions absolute in %
Depreciation and amortization:
Automotive 716 631 85 13
Green Industrial Power 200 187 13 7
Power Sensor Systems 295 279 16 6
Connected Secure Systems 93 85 8 9
Other Operating Segments 2 2 – –
Depreciation and amortization
allocated to the segments 1,306 1,184 122 10
Depreciation and amortization
not allocated to the segments 448 480 (32) (7)
Total depreciation and amortization 1,754 1,664 90 5
30 Septem-
ber 2023
30 Septem-
ber 2022
Change
€ in millions absolute in %
Inventories:
Automotive 2,039 1,337 702 53
Green Industrial Power 336 290 46 16
Power Sensor Systems 736 798 (62) (8)
Connected Secure Systems 461 311 150 48
Other Operating Segments 1 3 (2) (67)
Corporate and Eliminations 401 342 59 17
Total 3,974 3,081 893 29
Impairment losses on assets in the 2023 fiscal year amounted to €0 million (2022:
€4 million) in the Automotive segment, €12 million (2022: €0 million) in the Green
Industrial Power segment, €5 million (2022: €20 million) in the Power Sensor
Systems segment, and €1 million (2022: €7 million) in Corporate and Eliminations.
Also allocated to Corporate and Eliminations in the 2023 fiscal year was €0 million
(2022: €7 million) of reversal of impairments to assets.
159
Infineon | Annual Report 2023
Further information
Combined Management Report
Management Board and Supervisory Board
Notes to the Consolidated Financial Statements
Consolidated Financial Statements
161.
Entity-wide disclosures inaccordance with IFRS 8
Revenue for the 2023 and 2022 fiscal years by region was as follows:
2023 2022
Change
€ in millions absolute in %
Revenue:
Europe, Middle East, Africa 4,360 3,399 961 28
therein: Germany 2,017 1,594 423 27
Asia-Pacific (excluding Japan, Greater China) 2,594 2,343 251 11
Greater China1 5,275 5,204 71 1
therein: Mainland China, Hong Kong 4,124 4,063 61 2
Japan 1,706 1,415 291 21
Americas 2,374 1,857 517 28
therein: USA 1,982 1,564 418 27
Total 16,309 14,218 2,091 15
1 Greater China comprises Mainland China, Hong Kong and Taiwan.
The allocation of revenues from external customers to geographic areas is based on
the customers’ locations. The average number of employees by geographic region is
provided in note 4. p. 109
No single customer accounted for more than 10 percent of Infineon’s revenue during
the 2023 and 2022 fiscal years.
Non-current assets as of 30 September 2023 and 2022, by region, were as follows:
30 Septem-
ber 2023
30 Septem-
ber 20221
Change
€ in millions absolute in %
Non-current assets:
Europe 6,105 4,873 1,232 25
therein: Germany 3,621 2,904 717 25
Asia-Pacific (excluding Japan, Greater China) 2,128 1,627 501 31
Greater China2 176 152 24 16
therein: Mainland China, Hong Kong 162 137 25 18
Japan 79 67 12 18
Americas 8,767 9,993 (1,226) (12)
therein: USA 8,750 9,978 (1,228) (12)
Total 17,255 16,712 543 3
1
The presentation of grants receivables, as well as of some of the advance payments made, was corrected in the 2023 fiscal year.
These are now no longer reported under current or non-current financial assets. The previous year’s figures have been adjusted to
improve comparability.
2 Greater China comprises Mainland China, Hong Kong and Taiwan.
Non-current assets do not include financial instruments, deferred tax assets and
assets from employee benefits.
160
Infineon | Annual Report 2023
Further information
Combined Management Report
Management Board and Supervisory Board
Notes to the Consolidated Financial Statements
Consolidated Financial Statements
162.
30 Additional informationin accordance with HGB
Information pursuant to section 161 Stock Corporation Act (AktG)
The Declaration of Compliance prescribed by section 161 AktG was drawn up by the
Management Board and the Supervisory Board and made permanently available to
the public on Infineon’s website.
www.infineon.com/cms/en/about-infineon/investor/corporate-governance/#corporate-governance
Fees for audit and advisory services pursuant to section 314,
paragraph 1, no. 9, HGB
Year-end audit fees
At the Annual General Meeting held on 16 February 2023, the shareholders elected
KPMG AG Wirtschaftsprüfungsgesellschaft (KPMG), Munich (Germany), as auditor for
the 2023 Separate Financial Statements and the Consolidated Financial Statements
of Infineon Technologies AG. The audit fees charged by KPMG in the 2023 fiscal year
amounted to €4.3 million for the audit of the Consolidated Financial Statements and
various annual audits, including an audit review of the Interim Financial Statements.
Fees for other advisory services
In addition to the amounts described above, KPMG charged an aggregate of
€0.7 million in the 2023 fiscal year for other audit services, which mainly included
the audit of the disclosures in the Sustainability Report, the audit of compliance
management systems, the provision of comfort letters, as well as the substantive
audit of the Remuneration Report.
Fees for other services
Fees of €0.2 million were charged by KPMG to the Company in the 2023 fiscal year for
other services. These mainly included quality assurance during the implementation
of regulatory requirements.
Management Board and Supervisory Board
Management remuneration in the 2023 fiscal year
As required by section 314, paragraph 1, no. 6, in conjunction with section 315e
paragraph 1, HGB, the total remuneration of the Management Board and the Super
visory Board is disclosed in note 25, p. 140.
Disclosure of the renumeration of individual members of the Management Board and
the Supervisory Board, as required by section 162 of the AktG, can be found in the
Remuneration Report, which is prepared according to stock corporation law and is
available under the following link:
www.infineon.com/remuneration-report
The references to the Remuneration Report are not audited as part of the audit of
the financial statements. The Remuneration Report was subjected to a separate
substantive audit by the auditor in accordance with IDW PS 490. This audit also
includes the formal audit required by section 162, paragraph 3 of the German Stock
Corporation Act (AktG).
161
Infineon | Annual Report 2023
Further information
Combined Management Report
Management Board and Supervisory Board
Notes to the Consolidated Financial Statements
Consolidated Financial Statements
163.
Management Board
The ManagementBoard members were as follows:
Name Position Membership of Supervisory Boards
and other comparable governing bodies of domestic
and foreign companies
Jochen Hanebeck Chief Executive Officer,
Labor Director
Supervisory Board member
› Infineon Technologies Austria AG, Austria
(Chairman)
Constanze Hufenbecher
(until 31 October 2023)
Chief Digital
Transformation Officer
Supervisory Board member
› Voith GmbH Co. KGaA, Germany
Member of the Shareholders’ Committee
› Voith Management GmbH, Germany
Elke Reichart
(since 1 November 2023)
Chief Digital
Transformation Officer
Supervisory Board member
› Trumpf SE + Co. KG, Germany
› SUSE S.A., Luxembourg
› BECHTLE AG, Germany
Member of the Board of Directors
› esure Group plc, Great Britain
Dr. Sven Schneider Chief Financial Officer Supervisory Board member
› Covestro AG, Germany (listed)
› Infineon Technologies Austria AG, Austria
Member of the Board of Directors
› Infineon Technologies China Co., Ltd.,
People’s Republic of China
› Infineon Technologies Asia Pacific Pte., Ltd., Singapore
› Infineon Technologies Americas Corp., USA
› Infineon Technologies Japan K.K., Japan
Andreas Urschitz Chief Marketing Officer Member of the Board of Directors
› Infineon Technologies Asia Pacific Pte., Ltd., Singapore
(Chairman)
› Infineon Technologies Japan K.K., Japan
› Infineon Technologies China Co., Ltd.,
People’s Republic of China
› Infineon Technologies Americas Corp., USA
(Chairman)
Dr. Rutger Wijburg Chief Operations Officer Supervisory Board member
› SMART Photonics B.V., Netherlands
› Carl Zeiss AG, Germany (since 13 March 2023)
The Supervisory Board
The Supervisory Board members, their Supervisory Board position, their occupation,
and their membership of other supervisory and governing bodies are as follows:
Name Position Membership of other Supervisory Boards
and other comparable governing bodies of domestic
and foreign companies
Dr. Herbert Diess
Chairman
(since 16 February 2023)
Manager, most recently
CEO of Volkswagen AG
Johann Dechant1
Vice Chairman
Chairman of the
group works council,
Vice Chairman of the
general works council
and Chairman of the
works council Regensburg,
Infineon Technologies AG
Member of the Administrative Board
› SBK Siemens-Betriebskrankenkasse, Germany
Xiaoqun Clever-Steg Member of various
supervisory bodies
Supervisory Board member
› Capgemini SE, France (listed)
(until 16 May 2023)
› Amadeus IT Group SA, Spain (listed)
Member of the Administrative Board
› Cornelsen Group, Germany
Member of the Board of Directors
› BHP Group Plc., Great Britain (listed)
und BHP Group Ltd., Australia (listed)
Dr. Wolfgang Eder
Chairman
(until 16 February 2023)
Member of various
supervisory bodies
Supervisory Board member
› voestalpine AG, Austria (listed)
(Chairman)
Dr. Friedrich Eichiner Member of various
supervisory bodies
Supervisory Board member
› Festo Management SE, Germany (Chairman)
› Allianz SE, Germany (listed)
Annette Engelfried1 Labor union secretary
IG Metall district
management, Berlin-
Brandenburg-Saxony
Supervisory Board member
› Infineon Technologies Dresden Verwaltungs GmbH,
Germany
› Siemens Gamesa Renewable Energy
Deutschland GmbH, Germany
162
Infineon | Annual Report 2023
Further information
Combined Management Report
Management Board and Supervisory Board
Notes to the Consolidated Financial Statements
Consolidated Financial Statements
164.
Name Position Membershipof other Supervisory Boards
and other comparable governing bodies of domestic
and foreign companies
Peter Gruber1
Representative of
Senior Management
Chief Financial Officer
Operations,
Infineon Technologies AG
Supervisory Board member
› Infineon Technologies Dresden Verwaltungs GmbH,
Germany
Klaus Helmrich
(since 16 February 2023)
Member of various
supervisory bodies
Supervisory Board member
› ZF Friedrichshafen AG, Germany
› Festo SE Co. KG, Germany
Member of the Foundation Council
› Friedhelm Loh Familienstiftung, Germany
› Friedhelm Loh Stiftung, Germany
Hans-Ulrich Holdenried
(until 16 February 2023)
Independent
Management Consultant
Member of the Advisory Board
› Bridge imp GmbH, Germany
Dr. Susanne Lachenmann1 Principal Engineer,
Infineon Technologies AG
Géraldine Picaud
(until 2 February 2023)
Chief Financial Officer,
Holcim Ltd., Switzerland
(until 30 April 2023)
Member of the Board of Directors
› Danone S.A., France (listed)
Following Holcim Group mandates (until 30 April 2023):
› Holcim Group Services Ltd, Switzerland
› Holcim Technology Ltd, Switzerland
› Lafarge Maroc SA, Morocco
› LafargeHolcim Maroc SAS, Morocco (listed)
› LafargeHolcim Maroc Afrique SAS, Morocco
› Huaxin Cement Co., Ltd., People’s Republic of China
(listed)
Dr. Manfred Puffer Independent
Management Consultant
Supervisory Board member
› Athora Lebensversicherung AG, Germany
› Nova KBM Bank, Slovenia (until 6 February 2023)
› Oldenburgische Landesbank AG, Germany
Member of the Board of Directors
› Athene Holding Ltd., Bermuda (listed)
› Catalina Holdings (Bermuda) Ltd., Bermuda
Melanie Riedl1 Analysis Engineer and
Vice Chairwoman of the
Works Council Campeon
Jürgen Scholz1 Labor union secretary Supervisory Board member
› Krones AG, Germany (listed)
(until 23 May 2023)
Member of the Administrative Board
› BKK of BMW AG, Germany
Name Position Membership of other Supervisory Boards
and other comparable governing bodies of domestic
and foreign companies
Dr. Ulrich Spiesshofer Senior advisor –
The Blackstone Group,
member of various advisory
boards and investor
Member of the Board of Directors
› Schlumberger N.V. (Schlumberger Ltd), Curaçao
(listed)
Margret Suckale Member of various
supervisory bodies
Supervisory Board member
› Heidelberg Materials AG, Germany (listed)
› Deutsche Telekom AG, Germany (listed)
› DWS Group GmbH Co. KGaA, Germany (listed)
› Greiner AG, Austria (since 27 June 2023)
Mirco Synde1 Supervisor
frontend production,
Infineon Technologies
Dresden GmbH Co. KG
Diana Vitale1 Chairwoman of the
Works Council Warstein,
Infineon Technologies AG
Ute Wolf
(since 22 April 2023)
Member of various
supervisory bodies
Supervisory Board member
› DWS Group GmbH Co. KGaA, Germany (listed)
› Klöckner Co. SE, Germany (listed)
› MTU Aero Engines AG, Germany
(since 11 May 2023)
Member of the Advisory Board
› Borussia Dortmund Geschäftsführungs-GmbH,
Germany
1 Employee representative.
The business address of each member of the Supervisory Board is:
Infineon Technologies AG, Am Campeon 1–15, D-85579 Neubiberg (Germany).
163
Infineon | Annual Report 2023
Further information
Combined Management Report
Management Board and Supervisory Board
Notes to the Consolidated Financial Statements
Consolidated Financial Statements
165.
Supervisory Board committees
MediationCommittee
Dr. Herbert Diess (Member and Chairman since 16 February 2023)
Dr. Wolfgang Eder (Member and Chairman until 16 February 2023)
Johann Dechant
Hans-Ulrich Holdenried (Member until 16 February 2023)
Jürgen Scholz
Margret Suckale (Member since 16 February 2023)
Executive Committee
Dr. Herbert Diess (Member and Chairman since 16 February 2023)
Dr. Wolfgang Eder (Member and Chairman until 16 February 2023)
Johann Dechant
Dr. Friedrich Eichiner (Member since 16 February 2023)
Annette Engelfried
Hans-Ulrich Holdenried (Member until 16 February 2023)
Margret Suckale
Diana Vitale
Investment, Finance and Audit Committee
Dr. Friedrich Eichiner (Chairman)
Johann Dechant
Dr. Wolfgang Eder (Member until 16 February 2023)
Annette Engelfried
Ute Wolf (Member since 22 April 2023)
Strategy and Technology Committee
Dr. Herbert Diess (Member and Chairman since 16 February 2023)
Xiaoqun Clever-Steg
Dr. Wolfgang Eder (Member until 16 February 2023)
Peter Gruber
Dr. Susanne Lachenmann
Jürgen Scholz
Dr. Ulrich Spiesshofer (Chairman until 16 February 2023)
Nomination Committee
Dr. Herbert Diess (Member and Chairman since 16 February 2023)
Dr. Friedrich Eichiner (Chairman until 16 February 2023)
Géraldine Picaud (Member until 2 February 2023)
Dr. Manfred Puffer (Member until 16 February 2023)
Margret Suckale
164
Infineon | Annual Report 2023
Further information
Combined Management Report
Management Board and Supervisory Board
Notes to the Consolidated Financial Statements
Consolidated Financial Statements
166.
Subsidiaries, associated companies,joint ventures and other companies (not consolidated)
as of 30 September 2023
Name of company Registered office Shareholdings
in %
Thereof Infineon
Technologies AG
Equity
(€ in millions)
Net result
(€ in millions)
Footnote
Fully consolidated subsidiaries:
5200 Ben White Condominiums Association, Inc. Austin, Texas, USA n.a. 0 0.00 0.00 6, 19, 24
AgigA Tech, Inc. Wilmington, Delaware, USA 100 0 0.32 (2.04) 6, 24
CYLand Corp. General Trias, Philippines 40 0 1.39 0.00 11, 20
Cypress International, LLC Wilmington, Delaware, USA 100 0 0.00 0.00 6, 24
Cypress Manufacturing, Ltd. Camana Bay (George Town), Cayman Islands 100 0 47.35 0.42 6, 24
Cypress Semiconductor (Canada), Inc. Kanata, Ontario, Canada 100 0 1.34 1.05 6
Cypress Semiconductor (Mauritius) LLC Ebène, Mauritius 100 0 0.13 (0.03) 5
Cypress Semiconductor (Switzerland) Sàrl Lausanne, Switzerland 100 0 7.09 1.46 11
Cypress Semiconductor Corporation Wilmington, Delaware, USA 100 0 6,495.61 (197.26) 6, 24
Cypress Semiconductor International, Inc. Wilmington, Delaware, USA 100 0 316.41 4.78 6, 24
Cypress Semiconductor Ireland Limited Cork, Ireland 100 0 8.89 2.34 4
Cypress Semiconductor México, S. de R.L. de C.V. Guadalajara, Mexico 100 0 (0.03) 0.02 11
Cypress Semiconductor Philippines Headquarters, Ltd. Camana Bay (George Town), Cayman Islands 100 0 6.29 (0.03) 6, 24
Cypress Semiconductor Singapore Pte. Ltd. Singapore, Singapore 100 0 2.80 2.24 11
Cypress Semiconductor Technology (Shanghai) Co. Ltd. Shanghai, People’s Republic of China 100 0 4.29 (6.92) 11
Cypress Semiconductor Technology Ltd. Camana Bay (George Town), Cayman Islands 100 0 274.43 (0.82) 6, 24
Cypress Semiconductor Ukraine LLC Lviv, Ukraine 100 0 2.36 0.09 11
Cypress Semiconductor World Trade Corp. Camana Bay (George Town), Cayman Islands 100 0 6.64 0.00 6, 24
Hitex GmbH Karlsruhe, Germany 100 100 2.16 0.00 3, 13, 14
Infineon Integrated Circuit (Beijing) Co., Ltd. Beijing, People’s Republic of China 100 0 15.16 1.29 11
Infineon Semiconductors (Shenzhen) Co., Ltd. Shenzhen, People’s Republic of China 100 0 3.39 1.88 11
Infineon Semiconductors (Wuxi) Co., Ltd. Wuxi, People’s Republic of China 100 0 47.64 2.92 11
Infineon Technologies (Kulim) Sdn. Bhd. Kulim, Malaysia 100 0 429.36 76.96 6
Infineon Technologies (Malaysia) Sdn. Bhd. Melaka, Malaysia 100 0 353.34 47.08 6
Infineon Technologies (Penang) Sdn. Bhd. Kuala Lumpur, Malaysia 100 0 9.10 1.36 8
Infineon Technologies (Shanghai) Co. Ltd. Shanghai, People’s Republic of China 100 0 n.a. n.a. 12
Infineon Technologies (Thailand) Limited Nonthaburi, Thailand 100 0 91.88 3.80 8
Infineon Technologies (Wuxi) Co., Ltd. Wuxi, People’s Republic of China 100 0 141.33 14.74 11
Infineon Technologies (Xi’an) Co., Ltd. Xi’an, People’s Republic of China 100 0 8.13 0.37 11
165
Infineon | Annual Report 2023
Further information
Combined Management Report
Management Board and Supervisory Board
Notes to the Consolidated Financial Statements
Consolidated Financial Statements
167.
Name of companyRegistered office Shareholdings
in %
Thereof Infineon
Technologies AG
Equity
(€ in millions)
Net result
(€ in millions)
Footnote
Infineon Technologies 2. Vermögensverwaltungsgesellschaft mbH Neubiberg, Germany 100 0 0.03 (0.02) 6
Infineon Technologies 3. Vermögensverwaltungsgesellschaft mbH Dresden, Germany 100 0 n.a. n.a. 12
Infineon Technologies Acquisition B.V. Rotterdam, The Netherlands 100 100 n.a. n.a. 12
Infineon Technologies Americas Corp. Wilmington, Delaware, USA 100 0 1,818.33 200.18 6, 24
Infineon Technologies Asia Pacific Pte Ltd Singapore, Singapore 100 0 802.02 275.97 6
Infineon Technologies Australia Pty Limited Blackburn, Australia 100 0 1.46 0.05 6
Infineon Technologies Austria AG Villach, Austria 100 0.004 1,965.89 518.96 6
Infineon Technologies Canada Acquisition Inc. Toronto, Ontario, Canada 100 0 n.a. n.a. 12
Infineon Technologies Cegléd Kft. Cegléd, Hungary 100 0 42.37 (12.95) 6
Infineon Technologies Center of Competence (Shanghai) Co., Ltd. Shanghai, People’s Republic of China 100 0 4.09 1.19 11
Infineon Technologies China Co., Ltd. Shanghai, People’s Republic of China 100 0 217.53 36.64 11
Infineon Technologies d.o.o. Beograd Belgrade, Serbia 100 0 0.07 0.07 11
Infineon Technologies Denmark ApS Herlev, Denmark 100 0 (1.03) (5.95) 6
Infineon Technologies Dresden GmbH Co. KG Dresden, Germany 100 100 288.61 25.27 6, 16
Infineon Technologies Dresden Verwaltungs GmbH Neubiberg, Germany 100 0 0.09 0.00 6, 13, 15
Infineon Technologies Epi Services, Inc. Wilmington, Delaware, USA 100 0 21.07 7.17 6, 24
Infineon Technologies Finance B.V. Rotterdam, The Netherlands 100 100 1.91 (0.02) 6
Infineon Technologies France S.A.S. St. Denis, France 100 0 9.14 0.68 6
Infineon Technologies Holding Asia Pacific Pte. Ltd. Singapore, Singapore 100 0 3.81 3.04 6
Infineon Technologies Holding B.V. Rotterdam, The Netherlands 100 100 11,677.51 276.10 6
Infineon Technologies Hong Kong Ltd. Hong Kong, People’s Republic of China 100 0 2.63 0.90 6
Infineon Technologies India Private Limited Bangalore, India 100 0 22.35 5.39 5
Infineon Technologies Innovates G.K. Tokyo, Japan 100 0 24.90 5.78 6
Infineon Technologies Investment B.V. Rotterdam, The Netherlands 100 0 0.09 (0.02) 6
Infineon Technologies Ireland Limited Dublin, Ireland 100 100 0.54 0.26 6
Infineon Technologies Italia s.r.l. Milan, Italy 100 0 6.77 1.69 6
Infineon Technologies IT-Services GmbH Klagenfurt, Austria 100 0 11.15 6.53 6
Infineon Technologies Japan K.K. Tokyo, Japan 100 0 56.88 17.98 6
Infineon Technologies Korea Co., LLC Seoul, Republic of Korea 100 0 15.89 7.01 6
Infineon Technologies LLC Wilmington, Delaware, USA 100 0 832.53 52.39 6, 24
Infineon Technologies Memory Solutions Germany GmbH Neubiberg, Germany 100 0 0.11 0.09 3
Infineon Technologies Memory Solutions Holdings Inc. Wilmington, Delaware, USA 100 0 74.84 0.00 6, 24
Infineon Technologies Memory Solutions India LLP Bangalore, India 100 0 0.15 0.14 5
166
Infineon | Annual Report 2023
Further information
Combined Management Report
Management Board and Supervisory Board
Notes to the Consolidated Financial Statements
Consolidated Financial Statements
168.
Name of companyRegistered office Shareholdings
in %
Thereof Infineon
Technologies AG
Equity
(€ in millions)
Net result
(€ in millions)
Footnote
Infineon Technologies Memory Solutions Israel Ltd. Netanya, Israel 100 0 84.64 6.27 3
Infineon Technologies Memory Solutions Japan G.K. Tokyo, Japan 100 0 0.80 0.43 6
Infineon Technologies Memory Solutions Malaysia Sdn. Bhd. Kuala Lumpur, Malaysia 100 0 0.57 0.18 10
Infineon Technologies Memory Solutions Taiwan Ltd. Taipei, Taiwan 100 0 0.31 0.11 6
Infineon Technologies Nijmegen B.V. Nijmegen, The Netherlands 100 0 0.20 0.00 7
Infineon Technologies Nordic AB Kista, Sweden 100 0 4.87 0.54 6
Infineon Technologies Philippines, Inc. Muntinlupa City, Philippines 100 0 0.70 0.52 6
Infineon Technologies Power Semitech Co., Ltd. Cheonan, Republic of Korea 100 100 52.74 4.81 6
Infineon Technologies Reigate Limited Bristol, Great Britain 100 0 4.68 1.09 6
Infineon Technologies Romania Co. Societate in Comandita Bucharest, Romania 100 0 6.21 2.55 6
Infineon Technologies Semiconductor GmbH Aschheim, Germany 100 0 12.09 2.68 4
Infineon Technologies Semiconductor India Private Limited Bangalore, India 100 0 52.03 8.27 5
Infineon Technologies Shared Service Center, Unipessoal Lda. Maia, Portugal 100 100 5.59 0.86 6
Infineon Technologies Taiwan Co., Ltd. Taipei, Taiwan 100 0 10.00 2.10 6
Infineon Technologies UK Limited Bristol, Great Britain 100 0 4.33 0.97 6
Infineon Technologies US HoldCo Inc. Wilmington, Delaware, USA 100 0 8,648.84 19.23 6, 24
Infineon Technologies US InterCo LLC Wilmington, Delaware, USA 100 0 7,889.00 2.10 6, 24
Infineon Technologies US Investment LLC Wilmington, Delaware, USA 100 0 (0.09) 19.15 6, 24
Infineon Technologies Vermögensverwaltungsgesellschaft mbH Neubiberg, Germany 100 100 286.47 0.00 6, 13, 15
International Rectifier HiRel Products, Inc. Wilmington, Delaware, USA 100 0 307.76 86.78 6, 24
MOLSTANDA Vermietungsgesellschaft mbH Neubiberg, Germany 100 0 304.94 0.00 6, 15
MOTEON GmbH Neubiberg, Germany 100 100 0.31 0.21 6
MoTo Objekt CAMPEON GmbH Co. KG Neubiberg, Germany 100 0 93.39 28.40 6, 17
NoBug Consulting SRL Bucharest, Romania 100 0 1.15 0.62 11
PT Infineon Technologies Batam Batam, Indonesia 100 0 24.87 1.41 6
Ramtron International Corporation Wilmington, Delaware, USA 100 0 0.00 0.00 6, 24
Rectificadores Internacionales, S.A. de C.V. Tijuana, Mexico 100 0 14.34 1.99 6, 24
SILTECTRA GmbH Dresden, Germany 100 0 15.92 12.47 6
Spansion Inc. Wilmington, Delaware, USA 100 0 1,281.11 56.64 6, 24
Spansion LLC Wilmington, Delaware, USA 100 0 1,859.61 326.82 6, 24
Syntronixs Asia Sdn. Bhd. Melaka, Malaysia 100 0 5.57 1.09 8
167
Infineon | Annual Report 2023
Further information
Combined Management Report
Management Board and Supervisory Board
Notes to the Consolidated Financial Statements
Consolidated Financial Statements
169.
Name of companyRegistered office Shareholdings
in %
Thereof Infineon
Technologies AG
Equity
(€ in millions)
Net result
(€ in millions)
Footnote
Associated companies:
Deca Technologies, Inc. Dover, Delaware, USA 42.5 0 9.31 (0.85) 11, 23, 24
pmdtechnologies ag Siegen, Germany 15 15 4.48 (13.54) 11, 21
SkyHigh Memory Limited Hong Kong, People’s Republic of China 40 0 52.76 19.23 11, 23
Joint ventures:
Infineon Technologies Bipolar GmbH Co. KG Warstein, Germany 60 60 52.67 17.73 6, 22
SAIC Infineon Automotive Power Modules (Shanghai) Co., Ltd Shanghai, People’s Republic of China 49 25 53.57 43.11 11
Other companies (not consolidated):1
CHiL Semiconductors Corporation Wilmington, Delaware, USA 100 0 0.00 0.00 6
Cypress Envirosystems, Inc. Wilmington, Delaware, USA n.a. 0 n.a. n.a. 18
EPOS embedded core power systems GmbH Co. KG Duisburg, Germany 100 100 1.26 0.54 6
EPOS embedded core power systems Verwaltungs GmbH Duisburg, Germany 100 100 0.08 0.00 6
Futurium gGmbH Berlin, Germany n.a. n.a. n.a. n.a. 18
Hitex (UK) Limited Coventry, Great Britain 100 0 2.64 0.85 6
Imagimob AB Stockholm, Sweden 100 0 0.08 (1.02) 11
Industrial Analytics IA GmbH Neubiberg, Germany 100 100 0.53 (0.06) 8
Infineon Technologies Bipolar Verwaltungs GmbH Warstein, Germany 60 60 0.03 0.00 6
Infineon Technologies Campeon Verwaltungsgesellschaft mbH Neubiberg, Germany 100 0 0.15 0.02 6
Infineon Technologies Delta GmbH Neubiberg, Germany 100 100 0.04 0.00 6
Infineon Technologies Gamma GmbH Neubiberg, Germany 100 100 0.03 0.00 6
Infineon Technologies Holding GmbH Neubiberg, Germany 100 100 0.13 0.00 6, 13
Infineon Technologies Iberia, S.L.U. Madrid, Spain 100 0 0.16 0.06 6
Infineon Technologies Israel Ltd. Netanya, Israel 100 0 0.00 0.00 9
Infineon Technologies Mantel 26 AG Neubiberg, Germany 100 100 0.02 (0.01) 6
Infineon Technologies Mantel 27 GmbH Neubiberg, Germany 100 100 0.03 0.00 6, 13
Infineon Technologies Mantel 29 GmbH Neubiberg, Germany 100 100 0.03 0.00 6, 13
Infineon Technologies Polska Sp. z o.o. Warsaw, Poland 100 0 0.15 0.02 6
Infineon Technologies Romania s.r.l. Bucharest, Romania 100 0 0.05 0.01 11
Infineon Technologies South America Ltda São Paulo, Brasil 100 0 (0.03) (0.11) 11
Infineon Technologies Vietnam Company Ltd. Hanoi, Vietnam 100 0 0.17 0.05 6
IR International Holdings China, Inc. Wilmington, Delaware, USA 100 0 0.00 0.00 6
KAI Kompetenzzentrum Automobil- und Industrieelektronik GmbH Villach-St. Magdalen, Austria 100 0 0.87 0.30 11
168
Infineon | Annual Report 2023
Further information
Combined Management Report
Management Board and Supervisory Board
Notes to the Consolidated Financial Statements
Consolidated Financial Statements
170.
Name of companyRegistered office Shareholdings
in %
Thereof Infineon
Technologies AG
Equity
(€ in millions)
Net result
(€ in millions)
Footnote
KFE Kompetenzzentrum Fahrzeug Elektronik GmbH Lippstadt, Germany 24 24 1.27 0.09 11
MicroLinks Technology Corp. Kaohsiung, Taiwan n.a. 0 n.a. n.a. 18
OSPT IP Pool GmbH Neubiberg, Germany 100 100 0.03 (0.01) 6
PT Infineon Technologies Indonesia Jakarta, Indonesia 100 0 0.23 0.04 6
R Labco, Inc. Wilmington, Delaware, USA 100 0 0.00 0.00 6
Schweizer Electronic AG Schramberg, Germany 9 9 24.23 (24.89) 11
Silicon Alps Cluster GmbH Villach, Austria n.a. 0 n.a. n.a. 18
TTTech Auto AG Vienna, Austria n.a. n.a. n.a. n.a. 18
Virtual Vehicle Research GmbH Graz, Austria n.a. n.a. n.a. n.a. 18
XMOS Limited Bristol, Great Britain n.a. 0 n.a. n.a. 18
Qimonda AG and its subsidiaries:2
Celis Semiconductor Corp. Colorado Springs, Colorado, USA 17 0 – – 2
Itarion Solar Lda. Vila do Conde, Portugal 40 0 – – 2
Qimonda (Malaysia) Sdn. Bhd. (in liquidation) Melaka, Malaysia 77 0 – – 2
Qimonda AG (in insolvency) Munich, Germany 77 28 – – 2
Qimonda Asia Pacific Pte. Ltd. Singapore, Singapore 77 0 – – 2
Qimonda Belgium BVBA (in insolvency) Leuven, Belgium 77 0 – – 2
Qimonda Bratislava s.r.o. (in liquidation) Bratislava, Slovakia 77 0 – – 2
Qimonda Dresden GmbH Co. OHG (in insolvency) Dresden, Germany 77 0 – – 2
Qimonda Dresden Verwaltungsgesellschaft mbH (in insolvency) Dresden, Germany 77 0 – – 2
Qimonda Finance LLC (in insolvency) Wilmington, Delaware, USA 77 0 – – 2
Qimonda Flash GmbH (in insolvency) Dresden, Germany 77 0 – – 2
Qimonda France SAS (in liquidation) St. Denis, France 77 0 – – 2
Qimonda Holding B.V. (in insolvency) Rotterdam, The Netherlands 77 0 – – 2
Qimonda International Trade (Shanghai) Co. Ltd. Shanghai, People’s Republic of China 77 0 – – 2
Qimonda Investment B.V. Rotterdam, The Netherlands 77 0 – – 2
Qimonda IT (Suzhou) Co., Ltd. (in liquidation) Suzhou, People’s Republic of China 77 0 – – 2
Qimonda Italy s.r.l. (in liquidation) Padua, Italy 77 0 – – 2
Qimonda Korea Co. Ltd. (in liquidation) Seoul, Republic of Korea 77 0 – – 2
Qimonda Licensing LLC Fort Lauderdale, Florida, USA 77 0 – – 2
Qimonda Memory Product Development Center (Suzhou) Co. (in liquidation) Suzhou, People’s Republic of China 77 0 – – 2
Qimonda North America Corp. (in insolvency) Wilmington, Delaware, USA 77 0 – – 2
169
Infineon | Annual Report 2023
Further information
Combined Management Report
Management Board and Supervisory Board
Notes to the Consolidated Financial Statements
Consolidated Financial Statements
171.
Name of companyRegistered office Shareholdings
in %
Thereof Infineon
Technologies AG
Equity
(€ in millions)
Net result
(€ in millions)
Footnote
Qimonda Richmond LLC (in insolvency) Wilmington, Delaware, USA 77 0 – – 2
Qimonda Taiwan Co. Ltd. (in liquidation) Taipei, Taiwan 77 0 – – 2
Qimonda UK Ltd. (in liquidation) High Blantyre, Scotland 77 0 – – 2
1 Certain subsidiaries were not consolidated due to immateriality.
2
On 23 January 2009, Qimonda AG applied to the Munich District Court for insolvency proceedings to be opened. Insolvency proceedings were formally opened on 1 April 2009. The equity and earnings of Qimonda AG and its subsidiaries
are not disclosed due to the substantial and ongoing restriction of Infineon’s rights as a result of Qimonda AG’s insolvency. The list of subsidiaries held by Qimonda AG is based on information from 30 September 2010, since Infineon
had not received any further information from the insolvency administrator of Qimonda AG with respect to the insolvency or liquidation of Qimonda companies, and further reflects information from the German commercial register.
Since all Qimonda-related investments were written down in full in previous years, this has no effect on Infineon’s net assets, financial position and results of operations.
3 Equity and net result as of 30 September 2021.
4 Equity and net result as of 31 December 2021.
5 Equity and net result as of 31 March 2022.
6 Equity and net result as of 30 September 2022.
7 Equity and net result as of 30 September 2022 (period from 12 November 2021 until 30 September 2022).
8 Equity and net result as of 30 September 2022 (period from 1 January 2022 until 30 September 2022).
9 Equity and net result as of 30 September 2022 (period from 8 September 2022 until 30 September 2022).
10 Equity and net result as of 2 October 2022 (period from 4 October 2021 until 2 October 2022).
11 Equity and net result as of 31 December 2022.
12 The entity was founded in the 2023 fiscal year.
13 Control and profit transfer agreement.
14
Exemption pursuant to section 264, paragraph 3, German Commercial Code from the preparation of a management report and from the audit obligation pursuant to section 264 et seq. German Commercial Code and from the obligations
to disclose the annual financial statements pursuant to section 325 German Commercial Code.
15 Exemption pursuant to section 264, paragraph 3, German Commercial Code from the obligations to disclose the annual financial statements pursuant to section 325 German Commercial Code.
16 Exemption pursuant to section 264b German Commercial Code from the obligations to prepare a management report as well as notes and from the obligations to disclose the annual financial statements.
17 Exemption pursuant to section 264b German Commercial Code from the obligations to prepare a management report, from the audit obligation, and from the obligation to disclose the annual financial statements.
18 Because criteria pursuant to section 285, No. 11, German Commercial Code are not met, investments in the affiliate are not disclosed.
19 Non-stock entity. Disclosure of ownership in percent does not apply.
20 The entity owns land of which Infineon is the sole tenant.
21
Infineon accounts for its interest using the equity method because Infineon has significant influence due to the right to hold a supervisory board position in combination with comprehensive minority rights and certain contractual rights
in the context of development cooperation.
22 Infineon accounts for its interest using the equity method as Infineon lacks controlling influence due to certain contractual participation rights of the co-shareholder.
23 Consolidated financial statements.
24 IFRS figures.
170
Infineon | Annual Report 2023
Further information
Combined Management Report
Management Board and Supervisory Board
Notes to the Consolidated Financial Statements
Consolidated Financial Statements
172.
Neubiberg, 21 November2023
Infineon Technologies AG
Management Board
Jochen Hanebeck Elke Reichart Dr. Sven Schneider
Andreas Urschitz Dr. Rutger Wijburg
171
Infineon | Annual Report 2023
Further information
Combined Management Report
Management Board and Supervisory Board
Notes to the Consolidated Financial Statements
Consolidated Financial Statements
173.
Further information
Responsibility Statement
bythe Management Board
To the best of our knowledge, and in accordance with the applicable reporting
principles, the Consolidated Financial Statements give a true and fair view of the
assets, liabilities, financial position and profit or loss of the Group, and the Combined
Management Report, which is combined with the Management Report of Infineon
Technologies AG, includes a fair review of the development and performance of the
business and the position of the Group, together with a description of the principal
opportunities and risks associated with the expected development of the Group.
Neubiberg, 23 November 2023
Infineon Technologies AG
Management Board
Jochen Hanebeck Elke Reichart Dr. Sven Schneider
Andreas Urschitz Dr. Rutger Wijburg
172
Infineon | Annual Report 2023
Consolidated Financial Statements
Combined Management Report
Management Board and Supervisory Board Further information
Responsibility Statement
by the Management Board
174.
To Infineon TechnologiesAG, Neubiberg
Report on the Audit of the Consolidated Financial
Statements and of the Group Management Report
Opinions
We have audited the consolidated financial statements of Infineon Technologies AG,
Neubiberg, and its subsidiaries (the Group), which comprise the consolidated state-
ment of financial position as at 30 September 2023, and the consolidated statement
of profit or loss, consolidated statement of comprehensive income, consolidated state-
ment of changes in equity and consolidated statement of cash flows for the financial
year from 1 October 2022 to 30 September 2023, and notes to the consolidated financial
statements, including a summary of significant accounting policies. In addition, we
have audited the combined management report of Infineon Technologies AG and of
the Group (hereinafter: the “group management report”) for the financial year from
1 October 2022 to 30 September 2023.
In accordance with German legal requirements, we have not audited the content
of those components of the group management report specified in the “Other Infor-
mation” section of our auditor’s report.
The group management report contains cross-references that are not required by
law and which are marked as unaudited. In accordance with German legal require-
ments, we have not audited the cross-references and the information to which the
cross-references refer.
In our opinion, on the basis of the knowledge obtained in the audit,
›
the accompanying consolidated financial statements comply, in all material respects,
with the IFRSs as adopted by the EU, and the additional requirements of German
commercial law pursuant to Section 315e (1) HGB [Handelsgesetzbuch: German
Commercial Code] and, in compliance with these requirements, give a true and fair
view of the assets, liabilities, and financial position of the Group as at 30 Septem-
ber 2023, and of its financial performance for the financial year from 1 October 2022
to 30 September 2023, and
›
the accompanying group management report as a whole provides an appropriate
view of the Group’s position. In all material respects, this group management report
is consistent with the consolidated financial statements, complies with German
legal requirements and appropriately presents the opportunities and risks of future
development. Our opinion on the group management report does not cover the
content of those components of the group management report specified in the
“Other Information” section of the auditor’s report. The group management report
contains cross-references that are not required by law and which are marked as
unaudited. Our audit opinion does not extend to the cross-references and the
information to which the cross-references refer.
Pursuant to Section 322 (3) sentence 1 HGB, we declare that our audit has not led
to any reservations relating to the legal compliance of the consolidated financial
statements and of the group management report.
Independent Auditor’s Report
For the Consolidated Financial Statements and Group Management Report we have issued an unqualified auditor’s report.
The English language text below is a translation of the auditor’s report. The original German text shall prevail in the event of any discrepancies
between the English translation and the German original. We do not accept any liability for the use of, or reliance on, the English translation
or for any errors or misunderstandings that may derive from the translation.
173
Infineon | Annual Report 2023
Consolidated Financial Statements
Combined Management Report
Management Board and Supervisory Board Further information
Independent Auditor’s Report
175.
Basis for theOpinions
We conducted our audit of the consolidated financial statements and of the group
management report in accordance with Section 317 HGB and the EU Audit Regulation
No 537/2014 (referred to subsequently as “EU Audit Regulation”) and in compliance
with German Generally Accepted Standards for Financial Statement Audits promulgated
by the Institut der Wirtschaftsprüfer [Institute of Public Auditors in Germany] (IDW).
Our responsibilities under those requirements and principles are further described in
the “Auditor’s Responsibilities for the Audit of the Consolidated Financial Statements
and of the Group Management Report” section of our auditor’s report. We are inde-
pendent of the group entities in accordance with the requirements of European law
and German commercial and professional law, and we have fulfilled our other German
professional responsibilities in accordance with these requirements. In addition, in
accordance with Article 10 (2)(f) of the EU Audit Regulation, we declare that we have
not provided non-audit services prohibited under Article 5 (1) of the EU Audit Regula-
tion. We believe that the evidence we have obtained is sufficient and appropriate to
provide a basis for our opinions on the consolidated financial statements and on the
group management report.
Key Audit Matters in the Audit of the Consolidated
Financial Statements
Key audit matters are those matters that, in our professional judgement, were of most
significance in our audit of the consolidated financial statements for the financial
year from 1 October 2022 to 30 September 2023. These matters were addressed in
the context of our audit of the consolidated financial statements as a whole, and in
forming our opinion thereon, we do not provide a separate opinion on these matters.
Impairment testing of goodwill
Please refer to note 2 in the notes to the consolidated financial statements for infor-
mation on the accounting policies applied and the assumptions used. Information on
the value of goodwill can be found under note 14.
The financial statement risk
The consolidated financial statements of Infineon Technologies AG reported goodwill
in the amount of EUR 6,547 million as at 30 September 2023. At 23% of the balance
sheet total, goodwill accounts for a considerable share of total assets.
Infineon tests goodwill for impairment in accordance with IAS 36 at the operating
segment level annually in the fourth quarter of the financial year ending 30 Septem-
ber, as well as in cases where events or changes to the prevailing conditions provide
indications that the recoverable amount may have fallen below the carrying amount.
The recoverable amount is the higher of fair value less costs of disposal and value
in use. Goodwill is impaired if the carrying amount of the operating segment to which
the goodwill is allocated exceeds the recoverable amount of this unit. Infineon
determines the recoverable amount of the respective cash-generating unit to which
goodwill was allocated according to value in use.
Impairment testing of goodwill is complex and based on a range of assumptions that
require judgement. Such judgement includes, among other elements, the assumptions
found in the adopted corporate planning for a period of five years, such as revenue
growth and margins, assumed long-term growth rates in perpetuity, which consider
a steady state taking into account the synergy effects of the acquisition of Cypress
Semiconductor Corporation, and the underlying discount rates.
As a result of the impairment test performed, the Company did not identify any
need to recognise impairment losses. In light of the discretionary judgement of the
assumptions underlying impairment testing, there is the risk for the consolidated
financial statements that a required impairment was not recognised. There is also the
risk that the related disclosures in the notes are not appropriate.
Our audit approach
When assessing the impairment test, we also assessed the appropriateness of key
assumptions. We assessed the Company’s calculation method and selected assump-
tions in terms of their appropriateness with the help of our valuation specialists.
For this purpose, we checked that corporate planning was updated for the next five
years and adopted by the Management Board. Using elements selected on the basis
of risk, we had the staff responsible for preparing corporate planning explain to us in
particular revenue and margin performance, as well as the long-term growth rates
assumed in perpetuity, which consider a steady state taking into account the synergy
effects of the acquisition of Cypress Semiconductor Corporation. In this context,
revenue performance in particular was critically reviewed and assessed based on
publicly available market estimates and information to determine whether the revenue
174
Infineon | Annual Report 2023
Consolidated Financial Statements
Combined Management Report
Management Board and Supervisory Board Further information
Independent Auditor’s Report
176.
performance used formeasurement is within a reasonable range. We also confirmed
the accuracy of the Company’s previous forecasts by comparing the budgets of
previous financial years with actual results and by analysing deviations.
We checked how the discount rates used were derived and their amounts. For this
purpose, we compared the assumptions and data underlying the discount rates,
in particular the risk-free rate, the market risk premium and the beta factor, with our
own assumptions and publicly available data.
To ensure the computational accuracy of the valuation method used, we verified the
Company’s calculations on the basis of selected risk-based elements.
In order to take account of the existing forecast uncertainty and the earlier cut-off
date selected for impairment testing, the Company examined the effects of possible
changes in the discount rates, revenue and margin performance and the long-term
growth rate in perpetuity on the value in use by calculating alternative scenarios
and comparing these with its own reported figures (sensitivity analysis). We have
assessed this analysis. In order to take into account the earlier cut-off date for impair-
ment testing, we also assessed the impact of events until 30 September 2023 on
impairment testing.
Finally, we assessed whether the disclosures in the notes regarding impairment
testing of goodwill are appropriate.
Our observations
The calculation method used for impairment testing of goodwill is appropriate and
in line with the accounting policies to be applied.
The Company’s assumptions used for measurement are appropriate.
The related disclosures in the notes are appropriate.
Other information
The Management Board and the Supervisory Board, respectively, are responsible for
the other information. The other information comprises the following components of
the group management report, whose content was not audited:
›
the separate combined non-financial report of the Company and Group, which is
referred to in the group management report
›
the combined corporate governance statement for the Company and the Group
referred to in the group management report, and
›
information extraneous to management reports and marked as unaudited.
The other information also includes the remaining parts of the annual report. The
other information does not include the consolidated financial statements, the group
management report information audited for content and our auditor’s report thereon.
Our opinions on the consolidated financial statements and on the group management
report do not cover the other information, and consequently we do not express an
opinion or any other form of assurance conclusion thereon.
In connection with our audit, our responsibility is to read the other information and,
in so doing, to consider whether the other information
›
is materially inconsistent with the consolidated financial statements, with the
group management report information audited for content or our knowledge
obtained in the audit, or
›
otherwise appears to be materially misstated.
If, based on the work we have performed, we conclude that there is a material
misstatement of this other information, we are required to report that fact. We have
nothing to report in this regard.
175
Infineon | Annual Report 2023
Consolidated Financial Statements
Combined Management Report
Management Board and Supervisory Board Further information
Independent Auditor’s Report
177.
Responsibilities of theManagement Board and the
Supervisory Board for the Consolidated Financial Statements
and the Group Management Report
The Management Board is responsible for the preparation of consolidated financial
statements that comply, in all material respects, with IFRSs as adopted by the EU and
the additional requirements of German commercial law pursuant to Section 315e (1)
HGB and that the consolidated financial statements, in compliance with these require-
ments, give a true and fair view of the assets, liabilities, financial position, and financial
performance of the Group. In addition, the Management Board is responsible for such
internal control as they have determined necessary to enable the preparation of con-
solidated financial statements that are free from material misstatement, whether due
to fraud (i.e., fraudulent financial reporting and misappropriation of assets) or error.
In preparing the consolidated financial statements, the Management Board is respon-
sible for assessing the Group’s ability to continue as a going concern. They also have
the responsibility for disclosing, as applicable, matters related to going concern. In
addition, it is responsible for financial reporting based on the going concern basis of
accounting unless there is an intention to liquidate the Group or to cease operations,
or there is no realistic alternative but to do so.
Furthermore, the Management Board is responsible for the preparation of the group
management report that, as a whole, provides an appropriate view of the Group’s
position and is, in all material respects, consistent with the consolidated financial
statements, complies with German legal requirements, and appropriately presents
the opportunities and risks of future development. In addition, the Management Board
is responsible for such arrangements and measures (systems) as they have consid-
ered necessary to enable the preparation of a group management report that is in
accordance with the applicable German legal requirements, and to be able to provide
sufficient appropriate evidence for the assertions in the group management report.
The Supervisory Board is responsible for overseeing the Group’s financial reporting
process for the preparation of the consolidated financial statements and of the group
management report.
Auditor’s Responsibilities for the Audit of the Consolidated
Financial Statements and of the Group Management Report
Our objectives are to obtain reasonable assurance about whether the consolidated
financial statements as a whole are free from material misstatement, whether due
to fraud or error, and whether the group management report as a whole provides an
appropriate view of the Group’s position and, in all material respects, is consistent
with the consolidated financial statements and the knowledge obtained in the audit,
complies with the German legal requirements and appropriately presents the oppor-
tunities and risks of future development, as well as to issue an auditor’s report that
includes our opinions on the consolidated financial statements and on the group
management report.
Reasonable assurance is a high level of assurance, but is not a guarantee that an audit
conducted in accordance with Section 317 HGB and the EU Audit Regulation and in
compliance with German Generally Accepted Standards for Financial Statement Audits
promulgated by the Institut der Wirtschaftsprüfer (IDW) will always detect a material
misstatement. Misstatements can arise from fraud or error and are considered material
if, individually or in the aggregate, they could reasonably be expected to influence
the economic decisions of users taken on the basis of these consolidated financial
statements and this group management report.
We exercise professional judgement and maintain professional scepticism throughout
the audit. We also:
›
Identify and assess the risks of material misstatement of the consolidated financial
statements and of the group management report, whether due to fraud or error,
design and perform audit procedures responsive to those risks, and obtain audit
evidence that is sufficient and appropriate to provide a basis for our opinions. The
risk of not detecting a material misstatement resulting from fraud is higher than
the risk of not detecting a material misstatement resulting from error, as fraud
may involve collusion, forgery, intentional omissions, misrepresentations, or the
override of internal controls.
176
Infineon | Annual Report 2023
Consolidated Financial Statements
Combined Management Report
Management Board and Supervisory Board Further information
Independent Auditor’s Report
178.
›
Obtain anunderstanding of internal control relevant to the audit of the consolidated
financial statements and of arrangements and measures (systems) relevant to the
audit of the group management report in order to design audit procedures that are
appropriate in the circumstances, but not for the purpose of expressing an opinion
on the effectiveness of these systems.
›
Evaluate the appropriateness of accounting policies used by the Management
Board and the reasonableness of estimates made by the Management Board and
related disclosures.
›
Conclude on the appropriateness of the Management Board’s use of the going
concern basis of accounting and, based on the audit evidence obtained, whether
a material uncertainty exists related to events or conditions that may cast significant
doubt on the Group’s ability to continue as a going concern. If we conclude that a
material uncertainty exists, we are required to draw attention in the auditor’s report
to the related disclosures in the consolidated financial statements and in the group
management report or, if such disclosures are inadequate, to modify our respec-
tive opinions. Our conclusions are based on the audit evidence obtained up to the
date of our auditor’s report. However, future events or conditions may cause the
Group to cease to be able to continue as a going concern.
›
Evaluate the overall presentation, structure and content of the consolidated
financial statements, including the disclosures, and whether the consolidated
financial statements present the underlying transactions and events in a manner
that the consolidated financial statements give a true and fair view of the assets,
liabilities, financial position and financial performance of the Group in compliance
with IFRSs as adopted by the EU and the additional requirements of German
commercial law pursuant to Section 315e (1) HGB.
›
Obtain sufficient appropriate audit evidence regarding the financial information
of the entities or business activities within the Group to express opinions on the
consolidated financial statements and on the group management report. We are
responsible for the direction, supervision and performance of the group audit.
We remain solely responsible for our opinions.
›
Evaluate the consistency of the group management report with the consolidated
financial statements, its conformity with [German] law, and the view of the Group’s
position it provides.
›
Perform audit procedures on the prospective information presented by the
Management Board in the group management report. On the basis of sufficient
appropriate audit evidence we evaluate, in particular, the significant assumptions
used by the Management Board as a basis for the prospective information, and
evaluate the proper derivation of the prospective information from these assump-
tions. We do not express a separate opinion on the prospective information and
on the assumptions used as a basis. There is a substantial unavoidable risk that
future events will differ materially from the prospective information.
We communicate with those charged with governance regarding, among other matters,
the planned scope and timing of the audit and significant audit findings, including
any significant deficiencies in internal control that we identify during our audit.
We also provide those charged with governance with a statement that we have
complied with the relevant independence requirements, and communicate with
them all relationships and other matters that may reasonably be thought to bear on
our independence, and where applicable, the actions taken or safeguards applied
to eliminate independence threats.
177
Infineon | Annual Report 2023
Consolidated Financial Statements
Combined Management Report
Management Board and Supervisory Board Further information
Independent Auditor’s Report
179.
From the matterscommunicated with those charged with governance, we determine
those matters that were of most significance in the audit of the consolidated financial
statements of the current period and are therefore the key audit matters. We describe
these matters in our auditor’s report unless law or regulation precludes public disclo-
sure about the matter.
Other Legal and Regulatory Requirements
Report on the Assurance on the Electronic Rendering of the
Consolidated Financial Statements and the Group Management
Report Prepared for Publication Purposes in Accordance with
Section 317 (3a) HGB
We have performed assurance work in accordance with Section 317 (3a) HGB to obtain
reasonable assurance about whether the rendering of the consolidated financial
statements and the group management report (hereinafter the “ESEF documents”)
contained in the electronic file „Infineon_Technologies_AG_KA+KLB_ESEF_2023-
09-30.zip“ (SHA256-Hashwert: 2e23e589e5a7223309fd39b953f18c24f0f95c79648
b6d38651487c0207649db) made available and prepared for publication purposes
complies in all material respects with the requirements of Section 328 (1) HGB for
the electronic reporting format (“ESEF format”). In accordance with German legal
requirements, this assurance work extends only to the conversion of the information
contained in the consolidated financial statements and the group management report
into the ESEF format and therefore relates neither to the information contained in
these renderings nor to any other information contained in the file identified above.
In our opinion, the rendering of the consolidated financial statements and the group
management report contained in the electronic file made available, identified above
and prepared for publication purposes complies in all material respects with the
requirements of Section 328 (1) HGB for the electronic reporting format. Beyond this
assurance opinion and our audit opinion on the accompanying consolidated financial
statements and the accompanying group management report for the financial year
from 1 October 2022 to 30 September 2023 contained in the “Report on the Audit of
the Consolidated Financial Statements and the Group Management Report” above,
we do not express any assurance opinion on the information contained within these
renderings or on the other information contained in the file identified above.
We conducted our assurance work on the rendering of the consolidated financial
statements and the group management report contained in the file made available
and identified above in accordance with Section 317 (3a) HGB and the IDW Assurance
Standard: Assurance Work on the Electronic Rendering of Financial Statements and
Management Reports Prepared for Publication Purposes in Accordance with Section
317 (3a) HGB (IDW AsS 410 (06.2022)). Our responsibility in accordance therewith is
further described below. Our audit firm applies the IDW Standard on Quality Manage-
ment 1: Requirements for Quality Management in Audit Firms (IDW QS 1).
The Company’s Management Board is responsible for the preparation of the ESEF
documents including the electronic rendering of the consolidated financial statements
and the group management report in accordance with Section 328 (1) sentence 4
item 1 HGB and for the tagging of the consolidated financial statements in accordance
with Section 328 (1) sentence 4 item 2 HGB.
In addition, the Company’s Management Board is responsible for such internal control
that it has considered necessary to enable the preparation of ESEF documents that
are free from material intentional or unintentional non-compliance with the require-
ments of Section 328 (1) HGB for the electronic reporting format.
The Supervisory Board is responsible for overseeing the process of preparing the
ESEF documents as part of the financial reporting process.
Our objective is to obtain reasonable assurance about whether the ESEF documents
are free from material intentional or unintentional non-compliance with the require-
ments of Section 328 (1) HGB. We exercise professional judgement and maintain
professional scepticism throughout the assurance work. We also:
›
Identify and assess the risks of material intentional or unintentional non-compliance
with the requirements of Section 328 (1) HGB, design and perform assurance pro-
cedures responsive to those risks, and obtain assurance evidence that is sufficient
and appropriate to provide a basis for our assurance opinion.
178
Infineon | Annual Report 2023
Consolidated Financial Statements
Combined Management Report
Management Board and Supervisory Board Further information
Independent Auditor’s Report
180.
›
Obtain anunderstanding of internal control relevant to the assurance on the ESEF
documents in order to design assurance procedures that are appropriate in the
circumstances, but not for the purpose of expressing an assurance opinion on the
effectiveness of these controls.
›
Evaluate the technical validity of the ESEF documents, i.e. whether the file made
available containing the ESEF documents meets the requirements of Commission
Delegated Regulation (EU) 2019/815, as amended as at the reporting date, on the
technical specification for this electronic file.
›
Evaluate whether the ESEF documents provide an XHTML rendering with content
equivalent to the audited consolidated financial statements and the audited group
management report.
›
Evaluate whether the tagging of the ESEF documents with Inline XBRL technology
(iXBRL) in accordance with the requirements of Articles 4 and 6 of Commission
Delegated Regulation (EU) 2019/815, as amended as at the reporting date, enables
an appropriate and complete machine-readable XBRL copy of the XHTML rendering.
Further information pursuant to Article 10 of the EU Audit Regulation
We were elected as group auditor at the Annual General Meeting on 16 February 2023.
We were engaged by the Supervisory Board on 3 May 2023. In compliance with the
transitional provision of Article 41 (2) of the EU Audit Regulation, we have been, with-
out interruption since short financial year 1999 (1 April to 30 September 1999), the
group auditor of Infineon Technologies AG, which without interruption since its IPO
in 2000 has fulfilled the definition of a public interest entity within the meaning of
Section 316a sentence 2 HGB.
We declare that the opinions expressed in this auditor’s report are consistent with
the additional report to the Audit Committee pursuant to Article 11 of the EU Audit
Regulation (long-form audit report).
Other matter – Use of the Auditor’s Report
Our auditor’s report must always be read together with the audited consolidated
financial statements and the audited group management report as well as the exam-
ined ESEF documents. The consolidated financial statements and group management
report converted to the ESEF format – including the versions to be entered in the
company register – are merely electronic renderings of the audited consolidated
financial statements and the audited group management report and do not take their
place. In particular, the ESEF report and our assurance opinion contained therein
are to be used solely together with the examined ESEF documents made available in
electronic form.
German Public Auditor
Responsible for the Engagement
The German Public Auditor responsible for the engagement is Martin Schmitt.
Munich, 23 November 2023
KPMG AG
Wirtschaftsprüfungsgesellschaft
[Original German version signed by:]
Huber-Straßer Schmitt
Wirtschaftsprüferin Wirtschaftsprüfer
[German Public Auditor] [German Public Auditor]
179
Infineon | Annual Report 2023
Consolidated Financial Statements
Combined Management Report
Management Board and Supervisory Board Further information
Independent Auditor’s Report
181.
Applications and productrange
Automotive
Applications
Assistance systems and safety systems
› ABS (Anti-blocking system)
› Airbag
› Automatic parking
› E/E architecture
– Power distribution
– On-board network
› Blind spot detection
› Cruise control
› Distance control
› Electronic chassis control
› Electronic power steering
› Emergency braking assistant
› ESP (Electronic Stability Program)
› Lane departure warning system
› Tire pressure monitoring system
Comfort electronics
› Air conditioning
› Body control units
› Door electronics
› Electronic seat adjustment
› Hatch door
› Lighting
› Power window
› Steering
› Sunroof
› Suspension
› Windshield wipers
Infotainment
› Connectivity for in-cabin infotainment
› Digital instrument cluster
Powertrain
› Battery charging control
› Battery management
› Combustion engine control
› DC-DC converter
› Electric motor control
› Generator control
› Start-stop system
› Thermal management
› Transmission control
Security
› Communication
– Car-to-car
– Car-to-infrastructure
› Original spare parts authentication
› Protection against manipulation (e.g., odometer)
› Protection against software manipulation
› Remote keyless entry
› Tachograph
Product range
›
32-bit automotive microcontrollers for powertrain,
safety, driver assistance systems, infotainment and
digital display systems
› Discrete power semiconductors
› IGBT modules
› Industrial microcontrollers
› Memory ICs (NOR flash, SRAM, nvSRAM, F-RAM)
› Power ICs
›
Sensors (3D-ToF, pressure, magnetic,
77 GHz radar, current)
› SiC (diodes, MOSFETs, modules)
› Transceivers (CAN, CAN FD, LIN, Ethernet, FlexRay™)
› Voltage regulators
180
Infineon | Annual Report 2023
Consolidated Financial Statements
Combined Management Report
Management Board and Supervisory Board Further information
Applications and product range
Automotive
ATV
182.
Green Industrial Power
Applications
Energygeneration
› Photovoltaic systems
› Wind power turbines
Energy storage
› Grid stability
› Home usage
› Urban district
› Wall box
Energy transmission
› FACTS (Flexible AC Transmission Systems)
› Offshore wind farm HVDC transmission lines
› Overland HVDC transmission lines
Home appliances
› Air conditioners
› Dishwashers
› Induction cooktops
› Microwave ovens
› Refrigerators
› Vacuum cleaners
› Washing machines
Industrial drives1
› Air conditioning technology
› Automation technology
› Drives technologies
› Elevator systems
› Escalators
› Materials handling
› Oil derricks
› Pipelines
› Rolling mills
Industrial power supplies
› Auxiliary power supplies
› Battery chargers
› Charging stations for electric vehicles
› Home energy storage
› Uninterruptable power supplies
Industrial robotics
Industrial vehicles
› Agricultural vehicles
› Construction vehicles
› Electric delivery vehicles
› Forklifts
› Hybrid buses
Traction
› High-speed trains
› Locomotives
› Metro trains
› Trams
1 Including motors, compressors, pumps and fans.
Product range
› Bare die business
› Discrete IGBTs
› Driver ICs
›
IGBT modules (low-power, medium-power,
high-power)
› IGBT module solutions, including IGBT stacks
›
Intelligent IGBT modules with integrated
control unit, driver and switch
› SiC diodes, SiC MOSFETs, SiC modules
181
Infineon | Annual Report 2023
Consolidated Financial Statements
Combined Management Report
Management Board and Supervisory Board Further information
Applications and product range
Green Industrial Power
GIP
183.
Power SensorSystems
Applications
Audio amplifiers
› Battery-powered loudspeakers
› Smart speakers
Automotive electronics
› Blind spot detection
› In-cabin USB PD charging
› Onboard charger
› Power train for low-speed electric vehicles
BLDC motor
› Battery-powered gardening equipment, e.g.,
– Hedge trimmers
– Lawn mowers
› Battery-powered home appliances, e.g.,
– Vacuum cleaners
› Battery-powered power tools, e.g.,
– Cordless screwdrivers
– Drills
– Power saws
› eBikes
› eScooters
› Multi-copters
Cellular communications infrastructure
› Base stations
Charging stations for electric vehicles
Human-machine interaction
IoT
› Communications
› Sensors
› Smart speakers
› Voice control
LED and conventional lighting systems
Microinverter for roof-top systems
Mobile devices
› Activity trackers
› Health care trackers
› Navigation devices
› Smartphones
› Tablets
Power management (chargers, adapters, power
supplies, DC-DC conversion, wireless charging)
› Consumer electronics
› Data centers
› Home appliances
› Mobile devices
› PCs and notebooks
› Servers
› Telecommunication technology
Special applications in harsh environments
› Aerospace systems
› Aviation technologies
› Defense technologies
› Oil and gas exploration
› Submarine telecommunications
Product range
› 3D ToF sensors
› Chips for gas sensors
› Chips for MEMS microphones
› Chips for pressure sensors
› Control ICs for power switches
› Customized chips (ASICs)
›
Discrete low-voltage, mid-voltage and
high-voltage power MOSFETs (Si-based)
› GaN power switches
› GPS low-noise amplifiers
› Low-voltage and high-voltage driver ICs
› Radar sensor ICs (24 GHz, 60 GHz)
› RF antenna switches
› RF power transistors
› SiC diodes, SiC MOSFETs
› TVS (transient voltage suppressor) diodes
› USB controllers
182
Infineon | Annual Report 2023
Consolidated Financial Statements
Combined Management Report
Management Board and Supervisory Board Further information
Applications and product range
Power Sensor Systems
PSS
184.
Connected Secure Systems
Applications
Authentication
›Accessories
› Brand protection
› Game consoles
› Industrial control systems
› Printer cartridges
Automotive
› Connected vehicles
– eCall
– Car-to-car communications
– Car-to-infrastructure communications
› Electronic toll collection (toll collect)
› In-cabin infotainment
› Protection against manipulation (e.g., tachographs)
Consumer electronics
› Game consoles
› Remote control
› Smart watches and activity trackers
Government identification documents
› Driver’s licenses
› Healthcare cards
› National identity cards
› Passports
› Social insurance cards
IoT
› Industry 4.0
› IT equipment
› Smart city
› Smart home
Mobile communications
› Embedded SIM
(machine-to-machine communication)
– Consumer applications
– IoT applications
› SIM cards
Payment systems
› Credit/debit cards
› Mobile payment
› NFC-based contactless payment
Ticketing, access control
Trusted computing
Product range
› Connectivity solutions (Wi-Fi, Bluetooth, BLE, UWB)
›
Embedded security controllers (Embedded SIM,
Authentication, Trusted Computing)
›
Microcontroller for consumer electronics
and industrial applications
›
Security controllers (contact-based, contactless,
dual-interface)
183
Infineon | Annual Report 2023
Consolidated Financial Statements
Combined Management Report
Management Board and Supervisory Board Further information
Applications and product range
Connected Secure Systems
CSS
185.
Chart overview Listof abbreviations
Page
C01
The main stages of the semiconductor value chain 22
C02 Core competencies in the segments 24
C03 RD expenses 35
C04
Revenue and Segment Result of the
Automotive segment 45
C05
Revenue and Segment Result of the
Green Industrial Power segment 46
C06
Revenue and Segment Result of the
Power Sensor Systems segment 47
C07
Revenue and Segment Result of the
Connected Secure Systems segment 49
C08 Revenue by segment 50
C09 Financial debt by currency 53
C10
Development of the Infineon Technologies AG share
compared to Germany’s DAX Index, the Philadelphia
Semiconductor Index (SOX) and the Dow Jones
US Semiconductor Index for the 2023 fiscal year
(daily closing prices) 59
C11
Shareholder structure as of the end of the 2023 fiscal year 59
C12
Dividend per share for the 2014 to 2023 fiscal years 60
C13 Risk assessment matrix 66
ADAS advanced driver assistance system
AI artificial intelligence
ASIC application-specific integrated circuit
BLDC brushless direct current
BLE bluetooth low energy
CSR corporate social responsibility
DC-DC direct current to direct current conversion
DRAM dynamic random access memory
GaN gallium nitride
IC integrated circuit
IGBT insulated gate bipolar transistor
IoT Internet of Things
LED light-emitting diode
MEMS micro-electromechanical system
ML machine learning
MOSFET metal-oxide-semiconductor field-effect transistor
NAND not AND
NFC near-field communication
PSoC programmable system-on-chip
RF radio frequency
Si silicon
SiC silicon carbide
ToF time-of-flight
USB universal serial bus
Wi-Fi wireless fidelity
184
Infineon | Annual Report 2023
Consolidated Financial Statements
Combined Management Report
Management Board and Supervisory Board Further information
Chart overview | List of abbreviations
186.
Financial calendar 2024
February
6
Publicationof
first quarter 20241
results
1 Preliminary
February
23
Annual General
Meeting 2024
virtual
May
7
Publication of
second quarter 20241
results
August
5
Publication of
third quarter 20241
results
November
12
Publication of
fourth quarter and
fiscal year 20241
results
Tuesday Friday Tuesday Monday Tuesday
185
Infineon | Annual Report 2023
Consolidated Financial Statements
Combined Management Report
Management Board and Supervisory Board Further information
Financial calendar 2024
187.
Imprint
Published by: InfineonTechnologies AG, Neubiberg (Germany)
Editors: Investor Relations, Accounting, Consolidation Reporting
Copy deadline: 23 November 2023
Fiscal year: 1 October to 30 September
Independent auditors: KPMG AG Wirtschaftsprüfungsgesellschaft,
Munich (Germany)
Designed by: HGB Hamburger Geschäftsberichte GmbH Co. KG,
Hamburg (Germany)
Photography: Page 4: Werner Bartsch, Hamburg (Germany)
Page 10: Bernhard Schmidt, Munich (Germany)
Page 12: Tobias Eble, Munich (Germany)
Note
The following were brand names of Infineon Technologies AG
in the 2023 fiscal year:
Infineon, the Infineon logo, AURIX™, FlexRay™, ModusToolbox™, PROFET™,
PSoC™, TRAVEO™.
Public
Visit us on the web: www.infineon.com
Forward-looking statements
This report contains forward-looking statements about the business, financial condition, earnings performance
and strategy of the Infineon Group. These statements and assessments are based on assumptions and projections
resting upon currently available information and present estimates. They are subject to a multitude of uncertain-
ties and risks, many of which are wholly or partially beyond Infineon’s control. Infineon’s actual business devel-
opment, financial position, performance and strategy may therefore differ materially from the statements made
in this report.
Specific disclaimer for Omdia reports, data and information referenced in this document:
The provision of the information used by Infineon does not imply any judgment on Infineon and no liability is
assumed for the information.
Specific disclaimer for SP Global – reports, data and information referenced in this document:
The SP Global Mobility and SP Global Commodity Insights reports, data and information referenced herein
(the “SP Global Materials”) are the copyrighted property of SP Global Inc. and its subsidiaries (“SP Global”)
and represent data, research, opinions or viewpoints published by the relevant divisions within SP Global, and
are not representations of fact. The SP Global Materials speak as of the original publication date thereof and not
as of the date of this document. The information and opinions expressed in the SP Global Materials are subject
to change without notice and neither SP Global nor, as a consequence, Infineon have any duty or responsibility
to update the SP Global Materials or this publication. Moreover, while the SP Global Materials reproduced
herein are from sources considered reliable, the accuracy and completeness thereof are not warranted, nor are
the opinions and analyses which are based upon it. SP Global and the trademarks used in the Data, if any, are
trademarks of SP Global. Other trademarks appearing in the SP Global Materials are the property of SP Global
or their respective owners.
186
Infineon | Annual Report 2023
Consolidated Financial Statements
Combined Management Report
Management Board and Supervisory Board Further information
Imprint
188.
Infineon Technologies AG
Headquarters:Am Campeon 1–15, D-85579 Neubiberg near Munich (Germany), Phone +49 89 234-0
Contact for Investors and Analysts: investor.relations@infineon.com, Phone +49 89 234-26655, Fax +49 89 234-955 2987
Media Contact: media.relations@infineon.com, Phone +49 89 234-28480, Fax +49 89 234-955 4521
Visit us on the web: www.infineon.com

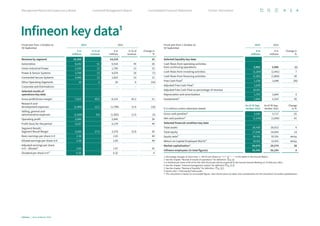
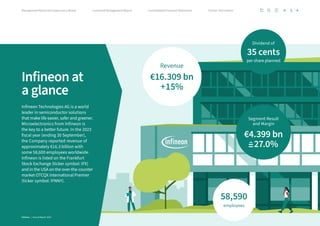

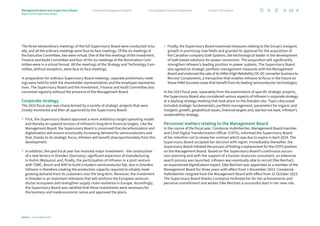
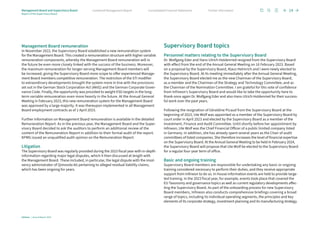
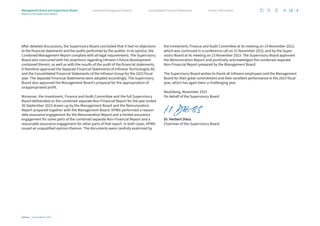
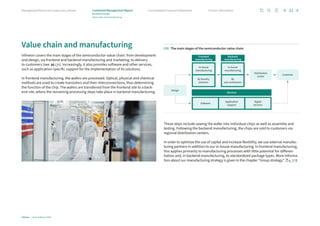
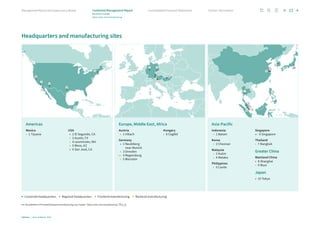
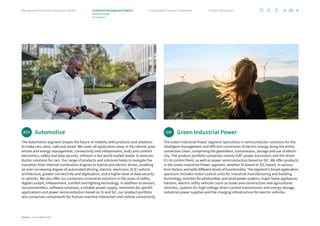


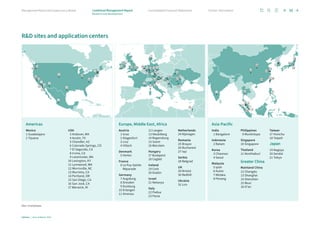


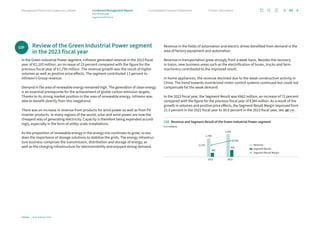
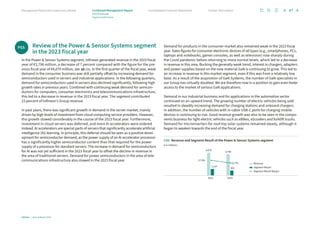
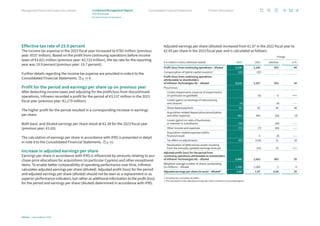
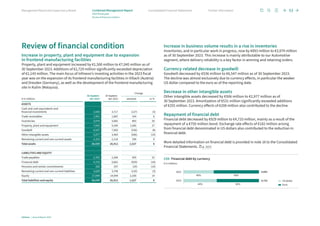
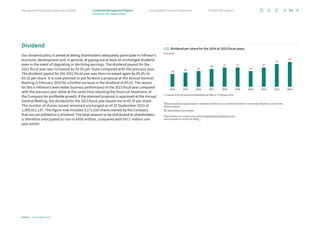
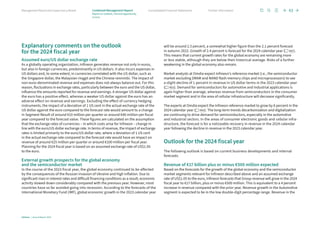
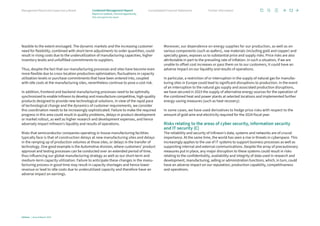
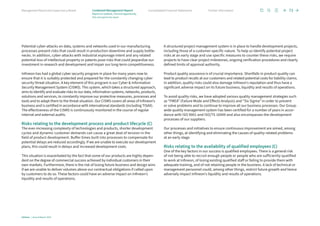
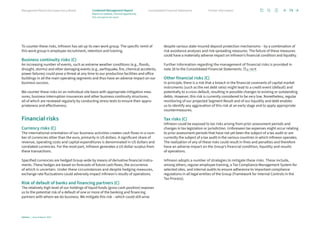
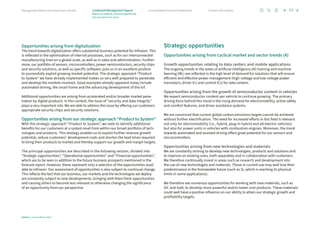
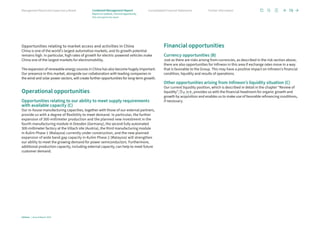

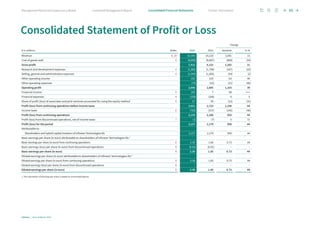
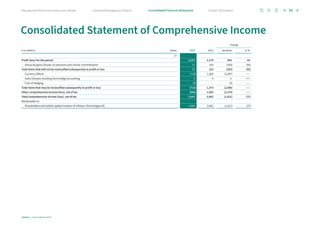
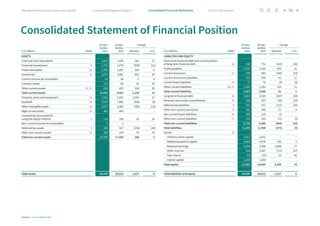
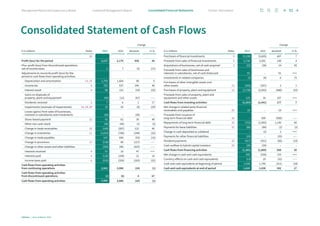

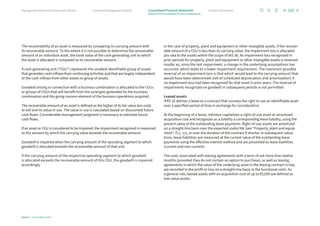
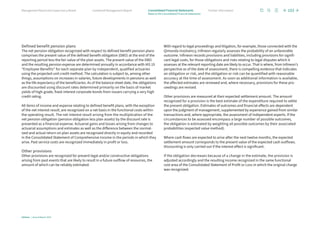
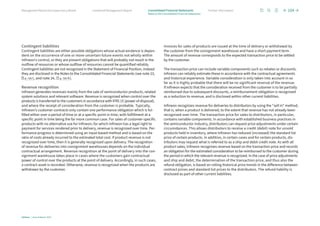
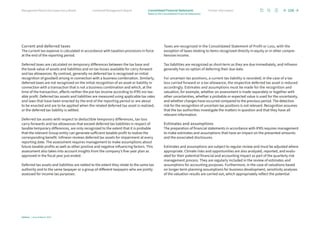
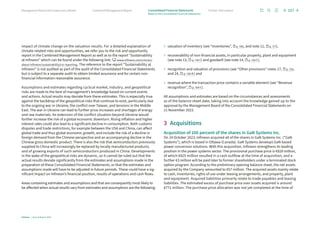
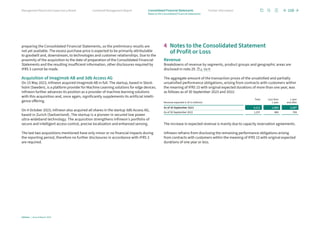
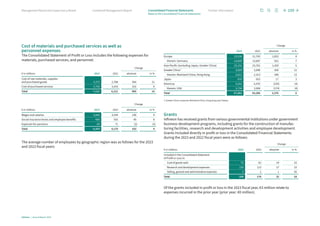
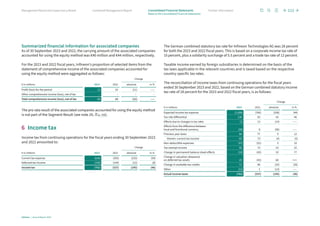
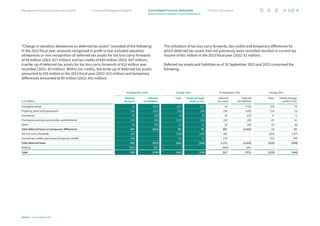
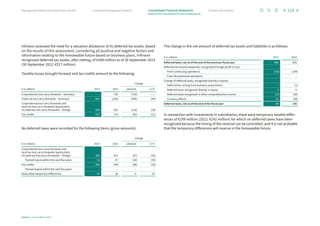
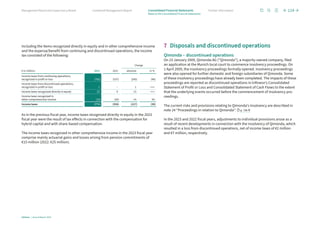
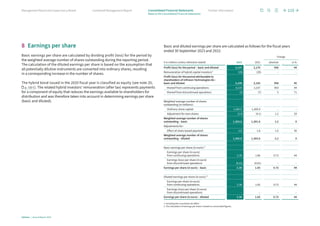
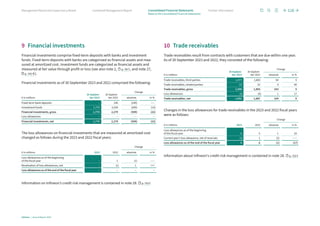
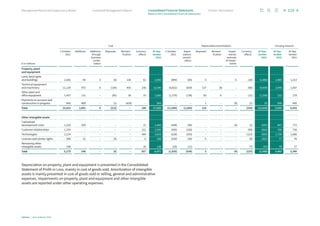
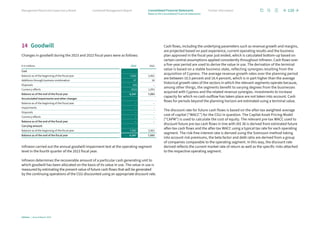
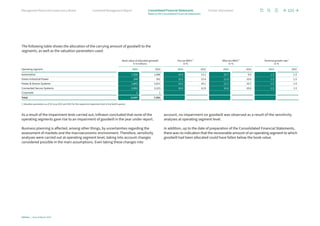
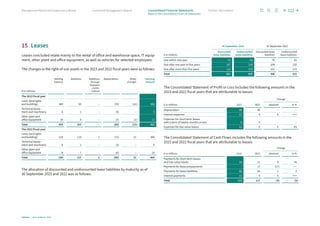
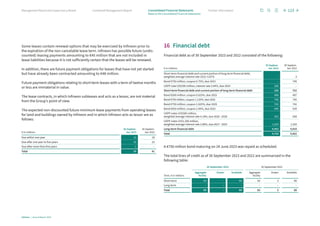
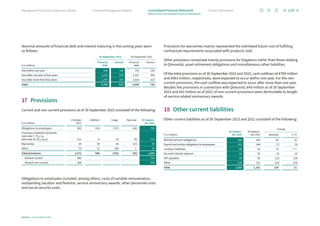
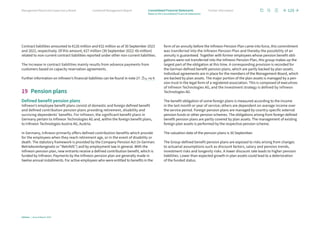
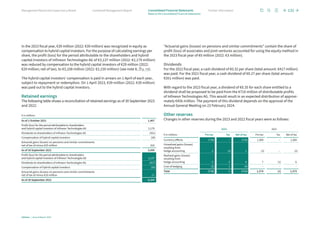
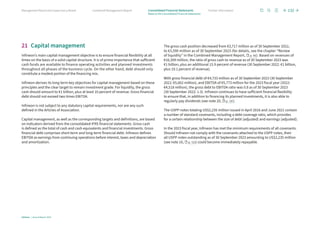
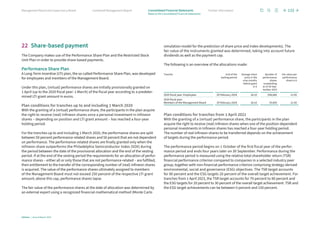
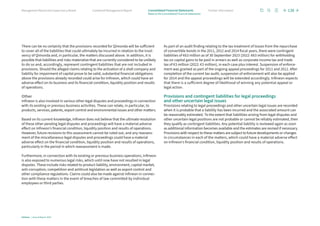
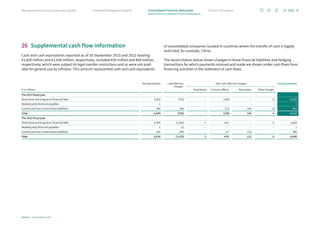
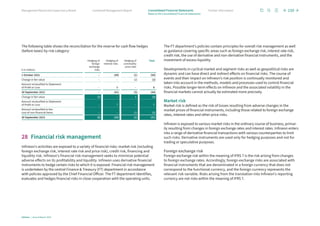
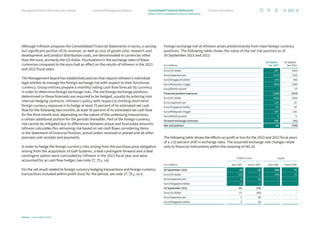
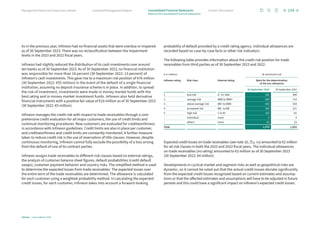
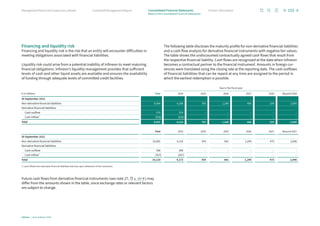
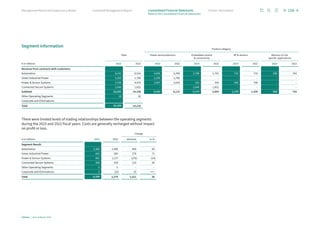
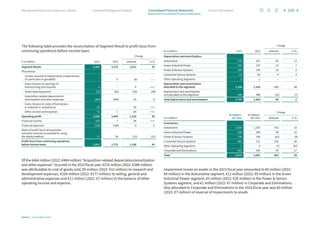
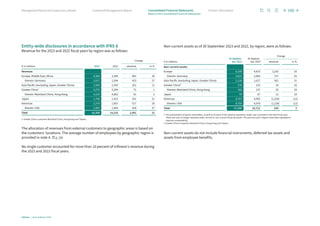
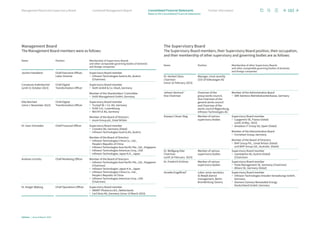
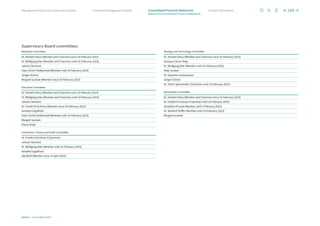
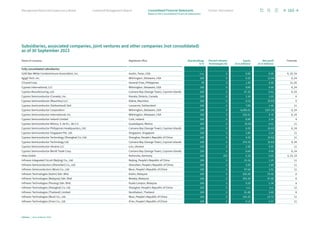
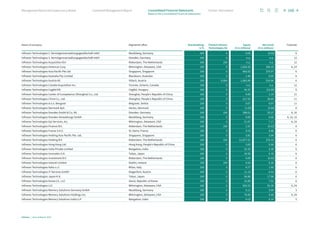
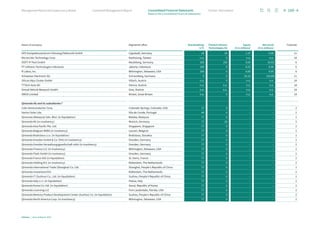
![To Infineon Technologies AG, Neubiberg
Report on the Audit of the Consolidated Financial
Statements and of the Group Management Report
Opinions
We have audited the consolidated financial statements of Infineon Technologies AG,
Neubiberg, and its subsidiaries (the Group), which comprise the consolidated state-
ment of financial position as at 30 September 2023, and the consolidated statement
of profit or loss, consolidated statement of comprehensive income, consolidated state-
ment of changes in equity and consolidated statement of cash flows for the financial
year from 1 October 2022 to 30 September 2023, and notes to the consolidated financial
statements, including a summary of significant accounting policies. In addition, we
have audited the combined management report of Infineon Technologies AG and of
the Group (hereinafter: the “group management report”) for the financial year from
1 October 2022 to 30 September 2023.
In accordance with German legal requirements, we have not audited the content
of those components of the group management report specified in the “Other Infor-
mation” section of our auditor’s report.
The group management report contains cross-references that are not required by
law and which are marked as unaudited. In accordance with German legal require-
ments, we have not audited the cross-references and the information to which the
cross-references refer.
In our opinion, on the basis of the knowledge obtained in the audit,
›
the accompanying consolidated financial statements comply, in all material respects,
with the IFRSs as adopted by the EU, and the additional requirements of German
commercial law pursuant to Section 315e (1) HGB [Handelsgesetzbuch: German
Commercial Code] and, in compliance with these requirements, give a true and fair
view of the assets, liabilities, and financial position of the Group as at 30 Septem-
ber 2023, and of its financial performance for the financial year from 1 October 2022
to 30 September 2023, and
›
the accompanying group management report as a whole provides an appropriate
view of the Group’s position. In all material respects, this group management report
is consistent with the consolidated financial statements, complies with German
legal requirements and appropriately presents the opportunities and risks of future
development. Our opinion on the group management report does not cover the
content of those components of the group management report specified in the
“Other Information” section of the auditor’s report. The group management report
contains cross-references that are not required by law and which are marked as
unaudited. Our audit opinion does not extend to the cross-references and the
information to which the cross-references refer.
Pursuant to Section 322 (3) sentence 1 HGB, we declare that our audit has not led
to any reservations relating to the legal compliance of the consolidated financial
statements and of the group management report.
Independent Auditor’s Report
For the Consolidated Financial Statements and Group Management Report we have issued an unqualified auditor’s report.
The English language text below is a translation of the auditor’s report. The original German text shall prevail in the event of any discrepancies
between the English translation and the German original. We do not accept any liability for the use of, or reliance on, the English translation
or for any errors or misunderstandings that may derive from the translation.
173
Infineon | Annual Report 2023
Consolidated Financial Statements
Combined Management Report
Management Board and Supervisory Board Further information
Independent Auditor’s Report](https://image.slidesharecdn.com/infineonannualreport2023-250304021013-01e9666e/85/Infineon-Technologies-Annual-Report-2023-174-320.jpg)
![Basis for the Opinions
We conducted our audit of the consolidated financial statements and of the group
management report in accordance with Section 317 HGB and the EU Audit Regulation
No 537/2014 (referred to subsequently as “EU Audit Regulation”) and in compliance
with German Generally Accepted Standards for Financial Statement Audits promulgated
by the Institut der Wirtschaftsprüfer [Institute of Public Auditors in Germany] (IDW).
Our responsibilities under those requirements and principles are further described in
the “Auditor’s Responsibilities for the Audit of the Consolidated Financial Statements
and of the Group Management Report” section of our auditor’s report. We are inde-
pendent of the group entities in accordance with the requirements of European law
and German commercial and professional law, and we have fulfilled our other German
professional responsibilities in accordance with these requirements. In addition, in
accordance with Article 10 (2)(f) of the EU Audit Regulation, we declare that we have
not provided non-audit services prohibited under Article 5 (1) of the EU Audit Regula-
tion. We believe that the evidence we have obtained is sufficient and appropriate to
provide a basis for our opinions on the consolidated financial statements and on the
group management report.
Key Audit Matters in the Audit of the Consolidated
Financial Statements
Key audit matters are those matters that, in our professional judgement, were of most
significance in our audit of the consolidated financial statements for the financial
year from 1 October 2022 to 30 September 2023. These matters were addressed in
the context of our audit of the consolidated financial statements as a whole, and in
forming our opinion thereon, we do not provide a separate opinion on these matters.
Impairment testing of goodwill
Please refer to note 2 in the notes to the consolidated financial statements for infor-
mation on the accounting policies applied and the assumptions used. Information on
the value of goodwill can be found under note 14.
The financial statement risk
The consolidated financial statements of Infineon Technologies AG reported goodwill
in the amount of EUR 6,547 million as at 30 September 2023. At 23% of the balance
sheet total, goodwill accounts for a considerable share of total assets.
Infineon tests goodwill for impairment in accordance with IAS 36 at the operating
segment level annually in the fourth quarter of the financial year ending 30 Septem-
ber, as well as in cases where events or changes to the prevailing conditions provide
indications that the recoverable amount may have fallen below the carrying amount.
The recoverable amount is the higher of fair value less costs of disposal and value
in use. Goodwill is impaired if the carrying amount of the operating segment to which
the goodwill is allocated exceeds the recoverable amount of this unit. Infineon
determines the recoverable amount of the respective cash-generating unit to which
goodwill was allocated according to value in use.
Impairment testing of goodwill is complex and based on a range of assumptions that
require judgement. Such judgement includes, among other elements, the assumptions
found in the adopted corporate planning for a period of five years, such as revenue
growth and margins, assumed long-term growth rates in perpetuity, which consider
a steady state taking into account the synergy effects of the acquisition of Cypress
Semiconductor Corporation, and the underlying discount rates.
As a result of the impairment test performed, the Company did not identify any
need to recognise impairment losses. In light of the discretionary judgement of the
assumptions underlying impairment testing, there is the risk for the consolidated
financial statements that a required impairment was not recognised. There is also the
risk that the related disclosures in the notes are not appropriate.
Our audit approach
When assessing the impairment test, we also assessed the appropriateness of key
assumptions. We assessed the Company’s calculation method and selected assump-
tions in terms of their appropriateness with the help of our valuation specialists.
For this purpose, we checked that corporate planning was updated for the next five
years and adopted by the Management Board. Using elements selected on the basis
of risk, we had the staff responsible for preparing corporate planning explain to us in
particular revenue and margin performance, as well as the long-term growth rates
assumed in perpetuity, which consider a steady state taking into account the synergy
effects of the acquisition of Cypress Semiconductor Corporation. In this context,
revenue performance in particular was critically reviewed and assessed based on
publicly available market estimates and information to determine whether the revenue
174
Infineon | Annual Report 2023
Consolidated Financial Statements
Combined Management Report
Management Board and Supervisory Board Further information
Independent Auditor’s Report](https://image.slidesharecdn.com/infineonannualreport2023-250304021013-01e9666e/85/Infineon-Technologies-Annual-Report-2023-175-320.jpg)
![›
Obtain an understanding of internal control relevant to the audit of the consolidated
financial statements and of arrangements and measures (systems) relevant to the
audit of the group management report in order to design audit procedures that are
appropriate in the circumstances, but not for the purpose of expressing an opinion
on the effectiveness of these systems.
›
Evaluate the appropriateness of accounting policies used by the Management
Board and the reasonableness of estimates made by the Management Board and
related disclosures.
›
Conclude on the appropriateness of the Management Board’s use of the going
concern basis of accounting and, based on the audit evidence obtained, whether
a material uncertainty exists related to events or conditions that may cast significant
doubt on the Group’s ability to continue as a going concern. If we conclude that a
material uncertainty exists, we are required to draw attention in the auditor’s report
to the related disclosures in the consolidated financial statements and in the group
management report or, if such disclosures are inadequate, to modify our respec-
tive opinions. Our conclusions are based on the audit evidence obtained up to the
date of our auditor’s report. However, future events or conditions may cause the
Group to cease to be able to continue as a going concern.
›
Evaluate the overall presentation, structure and content of the consolidated
financial statements, including the disclosures, and whether the consolidated
financial statements present the underlying transactions and events in a manner
that the consolidated financial statements give a true and fair view of the assets,
liabilities, financial position and financial performance of the Group in compliance
with IFRSs as adopted by the EU and the additional requirements of German
commercial law pursuant to Section 315e (1) HGB.
›
Obtain sufficient appropriate audit evidence regarding the financial information
of the entities or business activities within the Group to express opinions on the
consolidated financial statements and on the group management report. We are
responsible for the direction, supervision and performance of the group audit.
We remain solely responsible for our opinions.
›
Evaluate the consistency of the group management report with the consolidated
financial statements, its conformity with [German] law, and the view of the Group’s
position it provides.
›
Perform audit procedures on the prospective information presented by the
Management Board in the group management report. On the basis of sufficient
appropriate audit evidence we evaluate, in particular, the significant assumptions
used by the Management Board as a basis for the prospective information, and
evaluate the proper derivation of the prospective information from these assump-
tions. We do not express a separate opinion on the prospective information and
on the assumptions used as a basis. There is a substantial unavoidable risk that
future events will differ materially from the prospective information.
We communicate with those charged with governance regarding, among other matters,
the planned scope and timing of the audit and significant audit findings, including
any significant deficiencies in internal control that we identify during our audit.
We also provide those charged with governance with a statement that we have
complied with the relevant independence requirements, and communicate with
them all relationships and other matters that may reasonably be thought to bear on
our independence, and where applicable, the actions taken or safeguards applied
to eliminate independence threats.
177
Infineon | Annual Report 2023
Consolidated Financial Statements
Combined Management Report
Management Board and Supervisory Board Further information
Independent Auditor’s Report](https://image.slidesharecdn.com/infineonannualreport2023-250304021013-01e9666e/85/Infineon-Technologies-Annual-Report-2023-178-320.jpg)
![›
Obtain an understanding of internal control relevant to the assurance on the ESEF
documents in order to design assurance procedures that are appropriate in the
circumstances, but not for the purpose of expressing an assurance opinion on the
effectiveness of these controls.
›
Evaluate the technical validity of the ESEF documents, i.e. whether the file made
available containing the ESEF documents meets the requirements of Commission
Delegated Regulation (EU) 2019/815, as amended as at the reporting date, on the
technical specification for this electronic file.
›
Evaluate whether the ESEF documents provide an XHTML rendering with content
equivalent to the audited consolidated financial statements and the audited group
management report.
›
Evaluate whether the tagging of the ESEF documents with Inline XBRL technology
(iXBRL) in accordance with the requirements of Articles 4 and 6 of Commission
Delegated Regulation (EU) 2019/815, as amended as at the reporting date, enables
an appropriate and complete machine-readable XBRL copy of the XHTML rendering.
Further information pursuant to Article 10 of the EU Audit Regulation
We were elected as group auditor at the Annual General Meeting on 16 February 2023.
We were engaged by the Supervisory Board on 3 May 2023. In compliance with the
transitional provision of Article 41 (2) of the EU Audit Regulation, we have been, with-
out interruption since short financial year 1999 (1 April to 30 September 1999), the
group auditor of Infineon Technologies AG, which without interruption since its IPO
in 2000 has fulfilled the definition of a public interest entity within the meaning of
Section 316a sentence 2 HGB.
We declare that the opinions expressed in this auditor’s report are consistent with
the additional report to the Audit Committee pursuant to Article 11 of the EU Audit
Regulation (long-form audit report).
Other matter – Use of the Auditor’s Report
Our auditor’s report must always be read together with the audited consolidated
financial statements and the audited group management report as well as the exam-
ined ESEF documents. The consolidated financial statements and group management
report converted to the ESEF format – including the versions to be entered in the
company register – are merely electronic renderings of the audited consolidated
financial statements and the audited group management report and do not take their
place. In particular, the ESEF report and our assurance opinion contained therein
are to be used solely together with the examined ESEF documents made available in
electronic form.
German Public Auditor
Responsible for the Engagement
The German Public Auditor responsible for the engagement is Martin Schmitt.
Munich, 23 November 2023
KPMG AG
Wirtschaftsprüfungsgesellschaft
[Original German version signed by:]
Huber-Straßer Schmitt
Wirtschaftsprüferin Wirtschaftsprüfer
[German Public Auditor] [German Public Auditor]
179
Infineon | Annual Report 2023
Consolidated Financial Statements
Combined Management Report
Management Board and Supervisory Board Further information
Independent Auditor’s Report](https://image.slidesharecdn.com/infineonannualreport2023-250304021013-01e9666e/85/Infineon-Technologies-Annual-Report-2023-180-320.jpg)