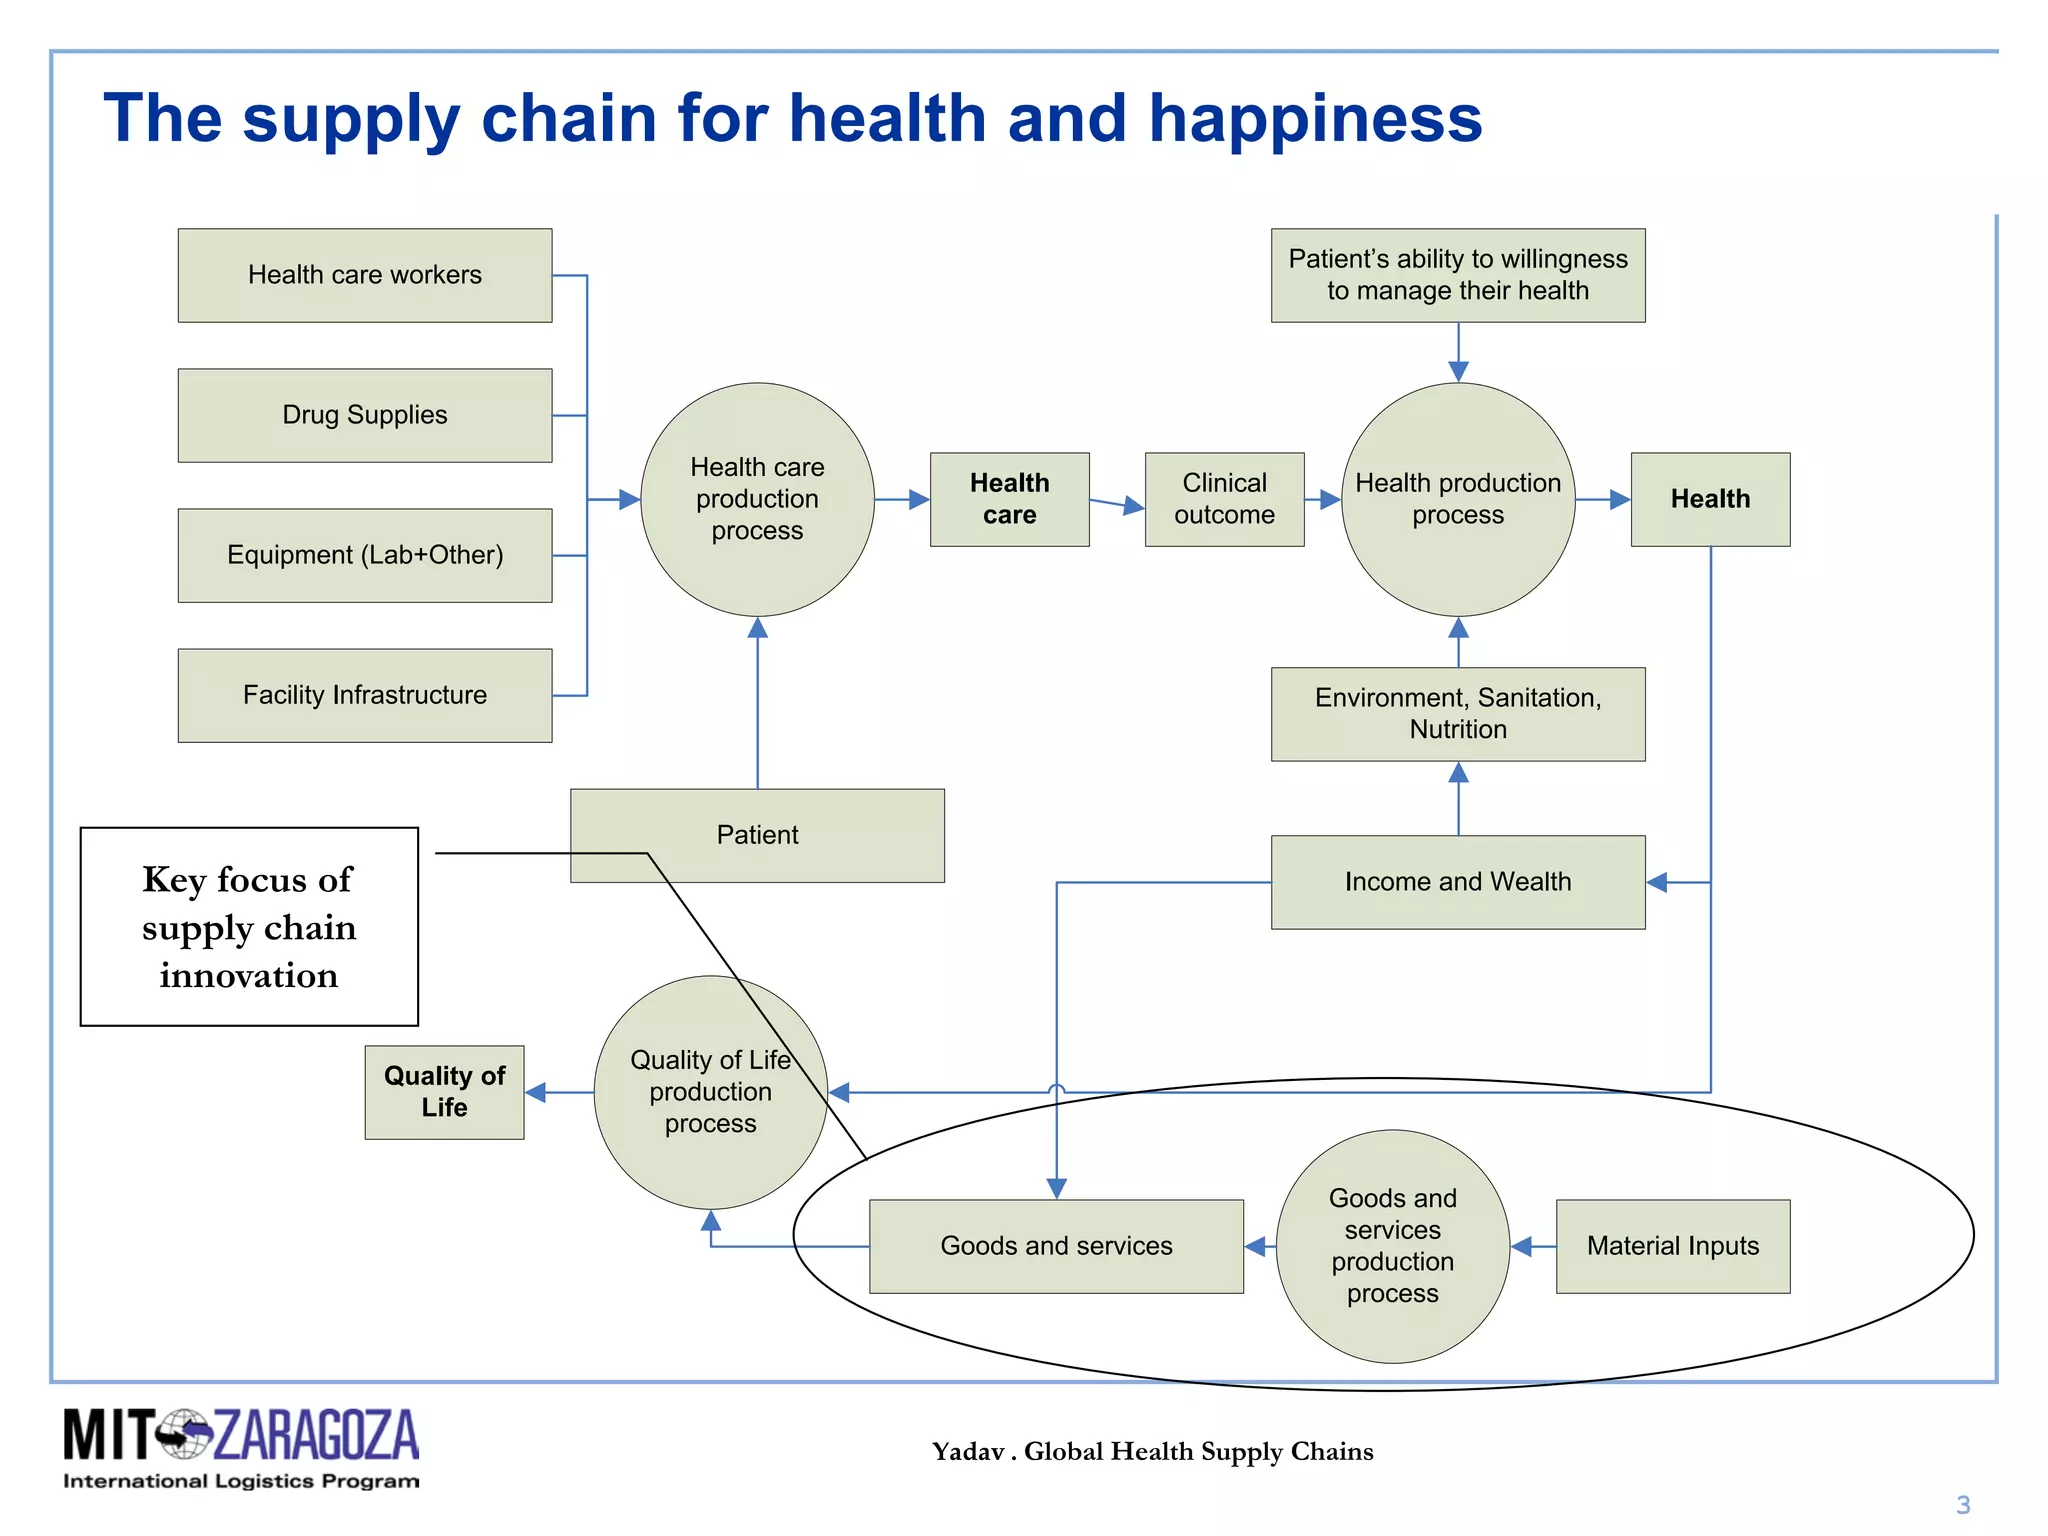
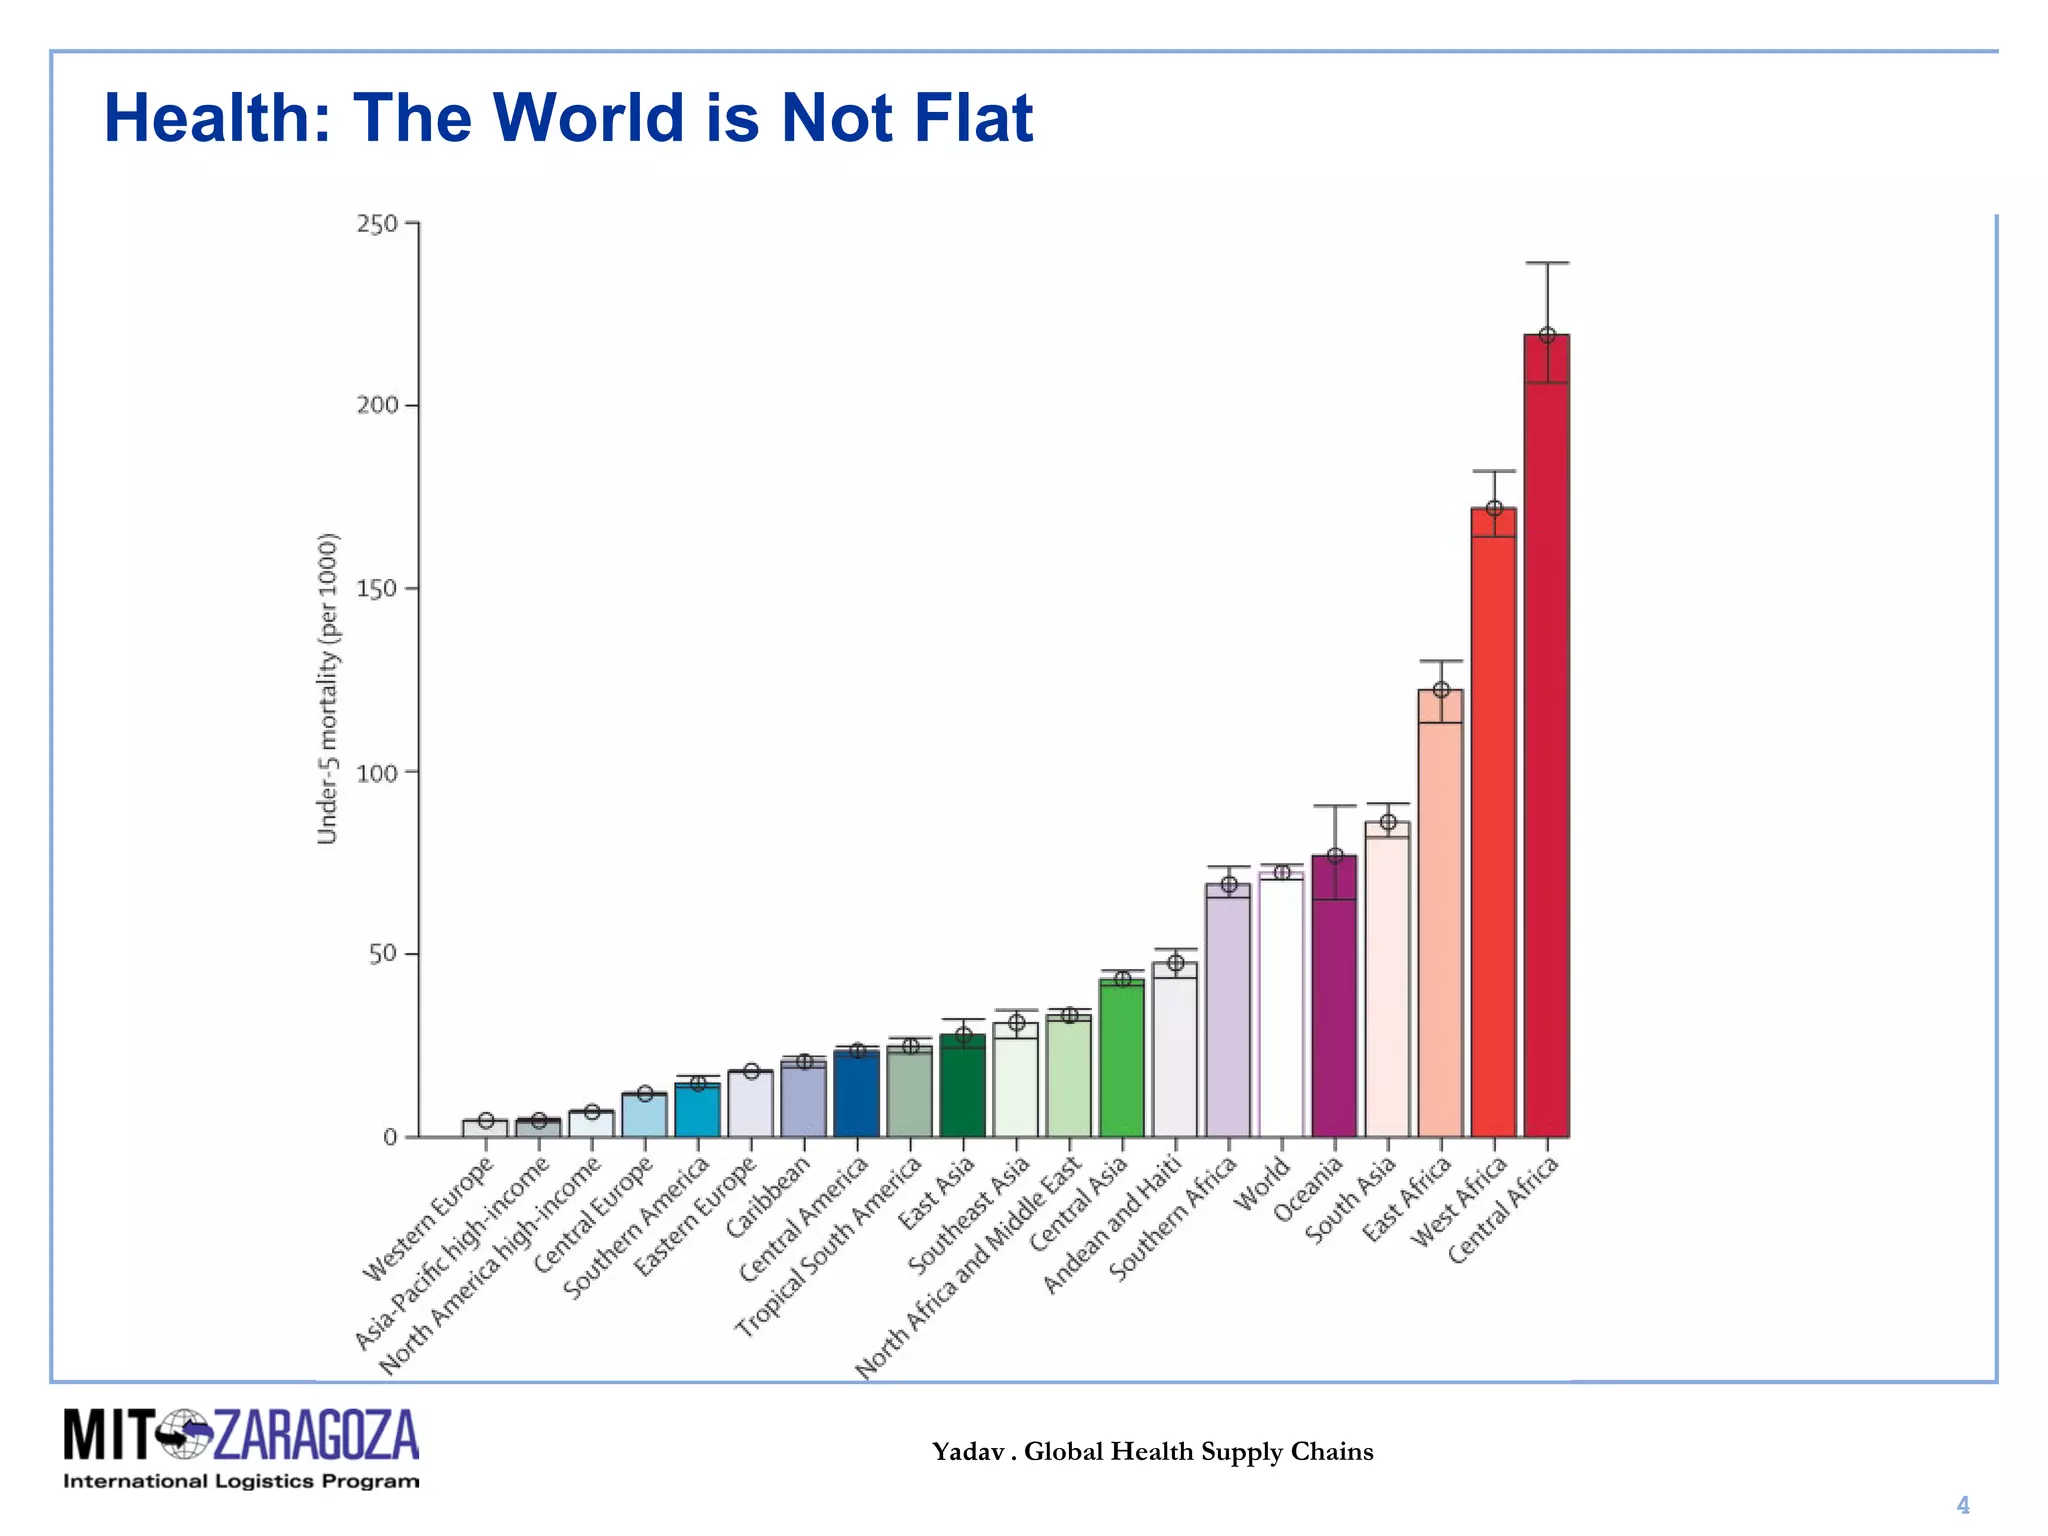
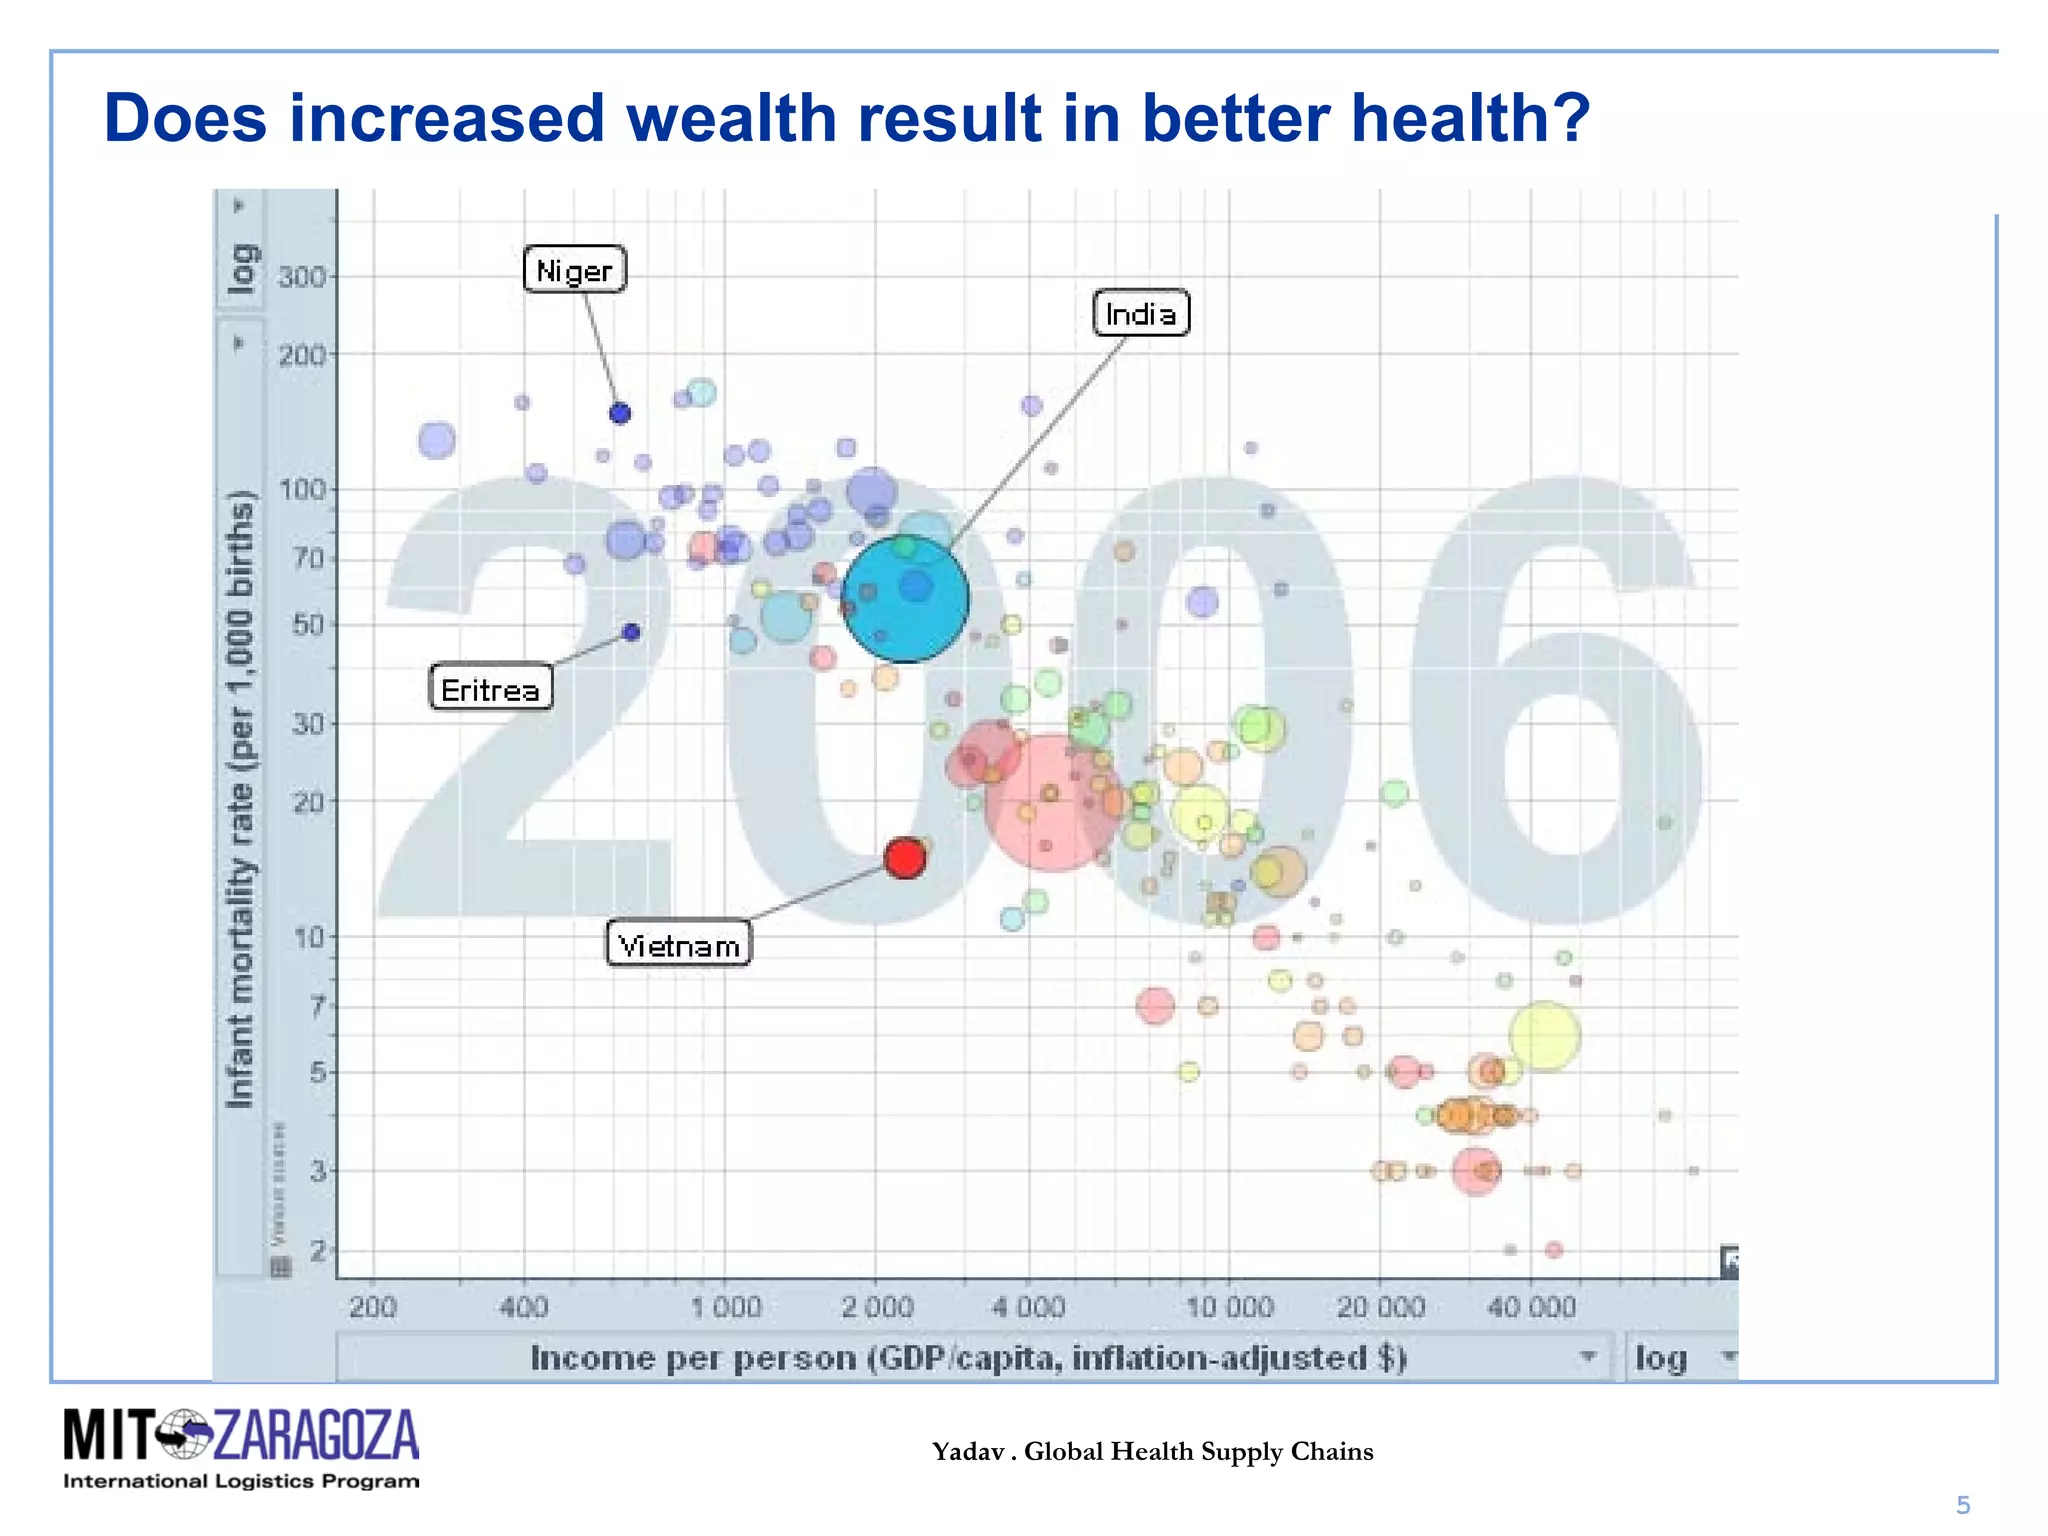
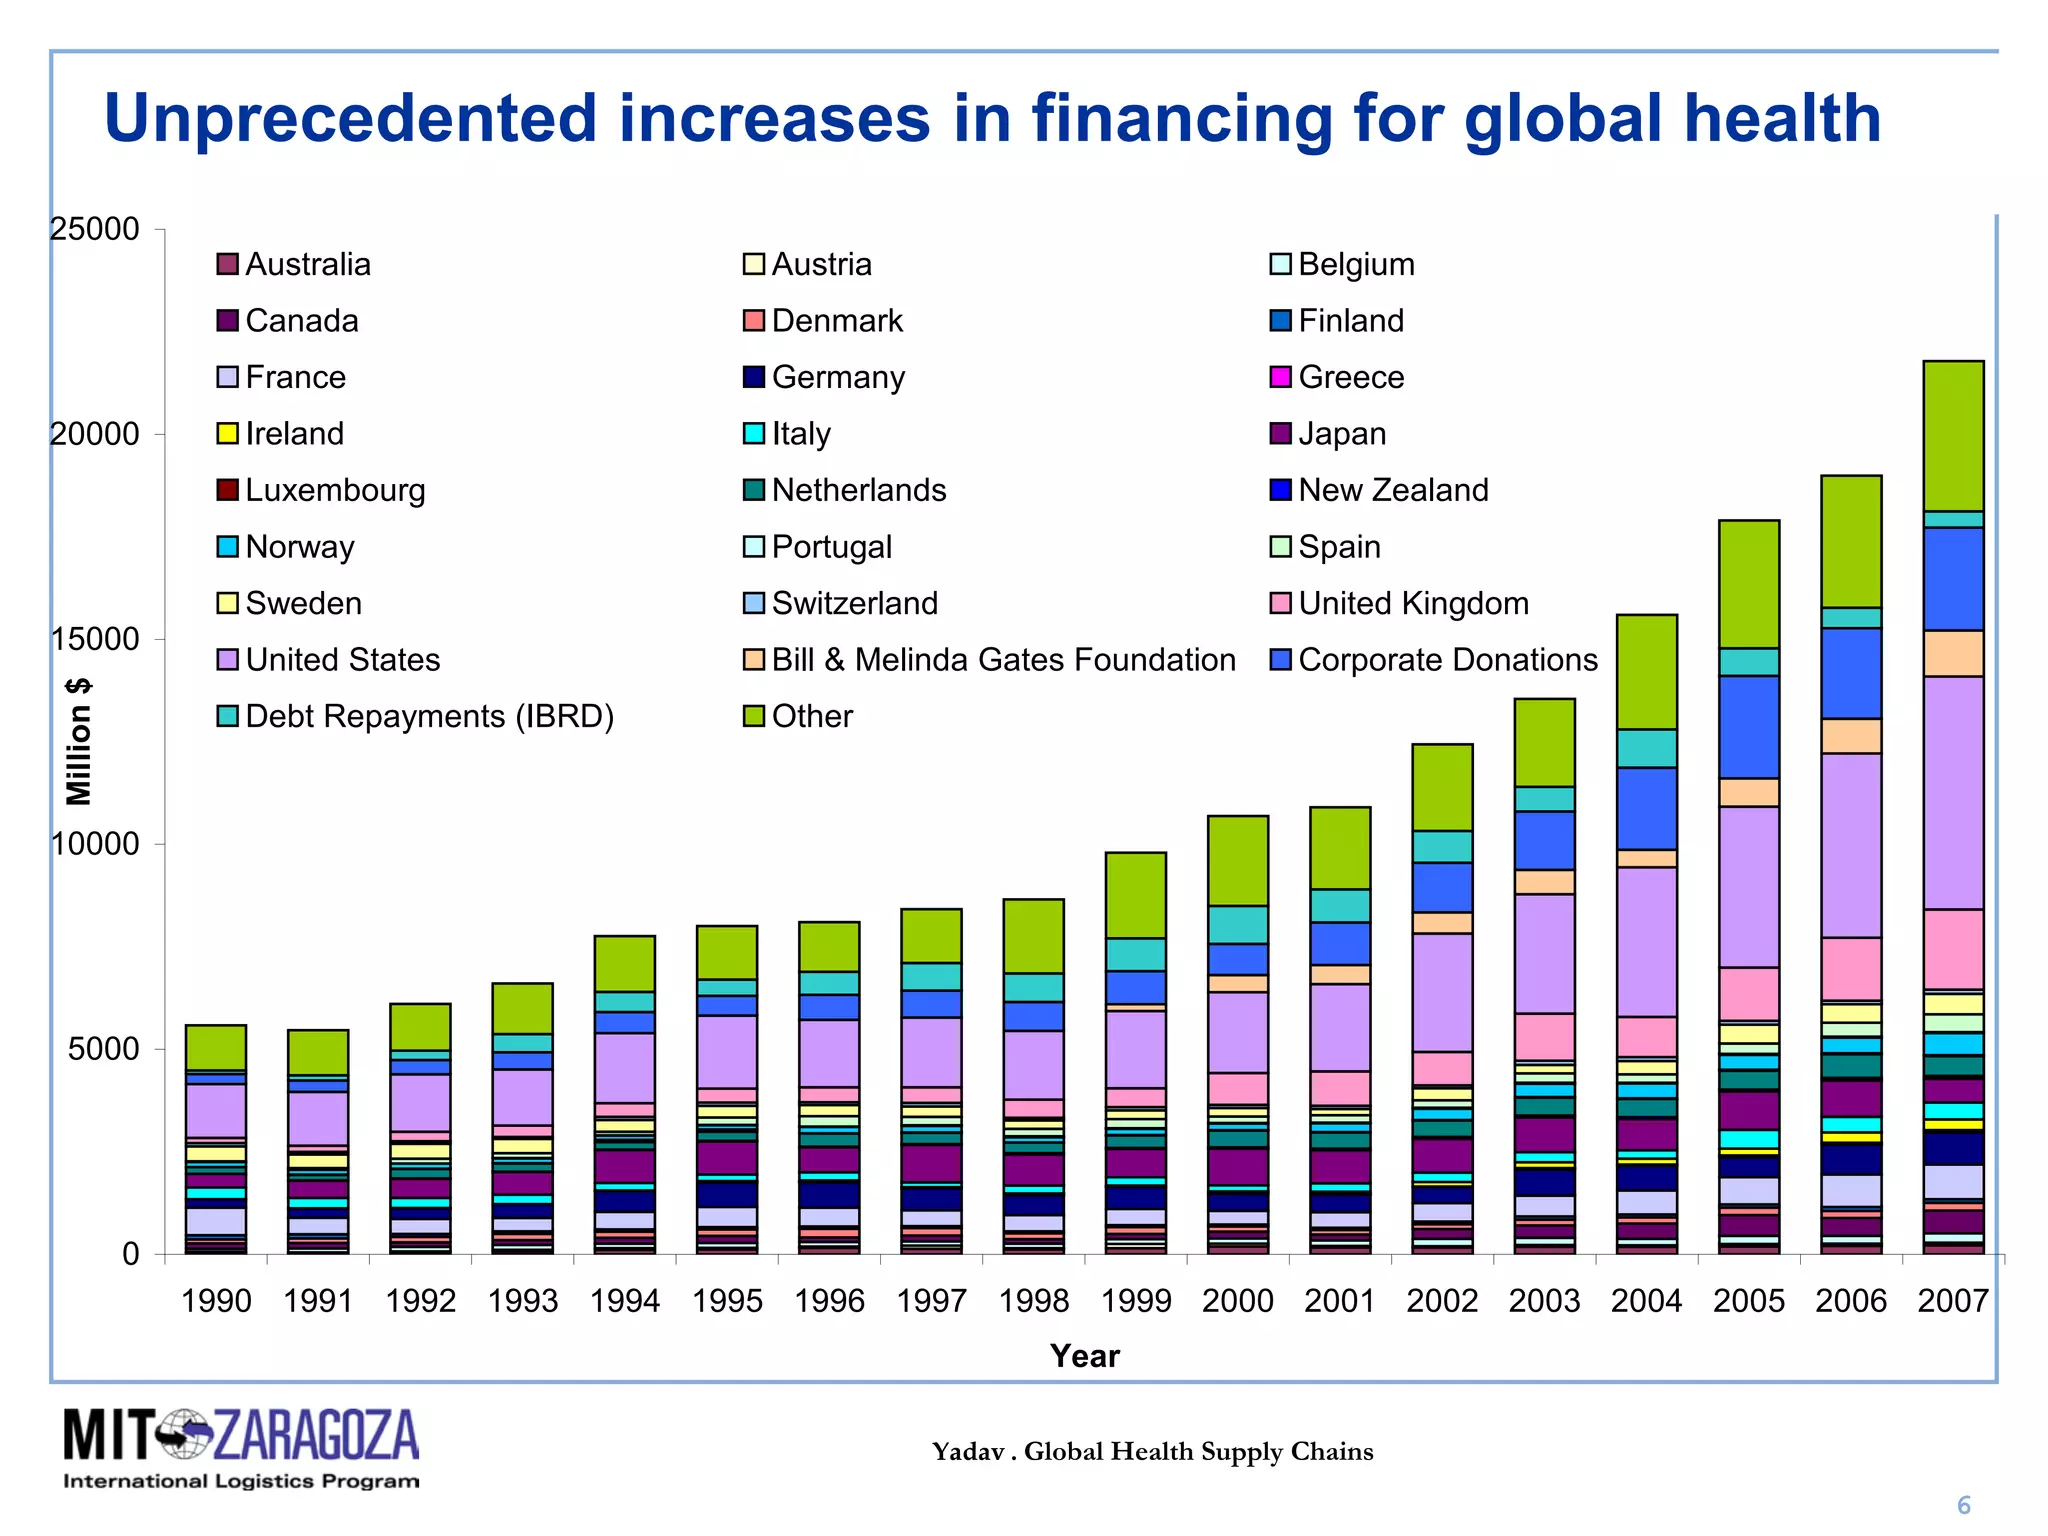
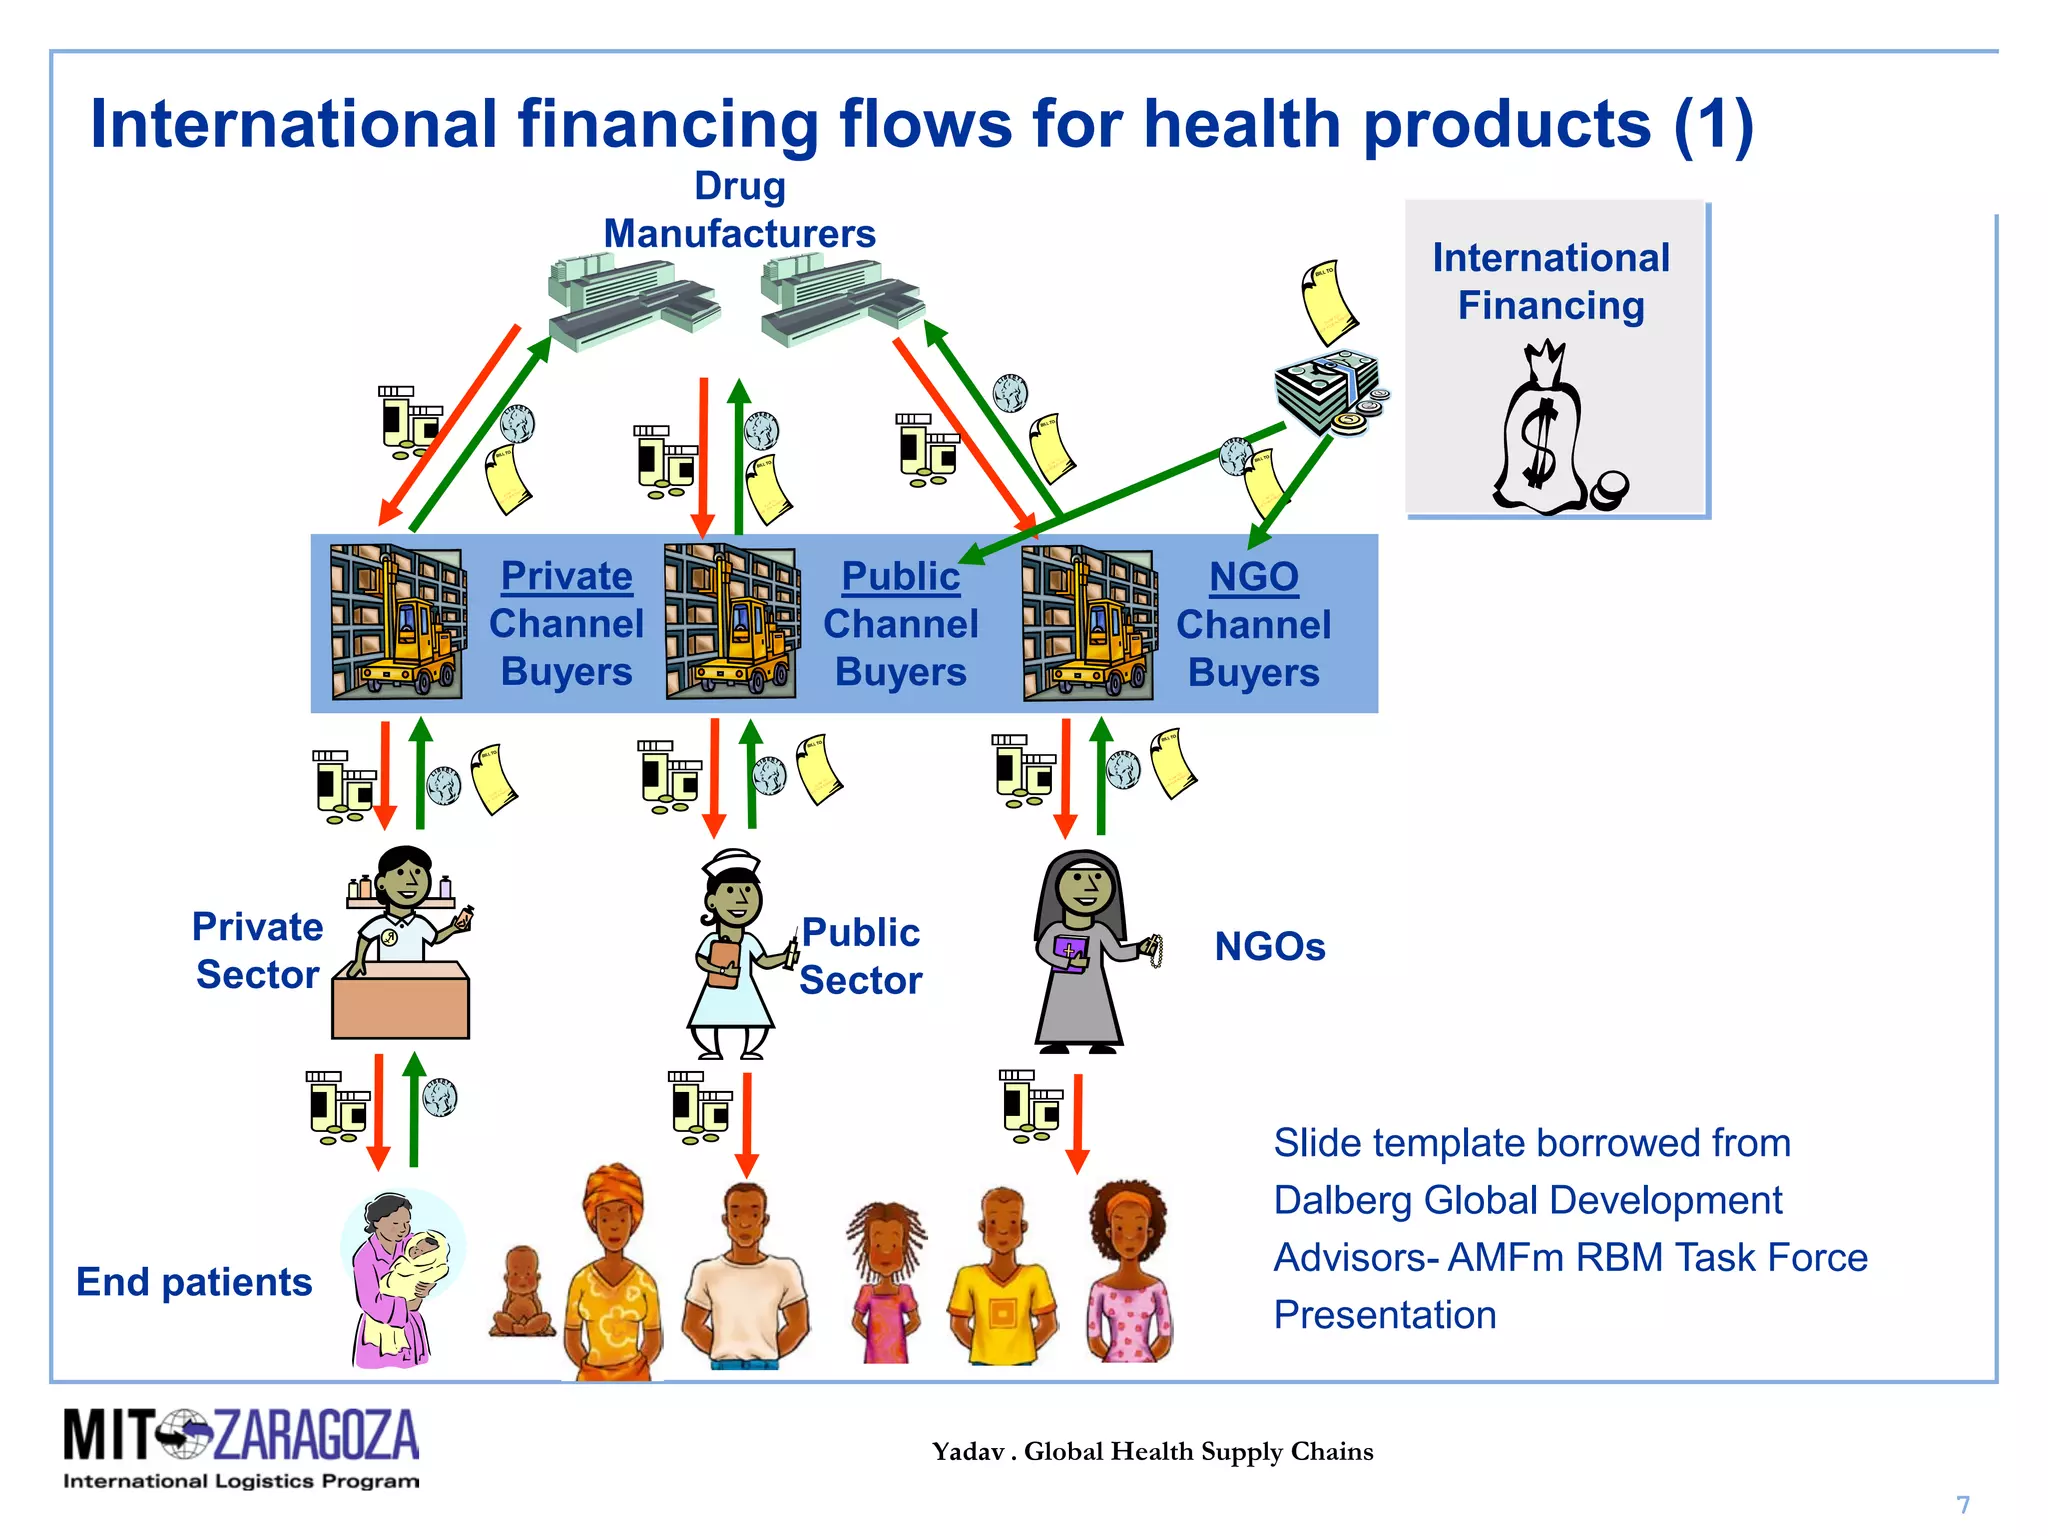
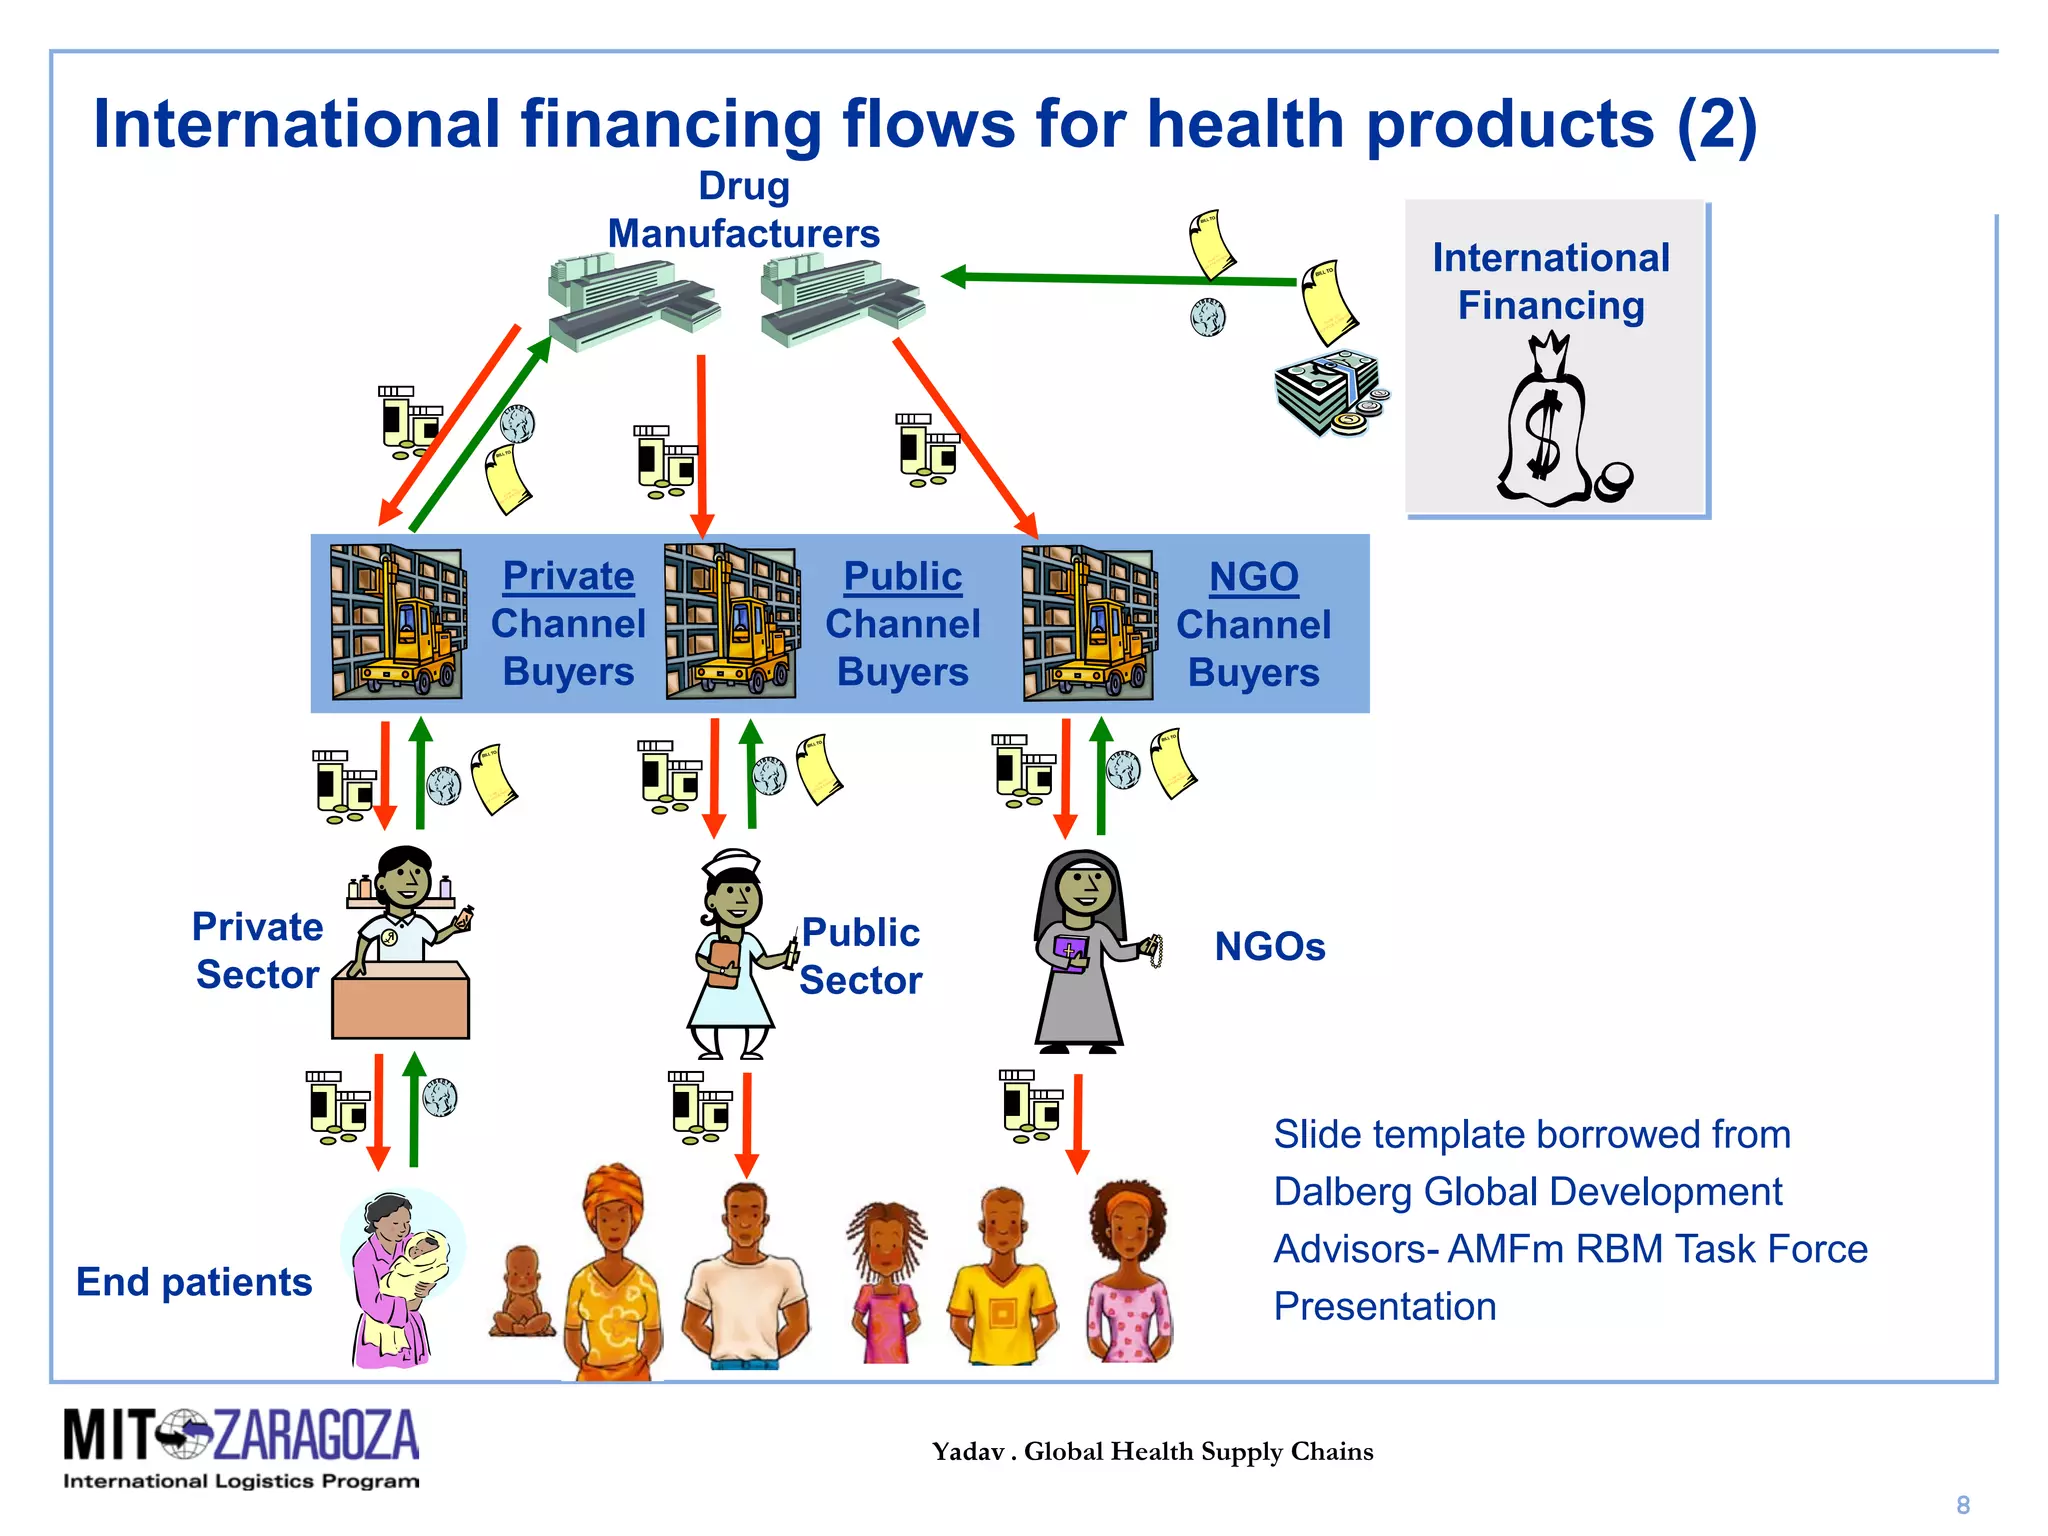
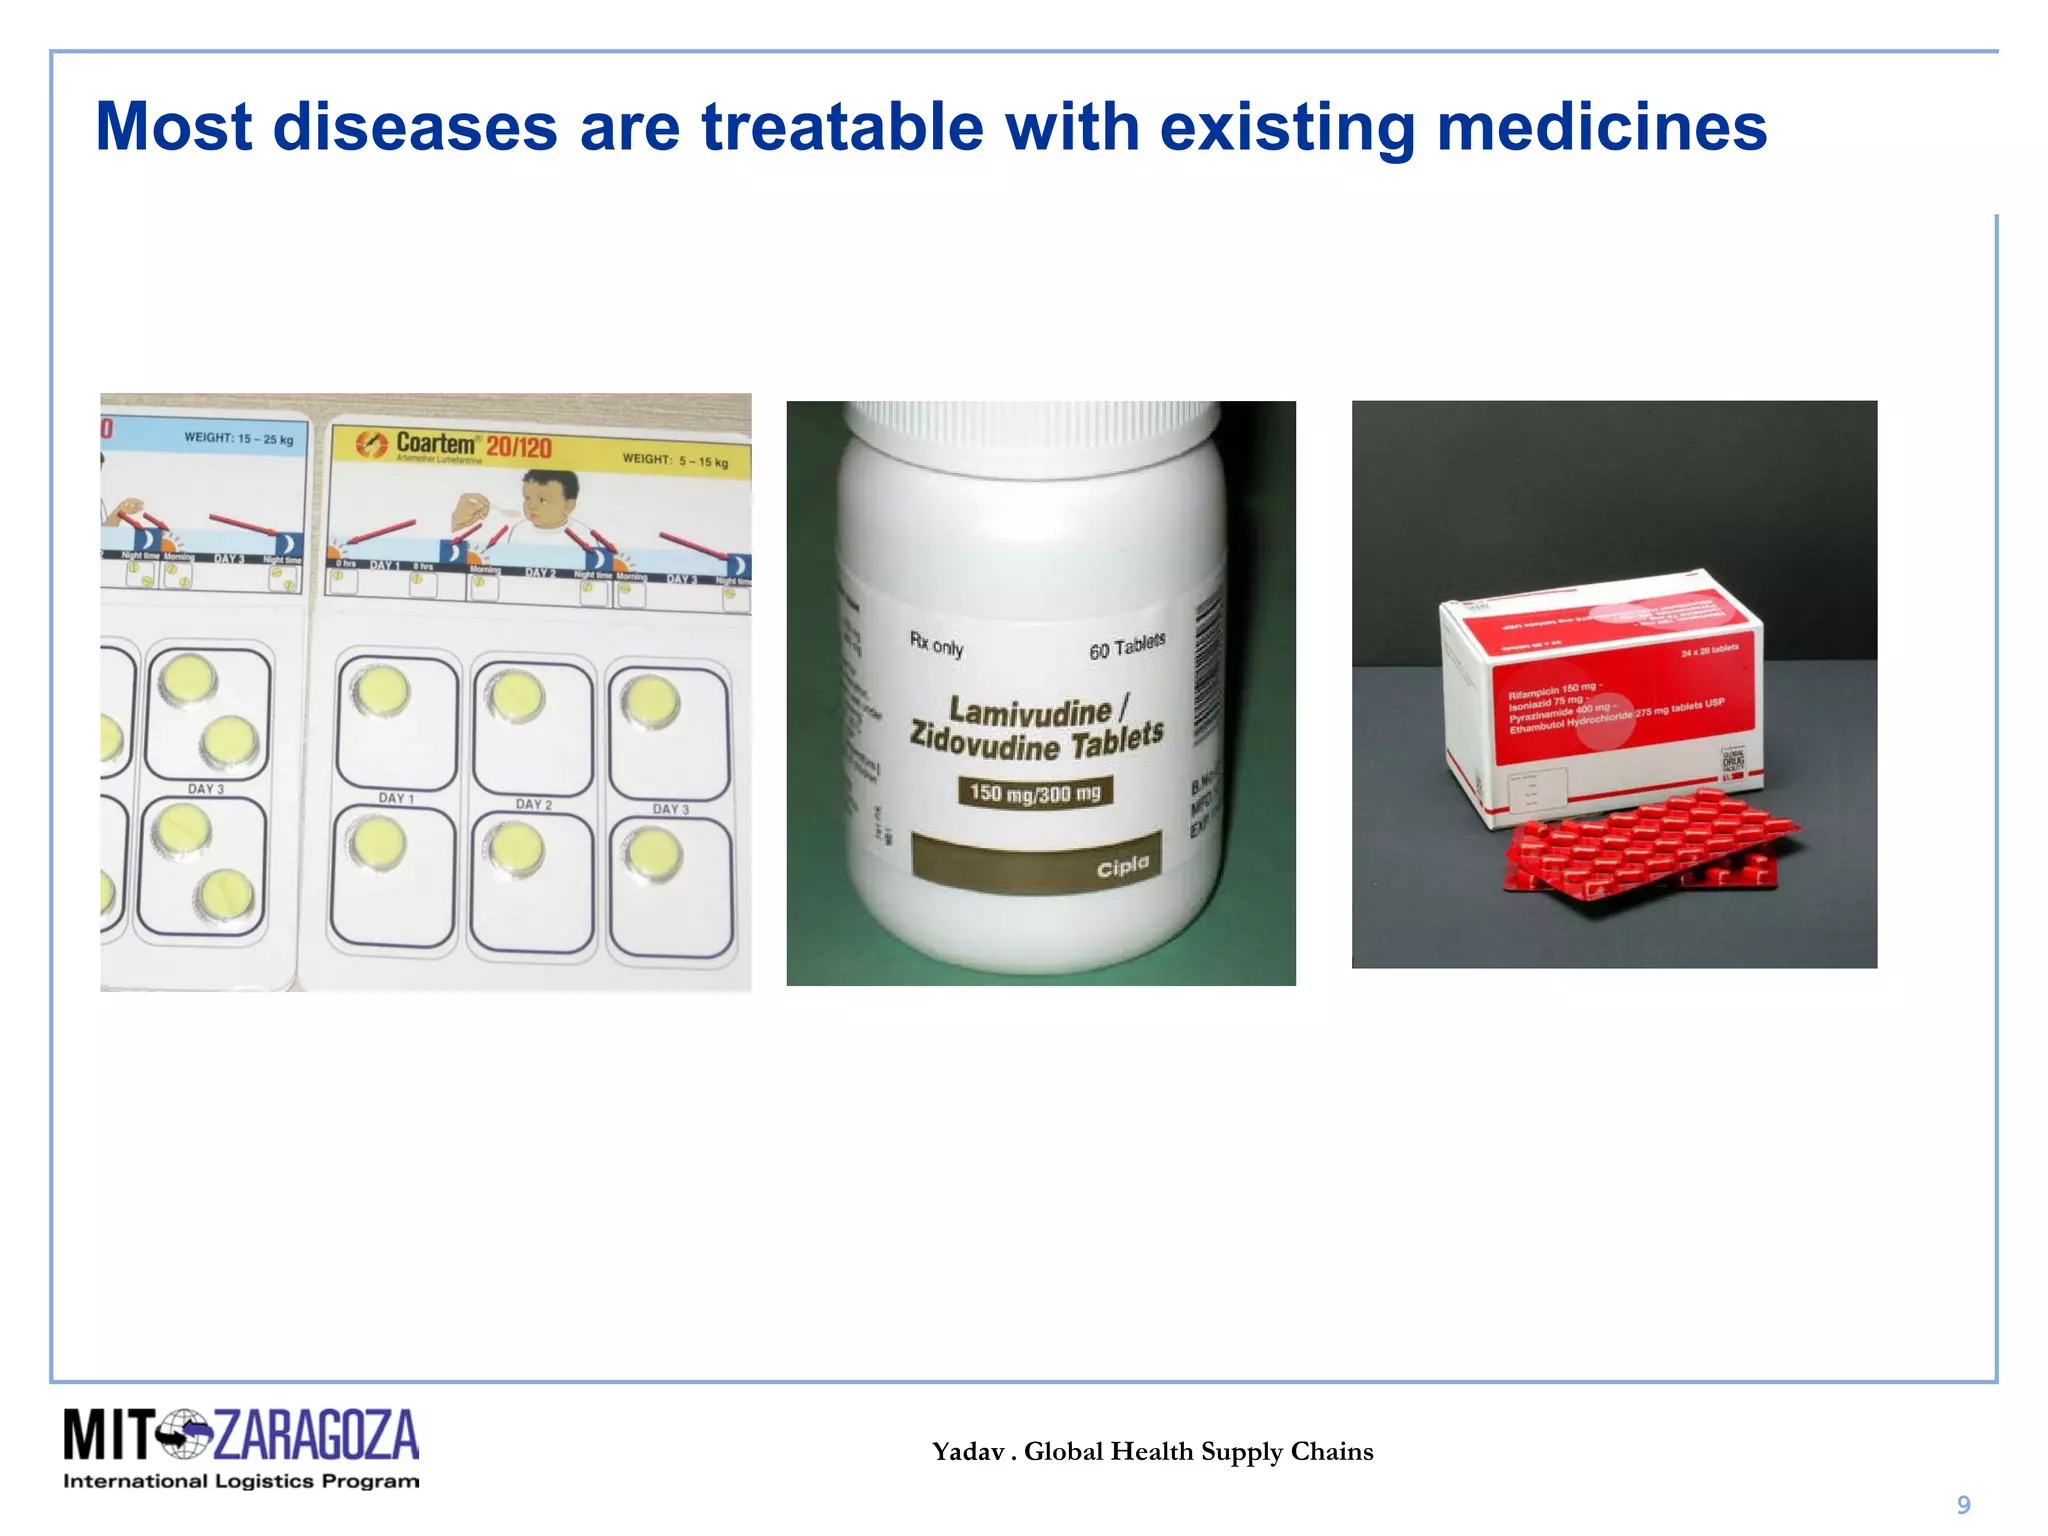
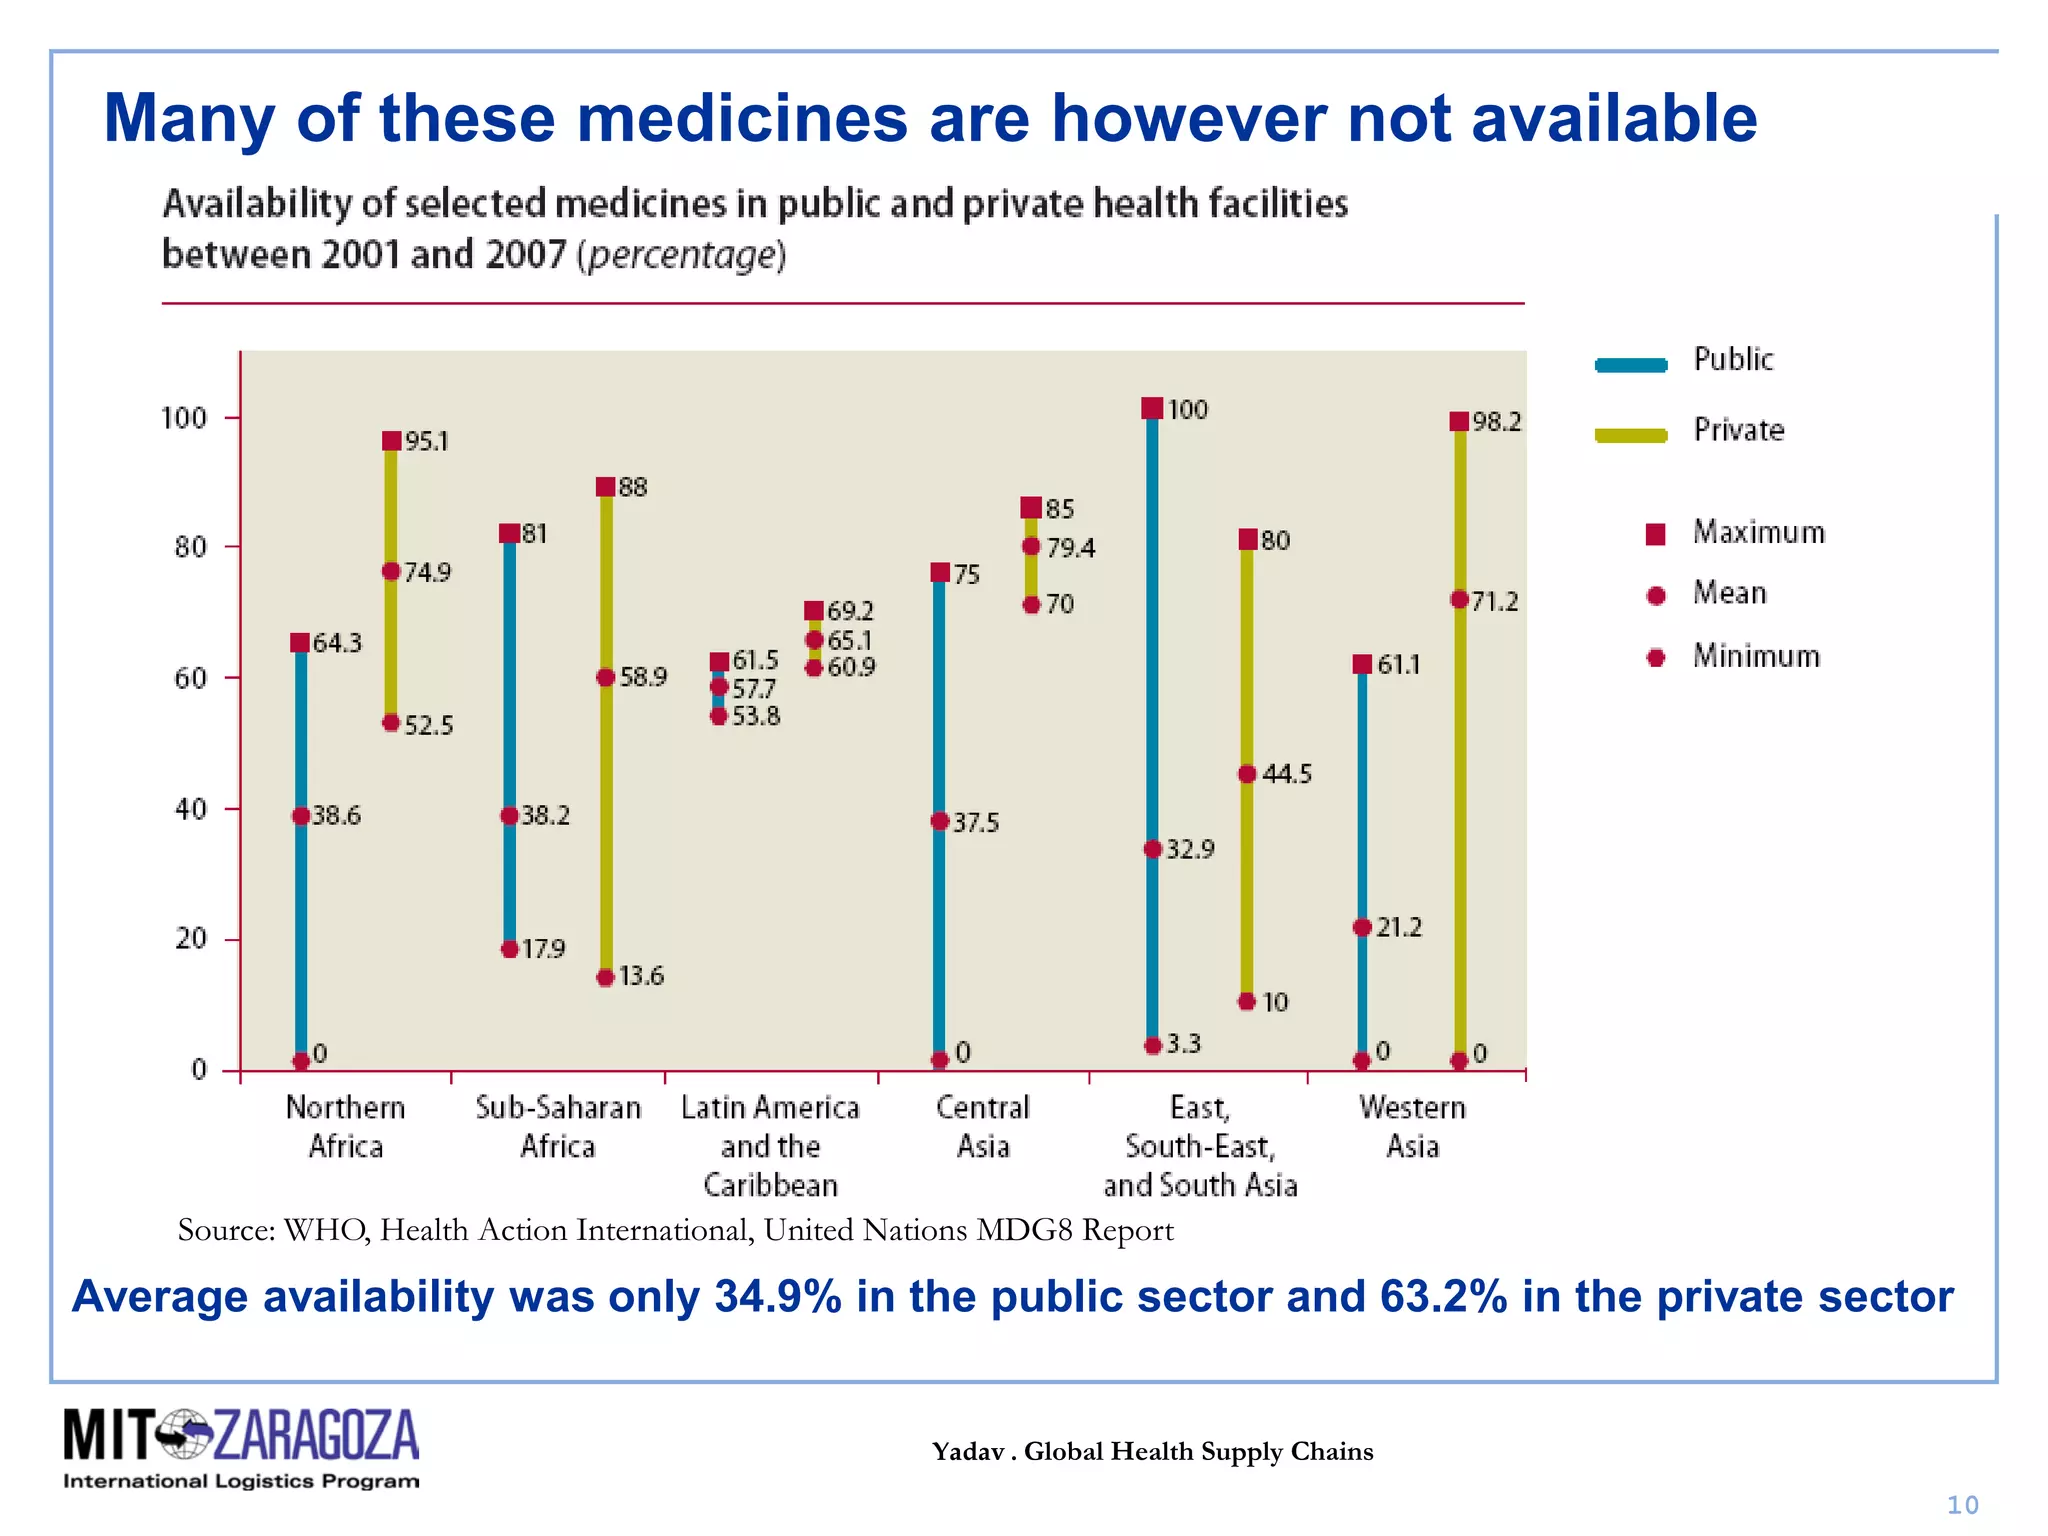
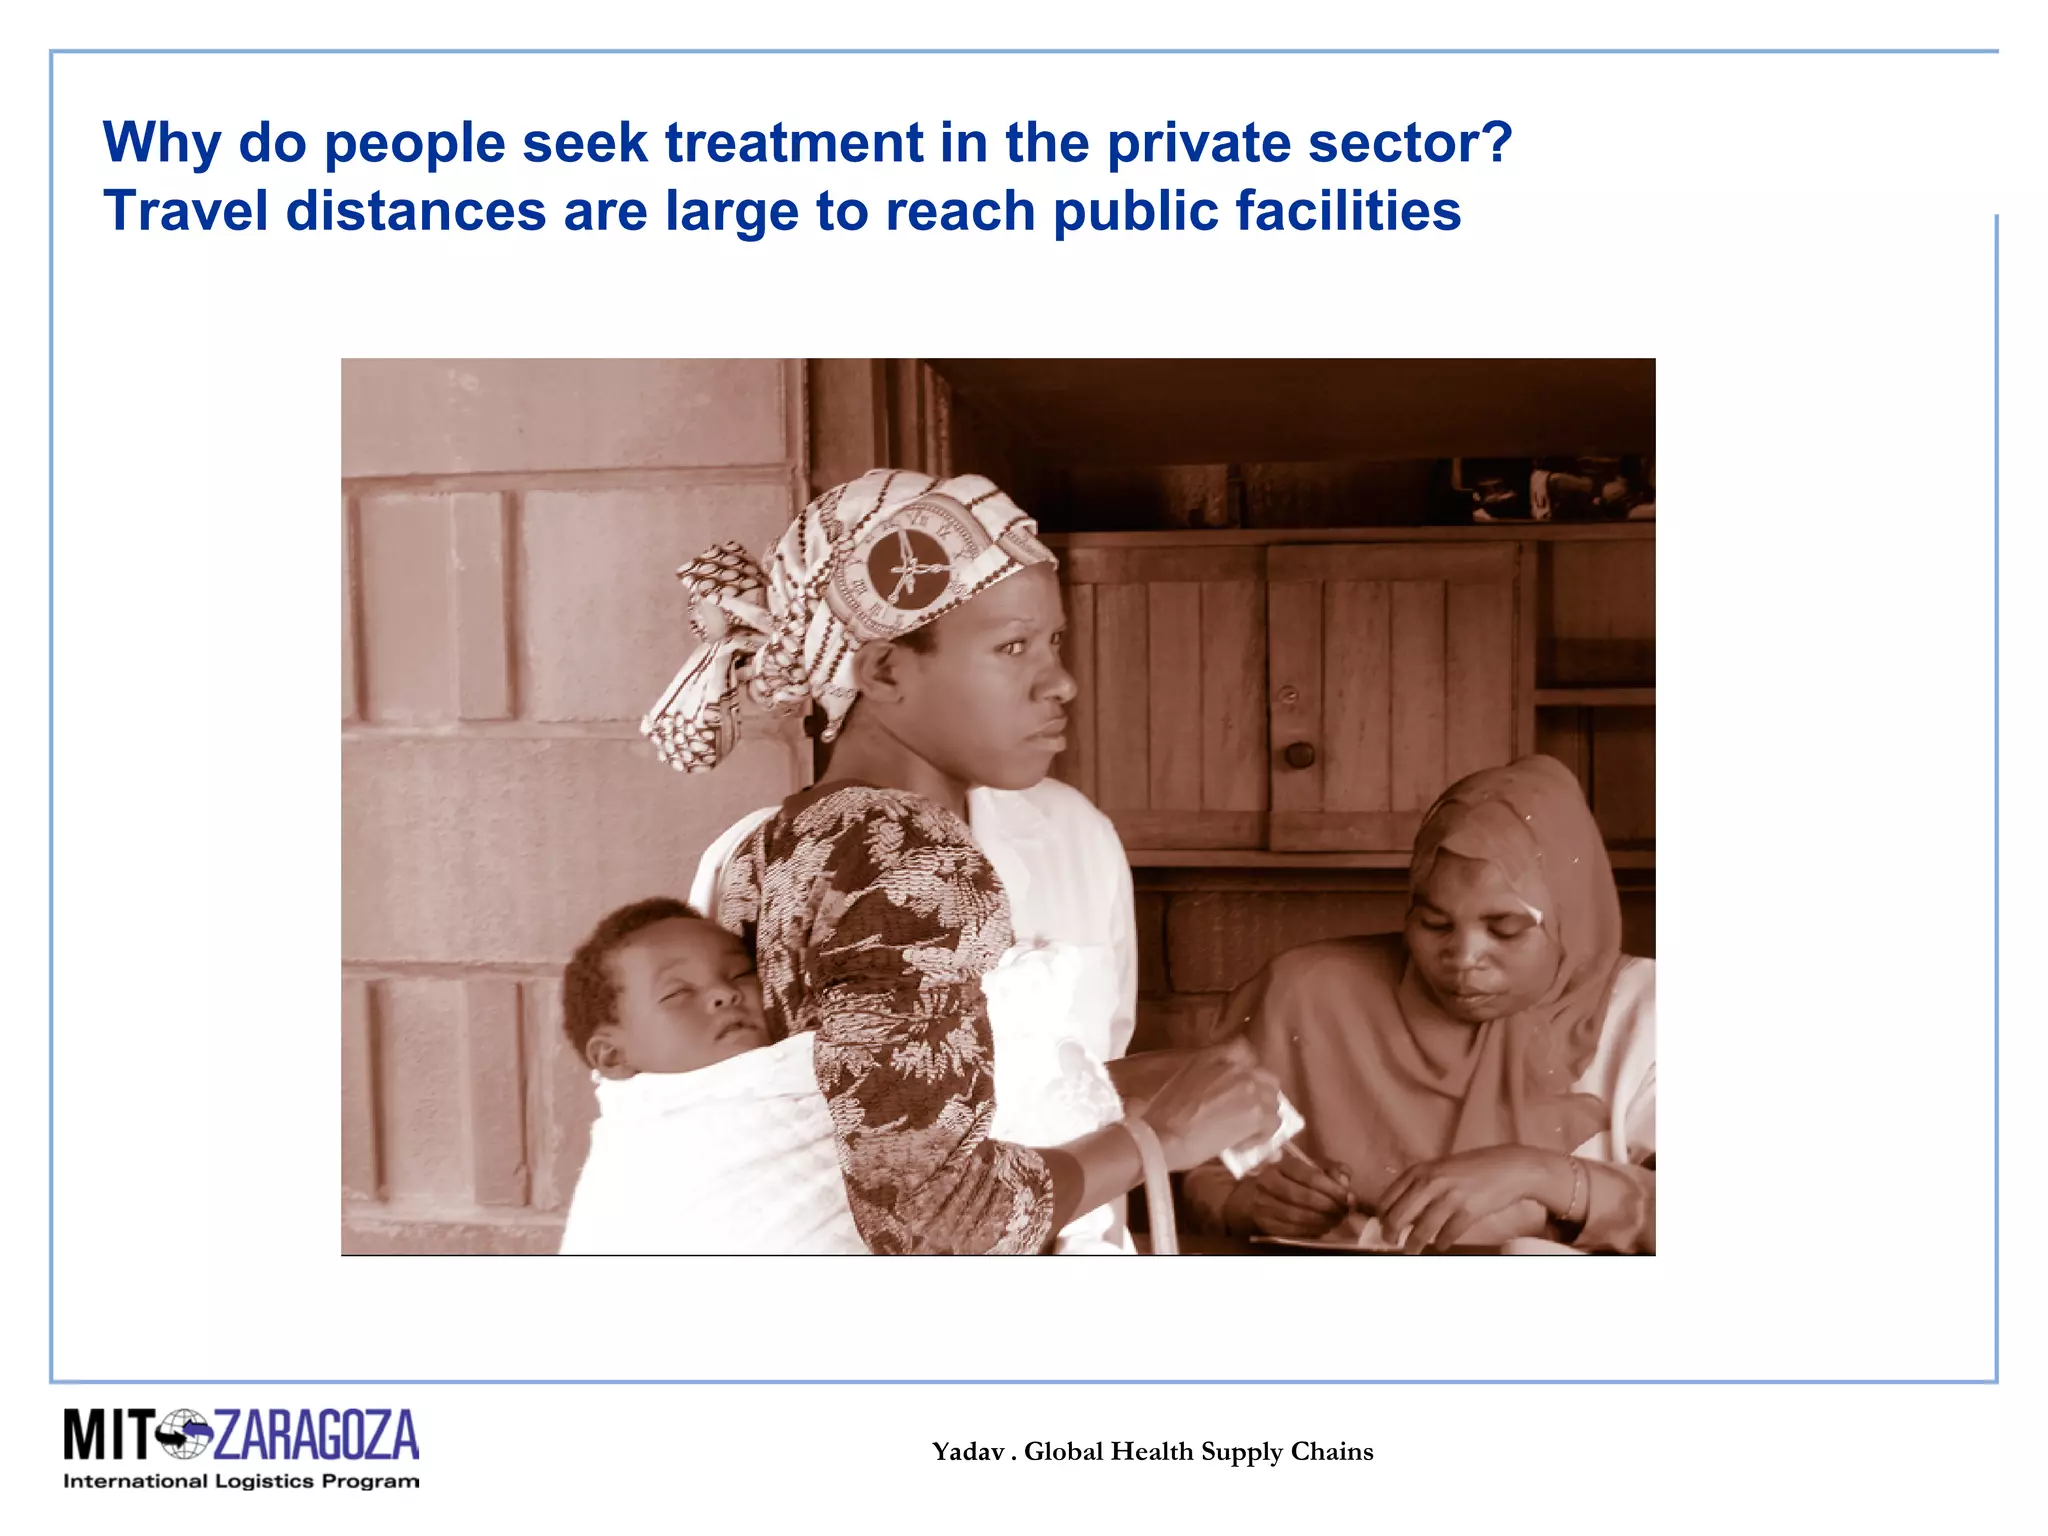
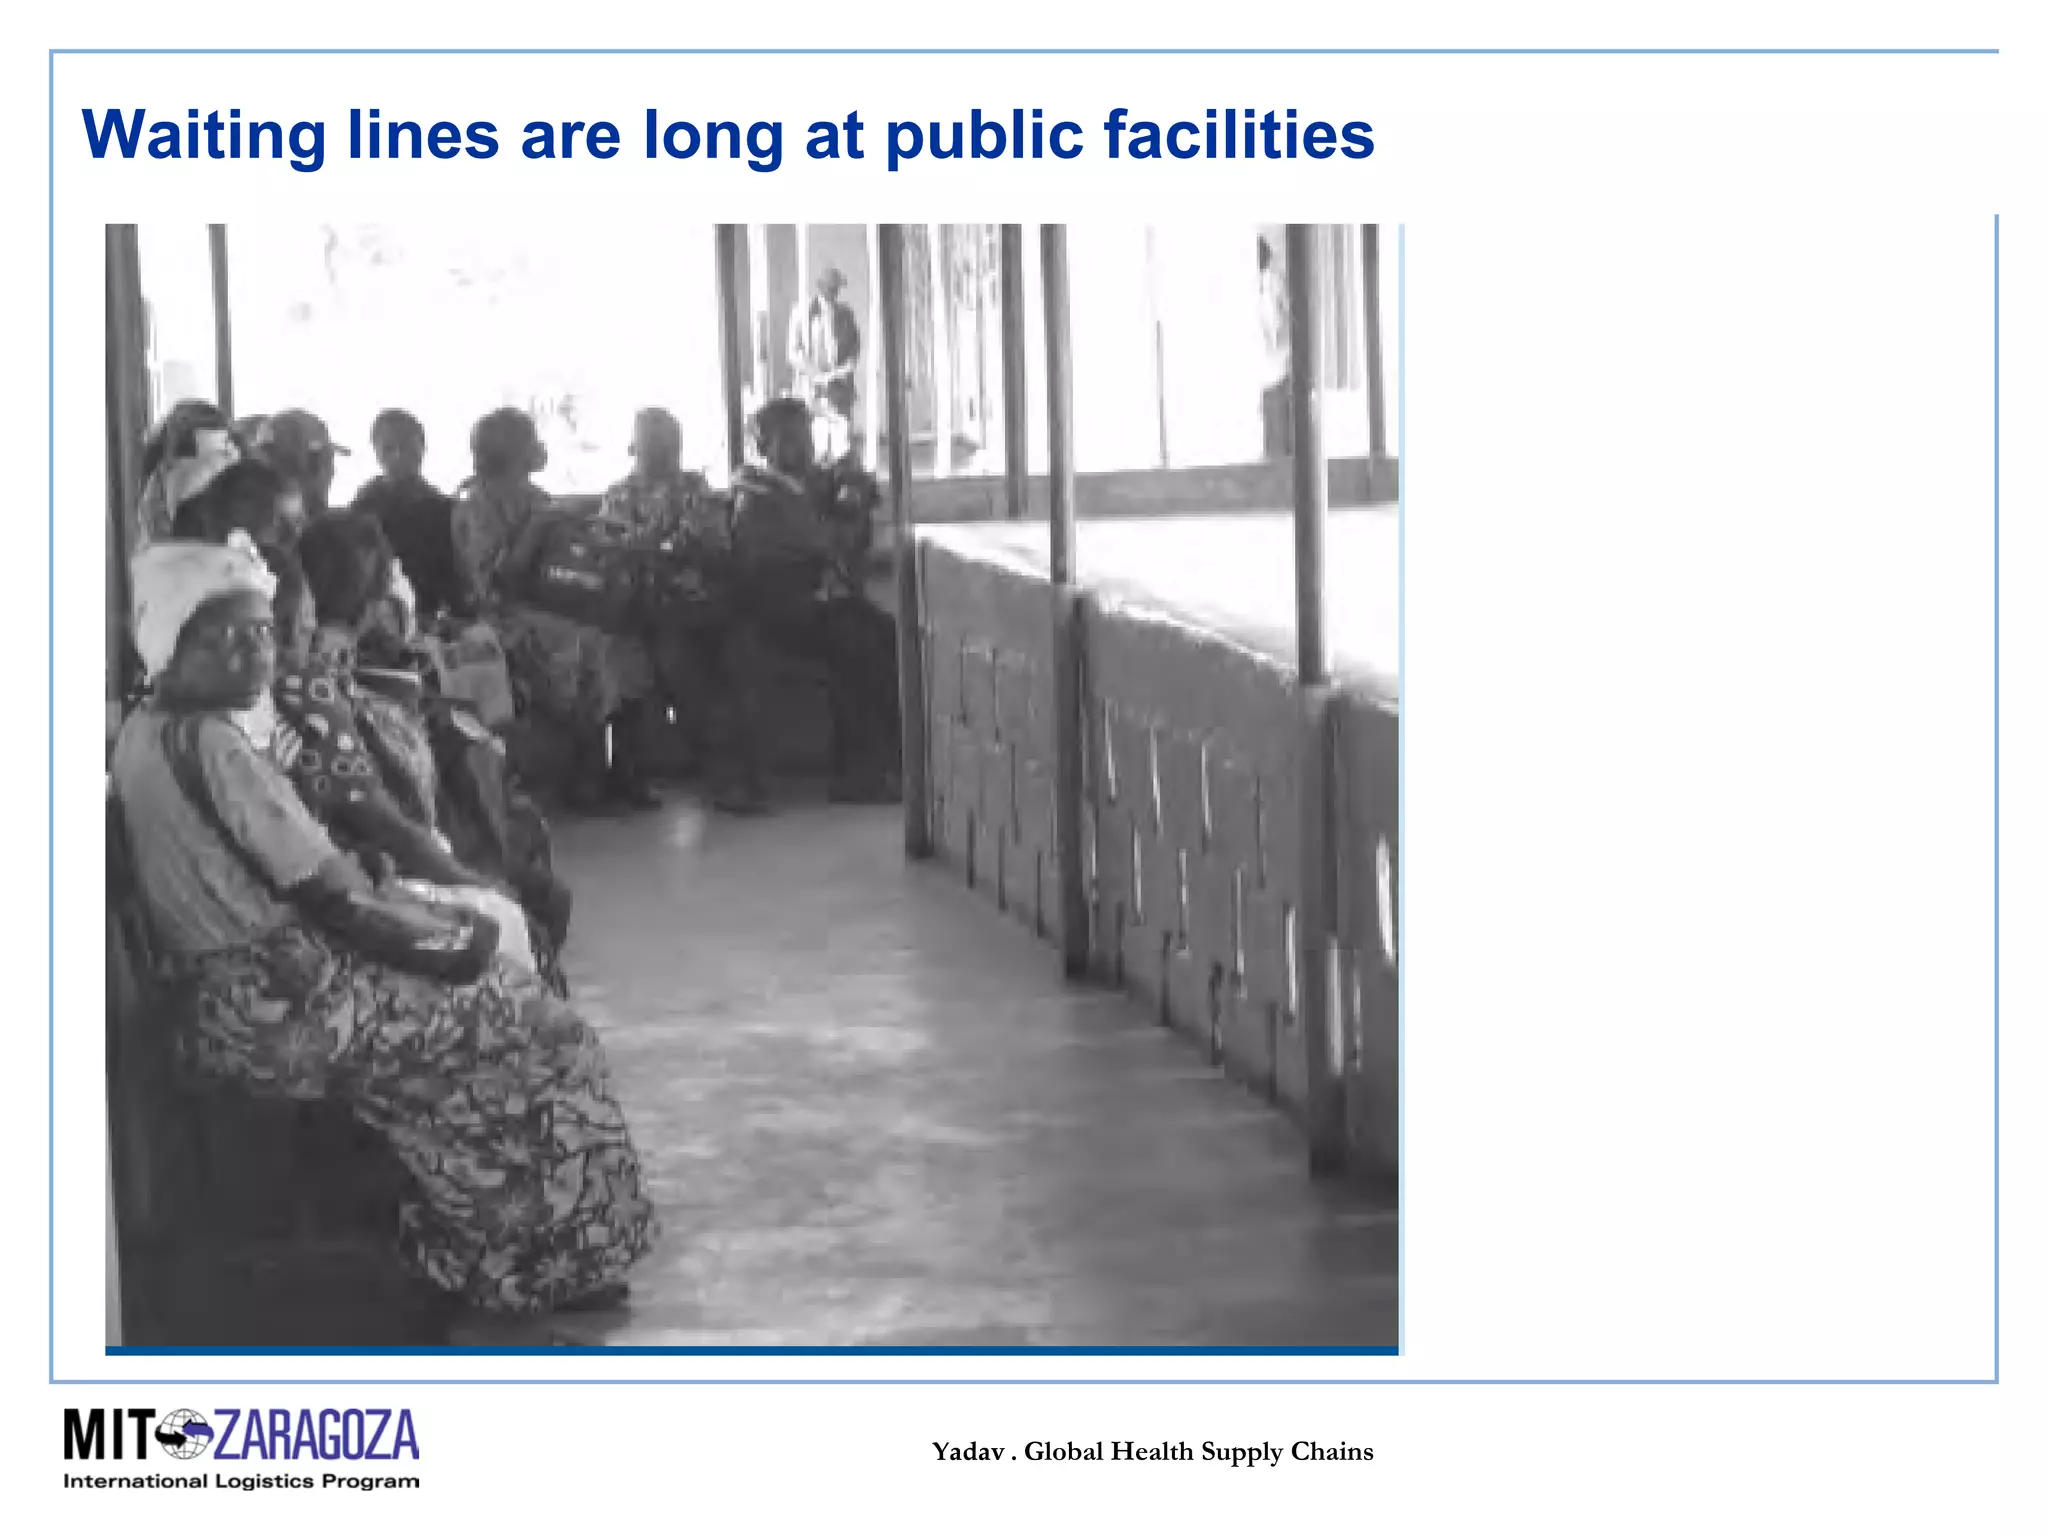
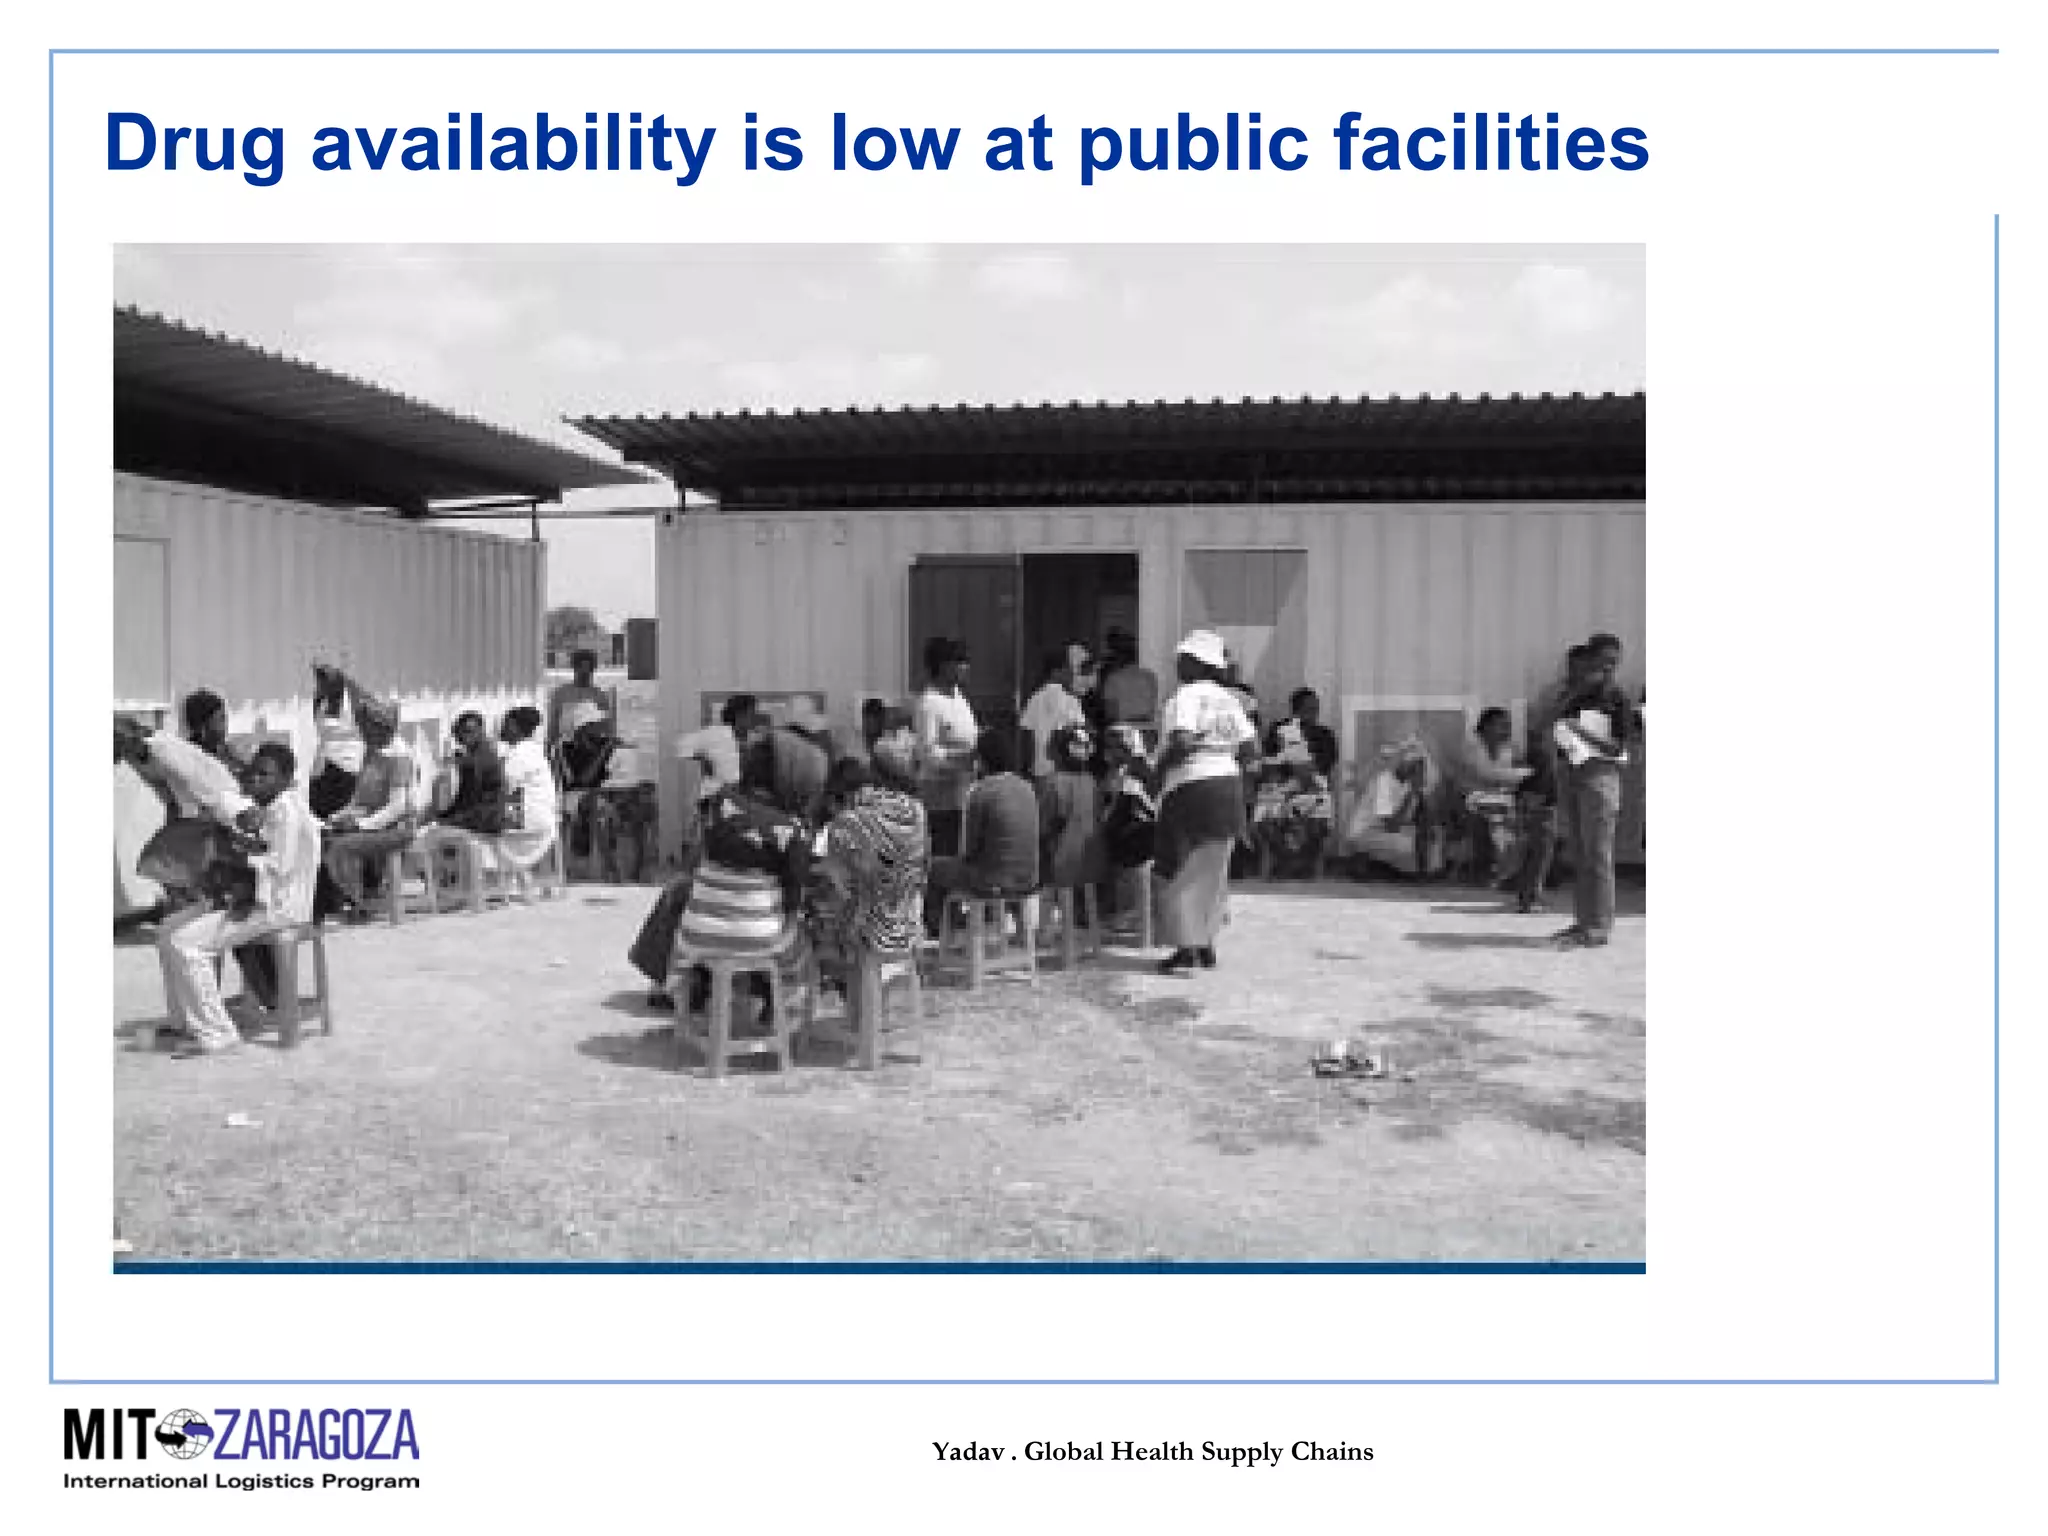
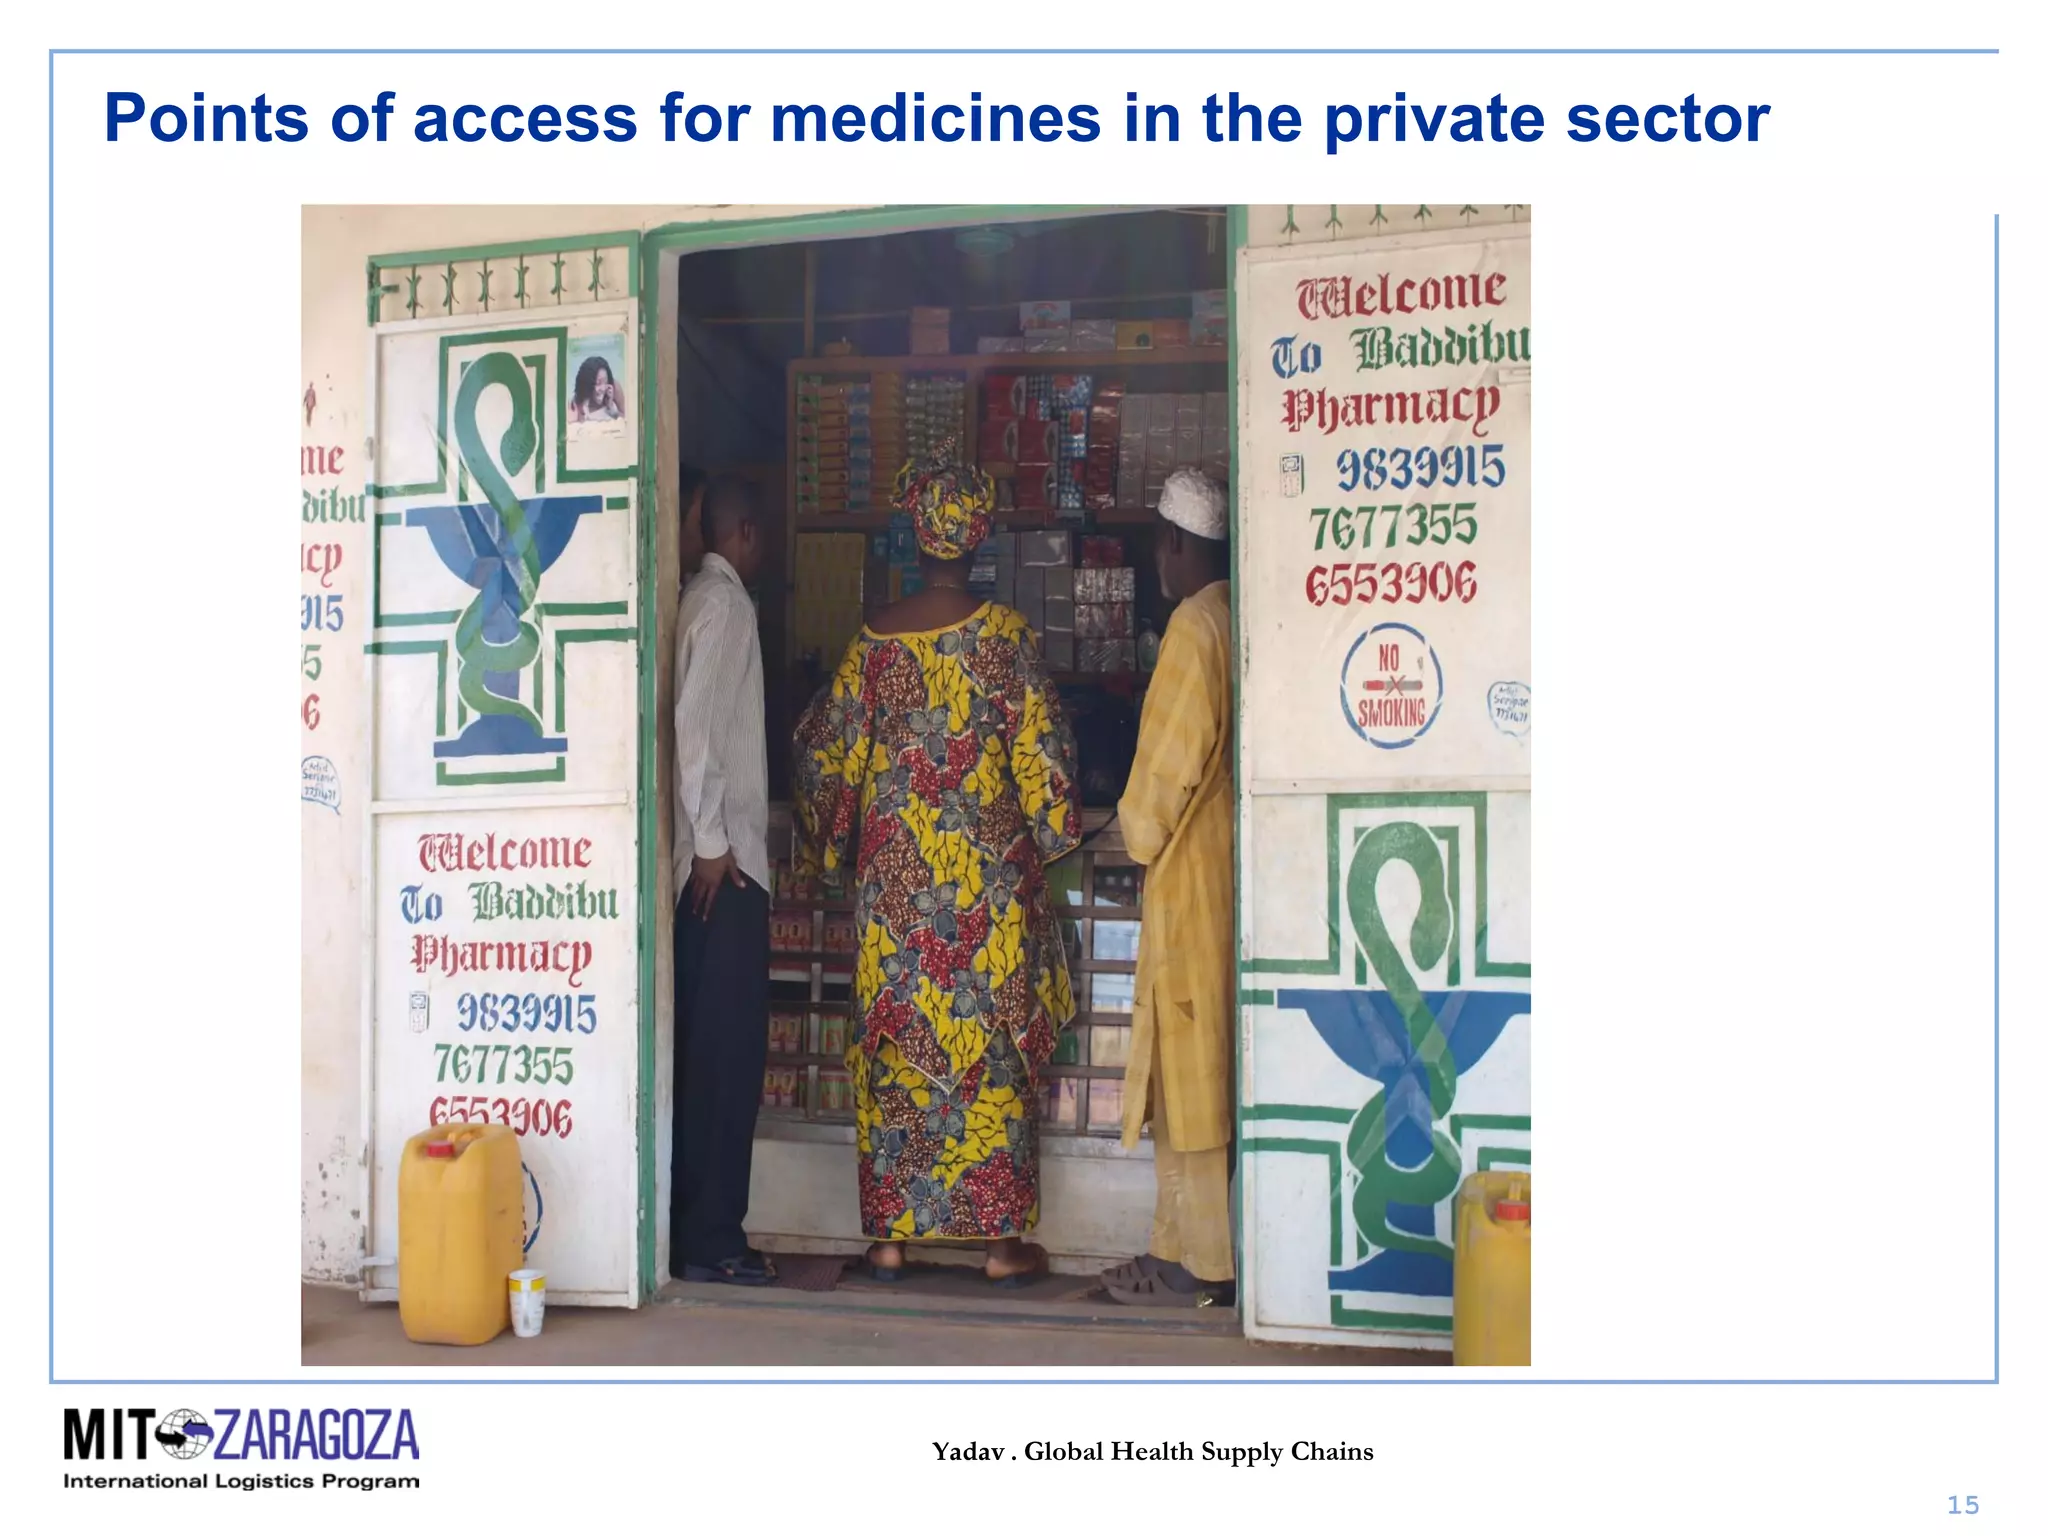
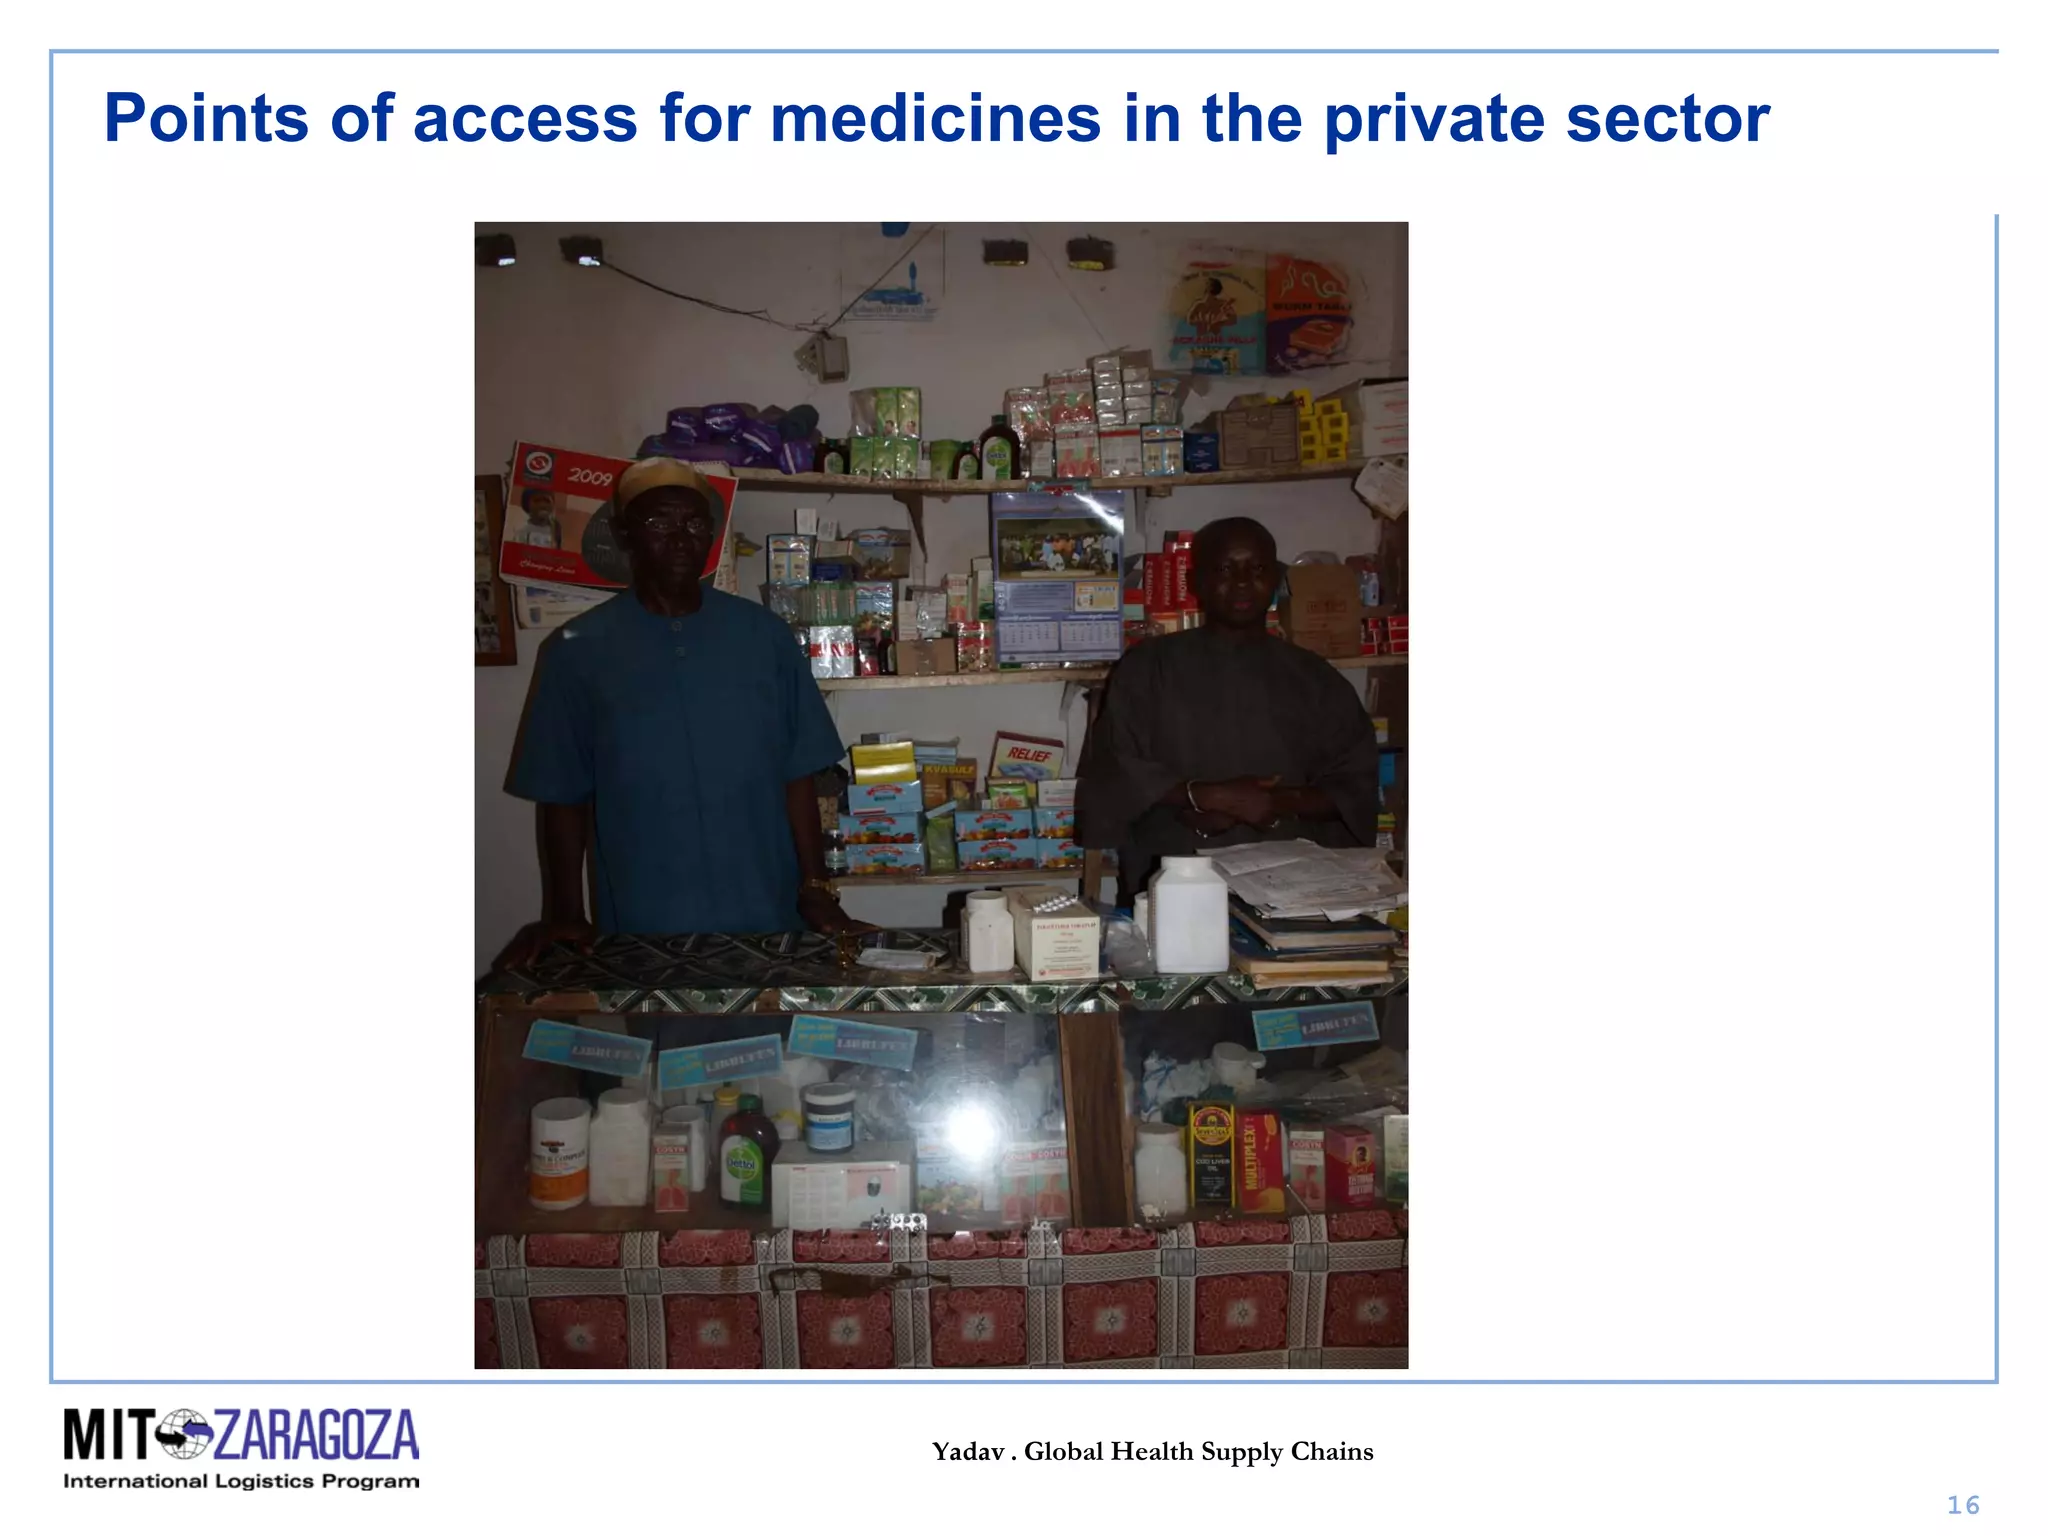
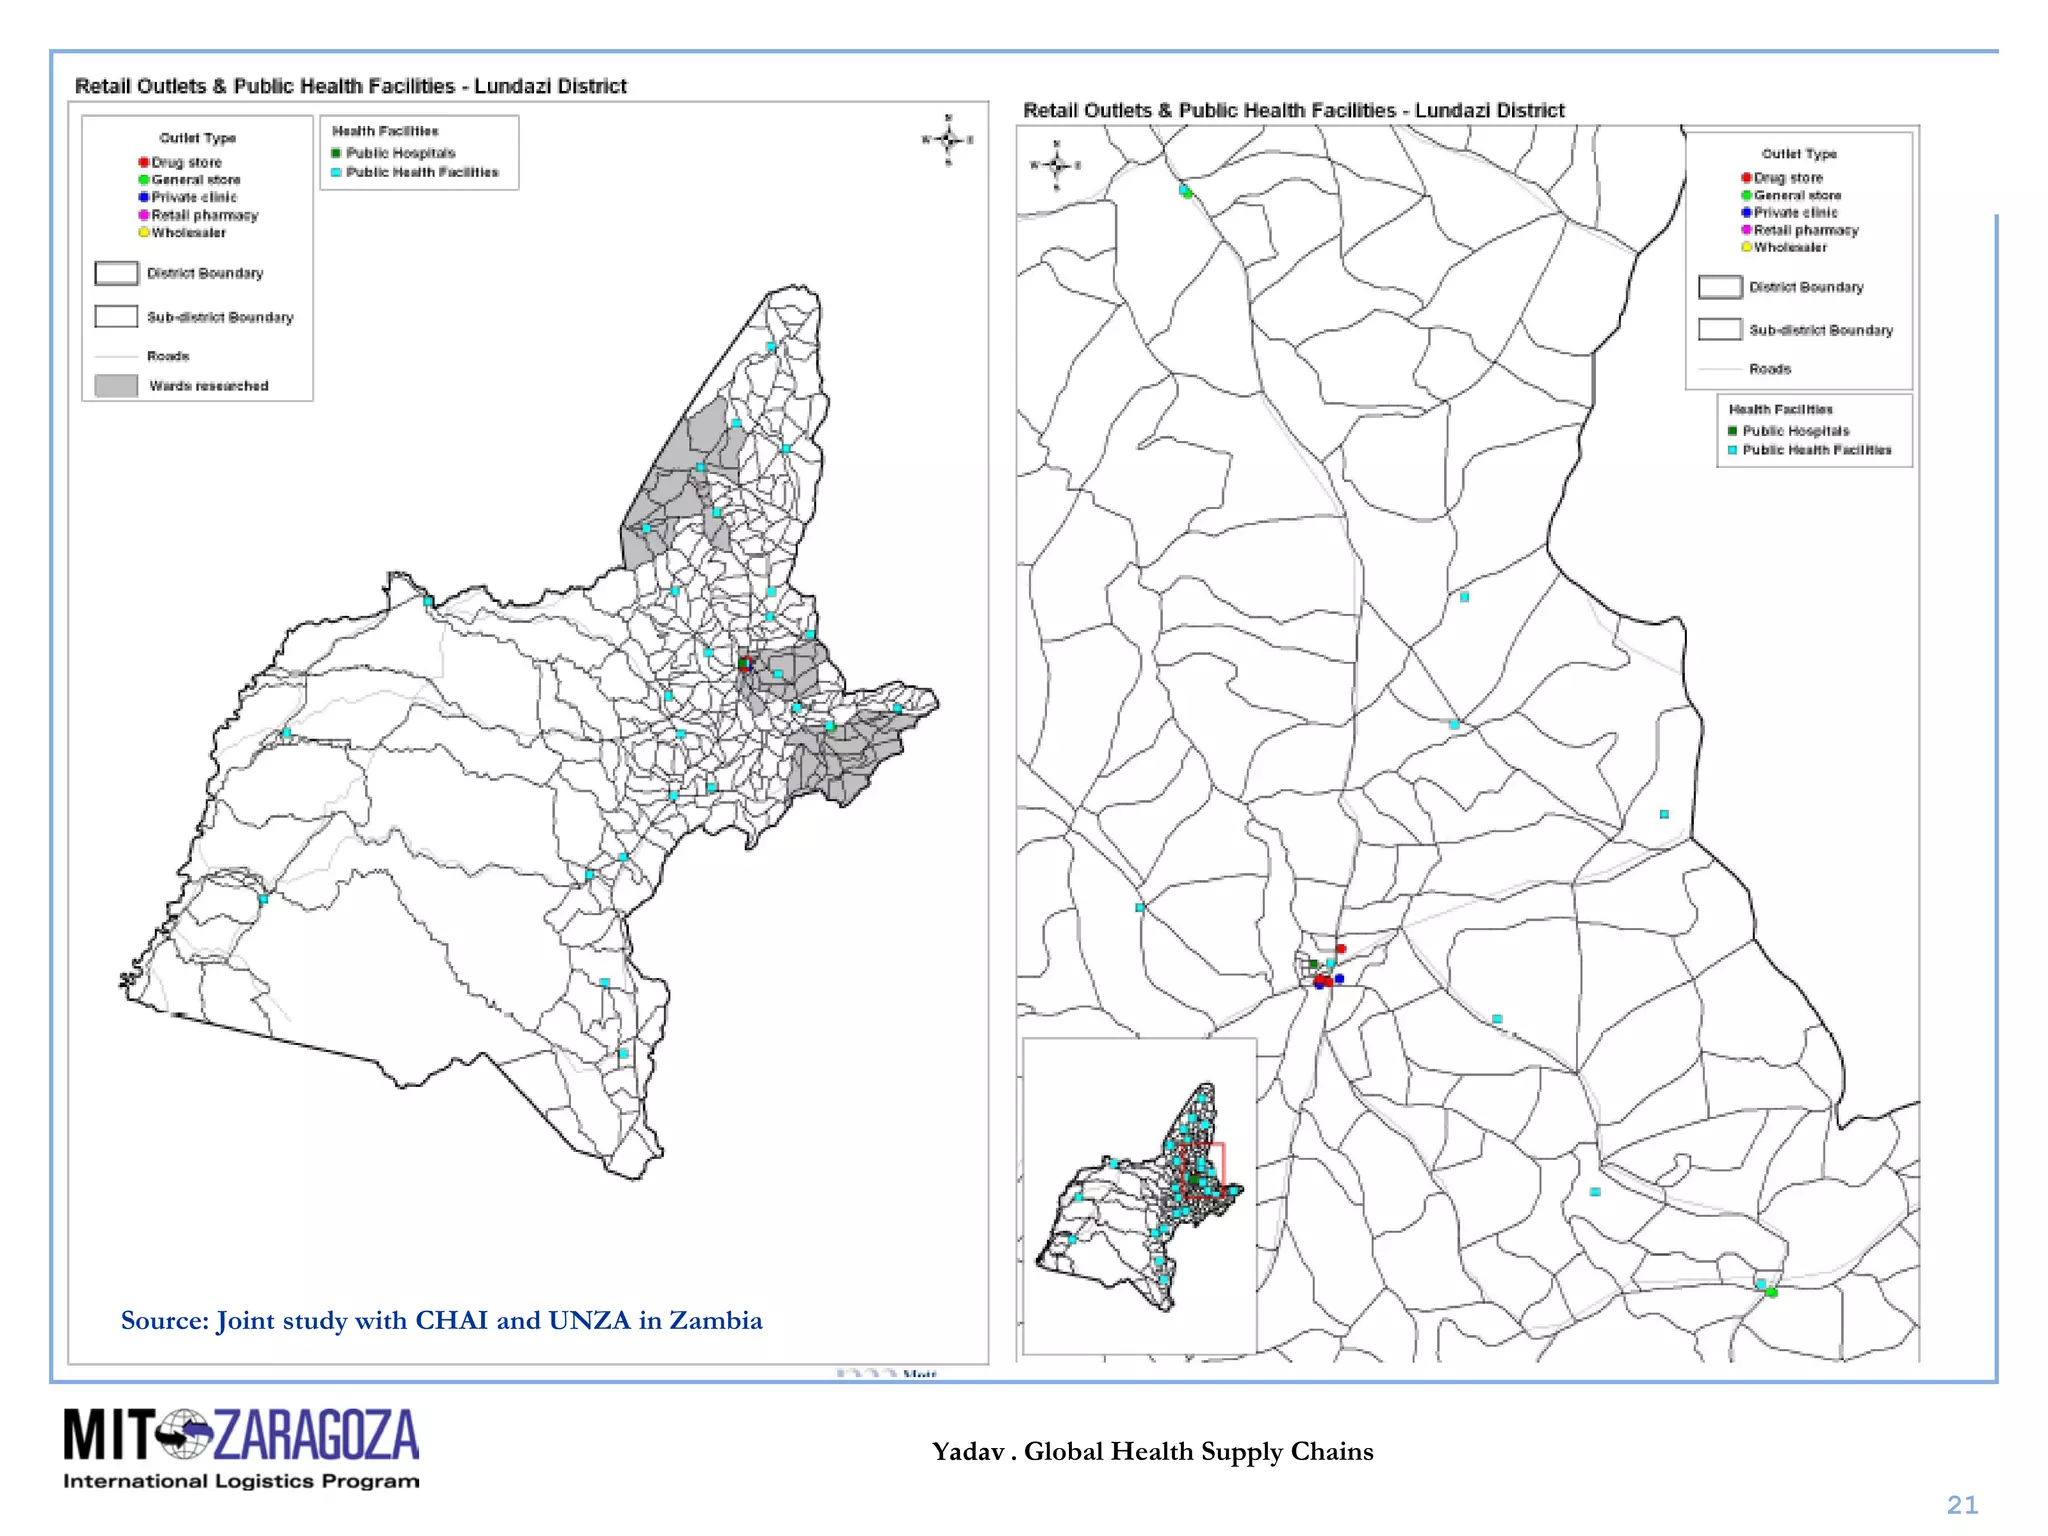
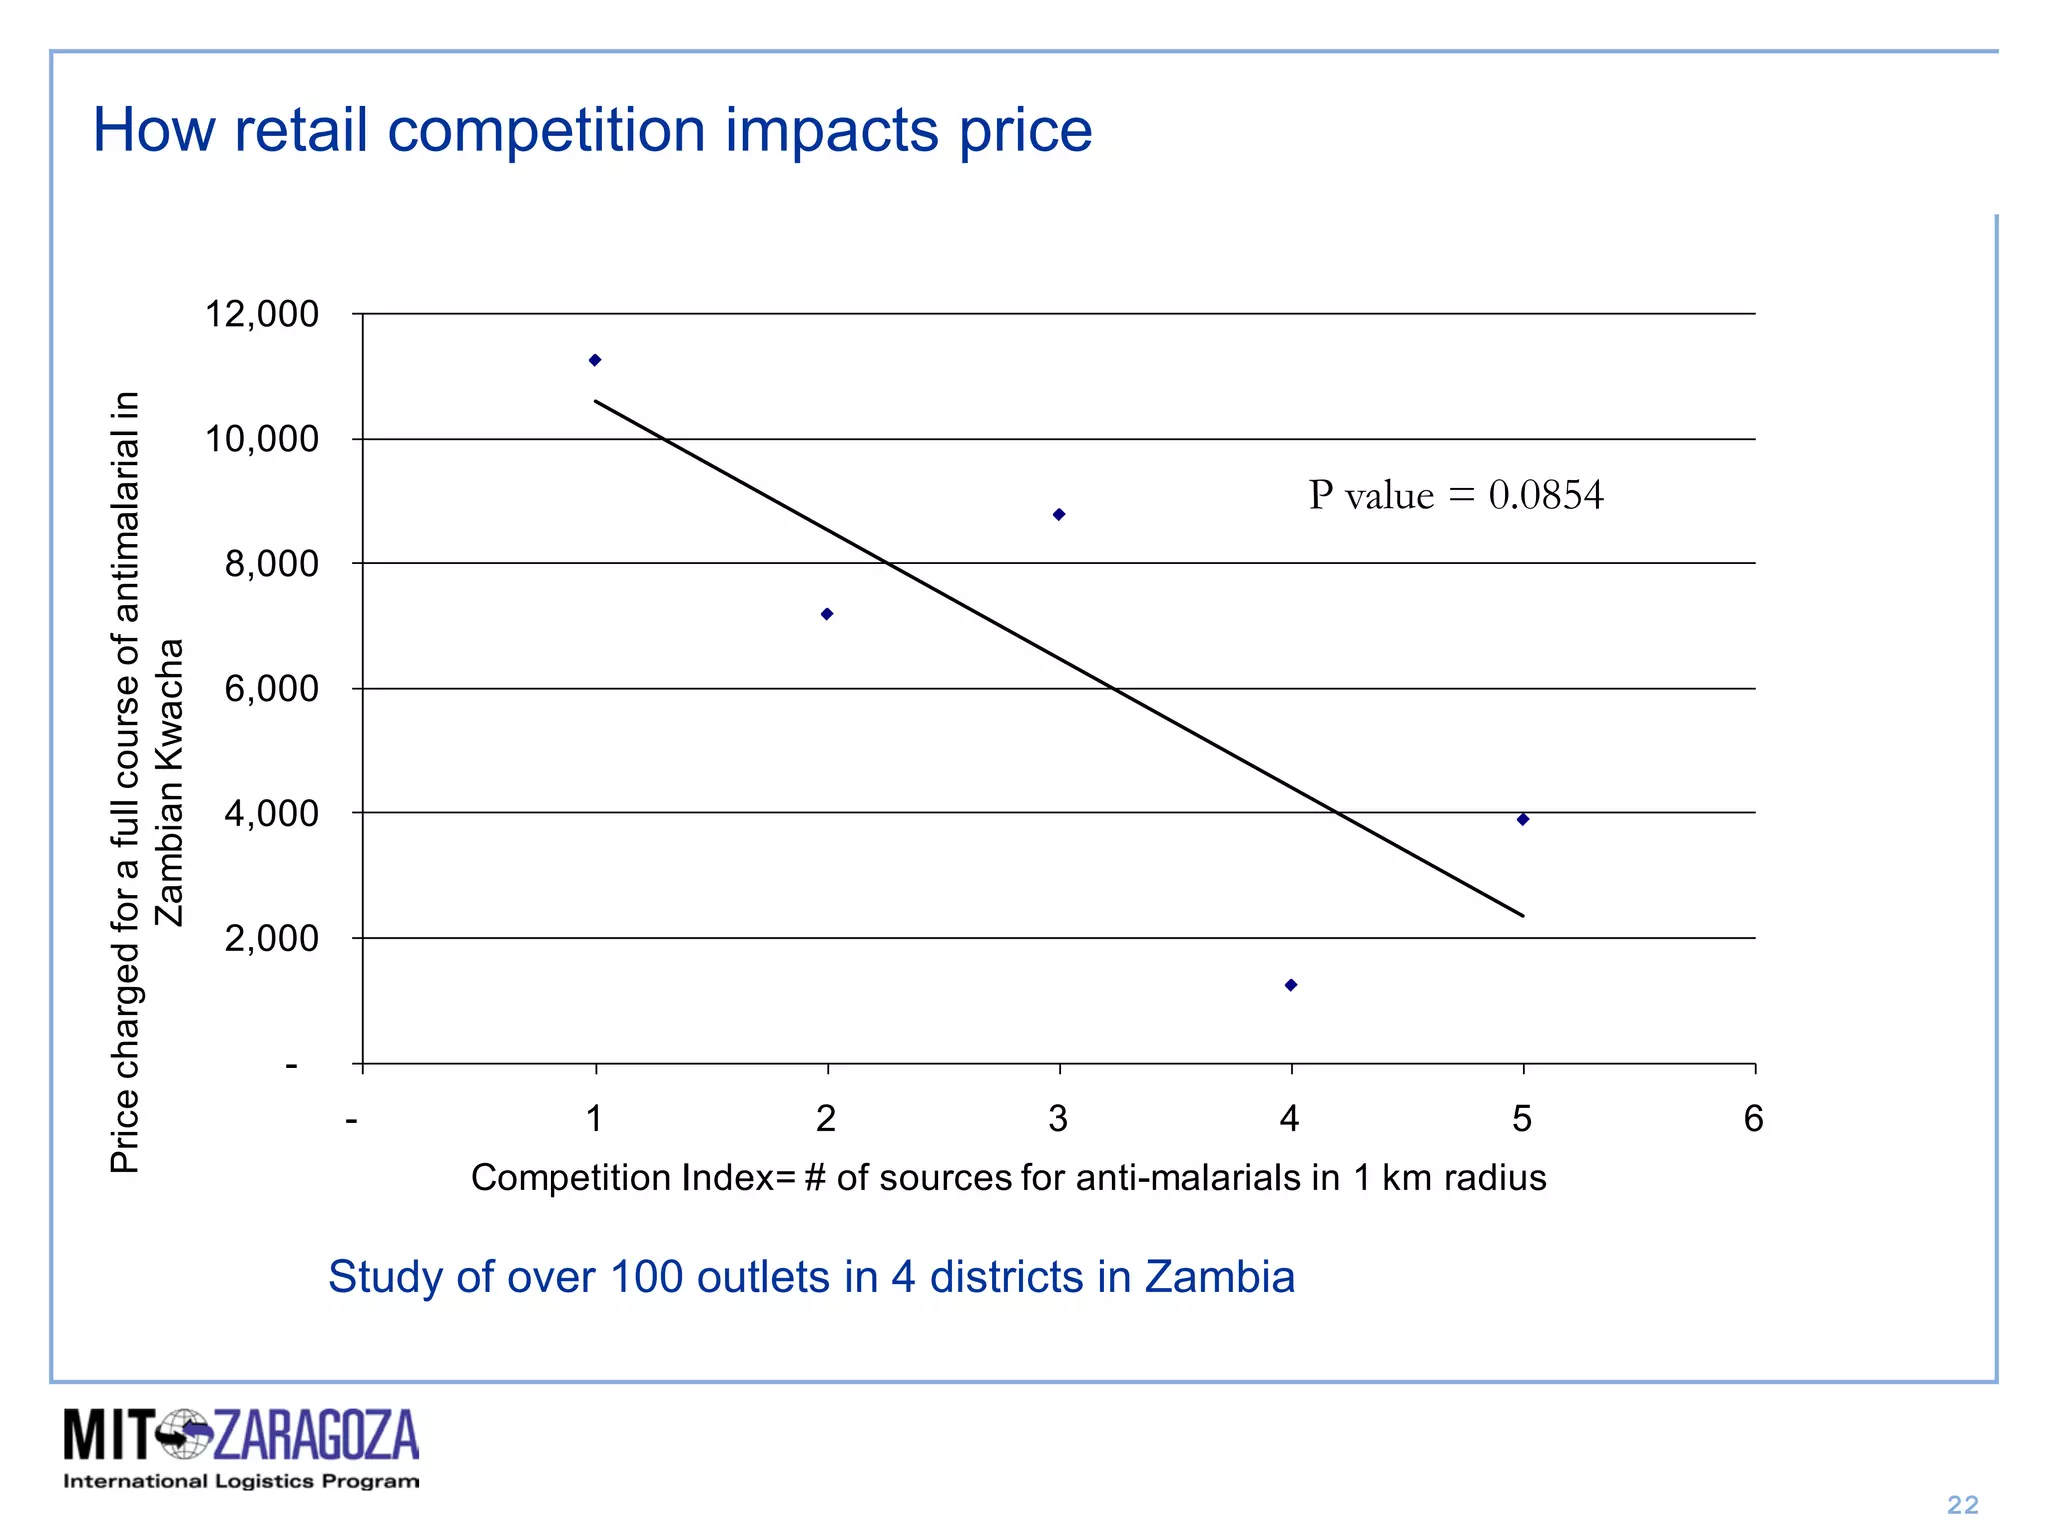
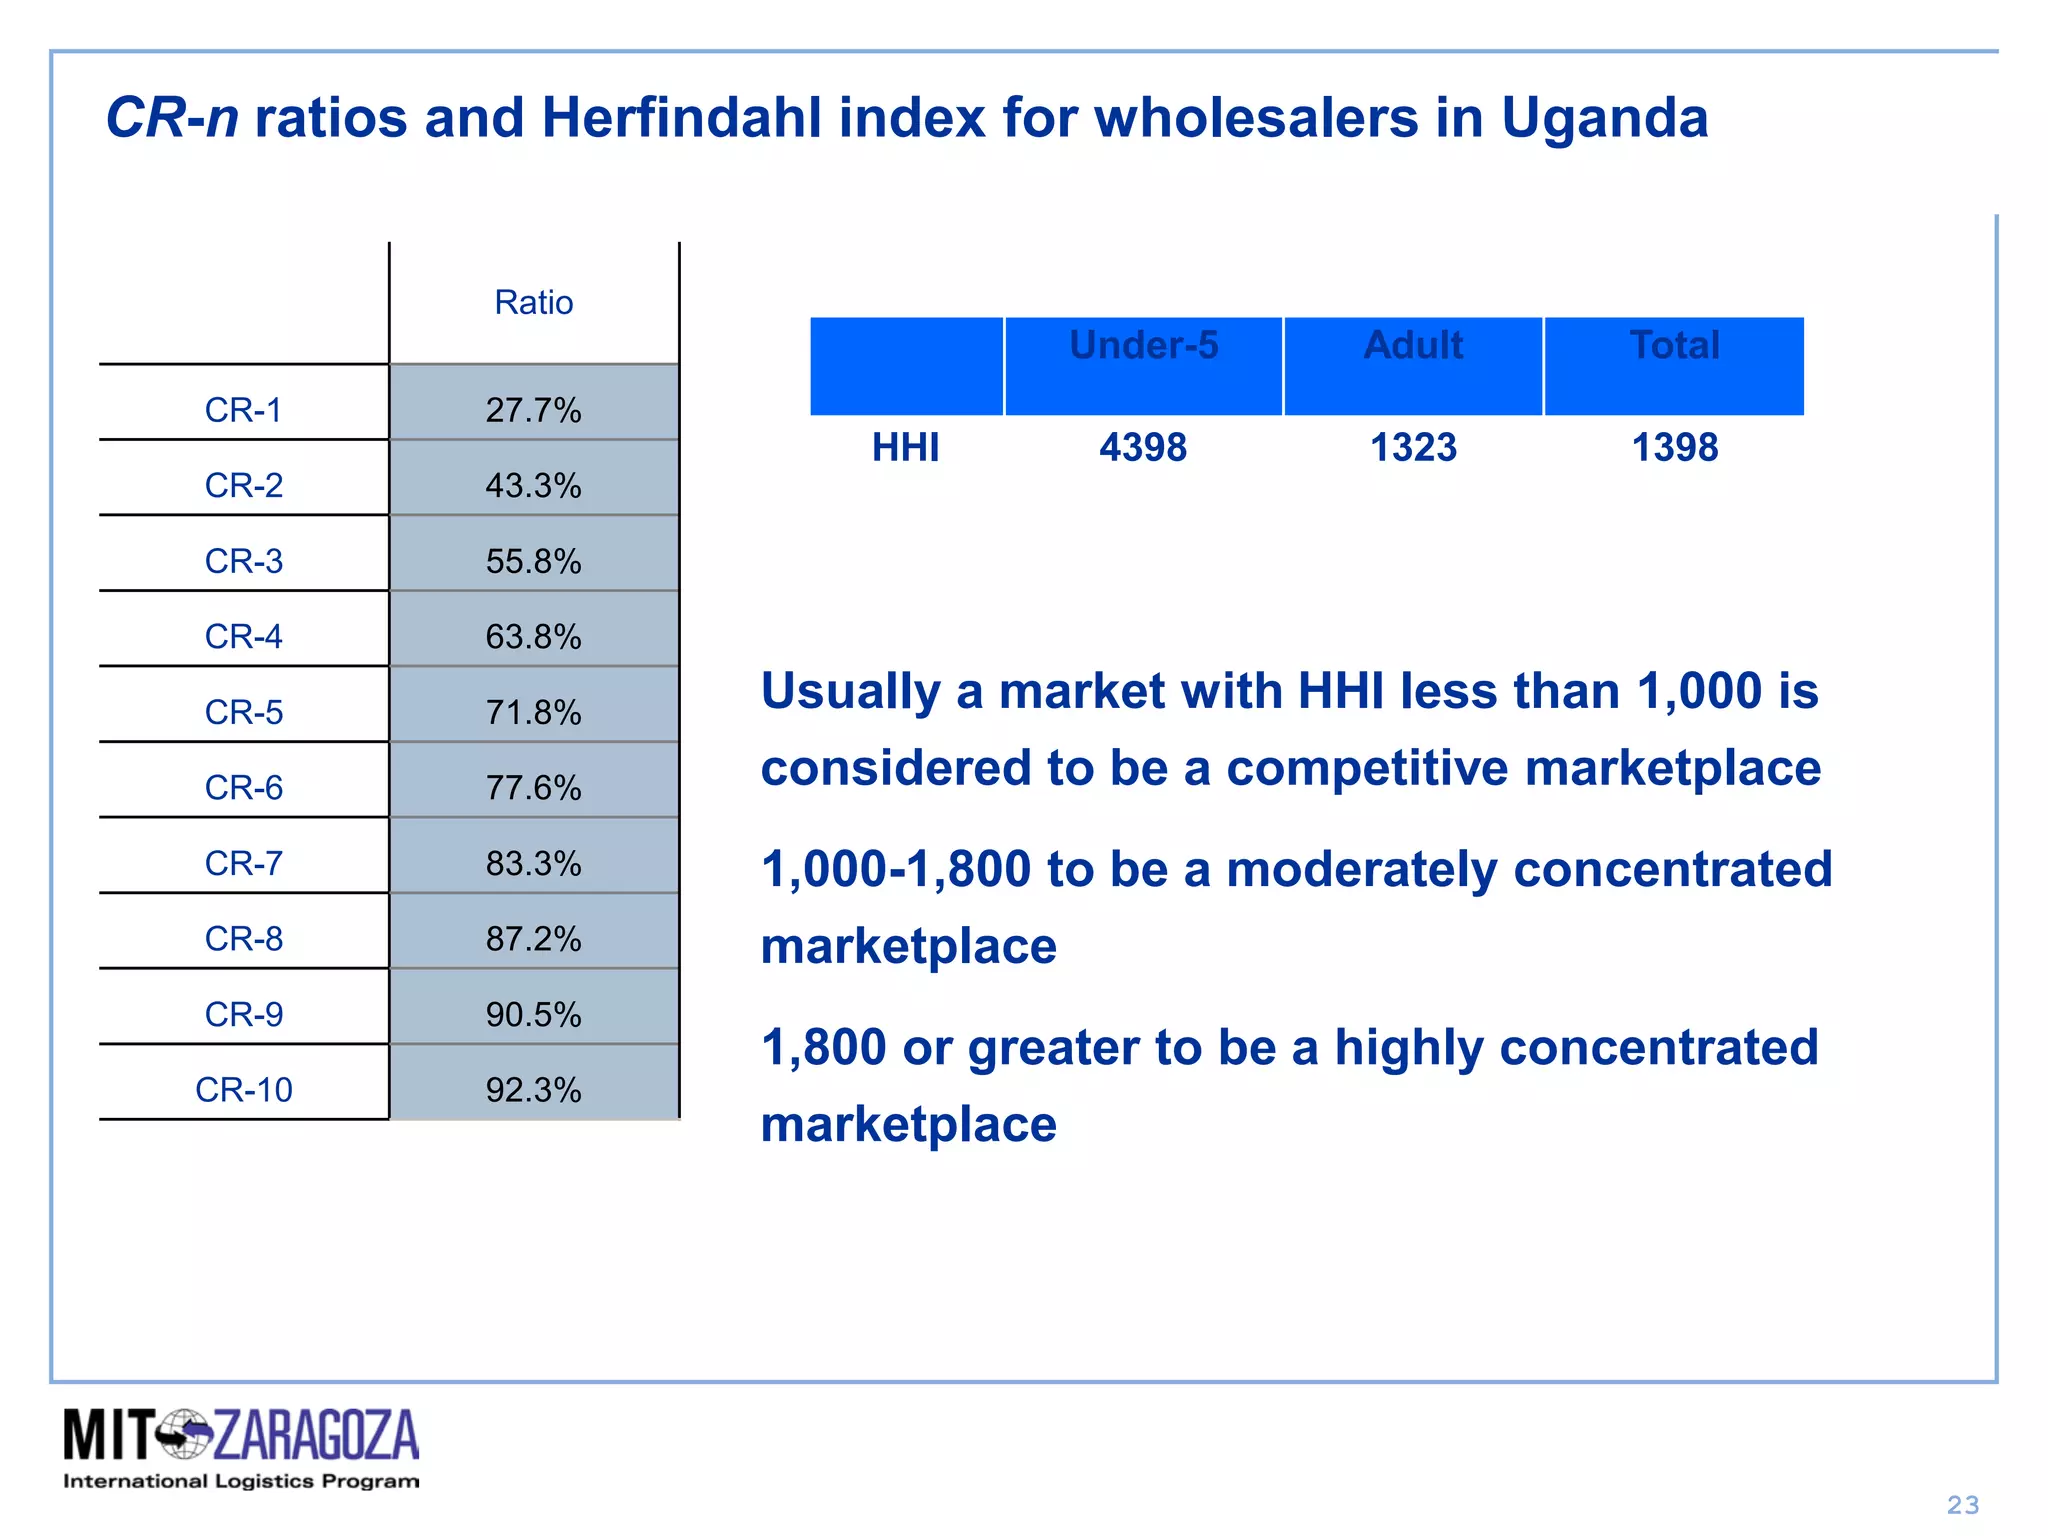
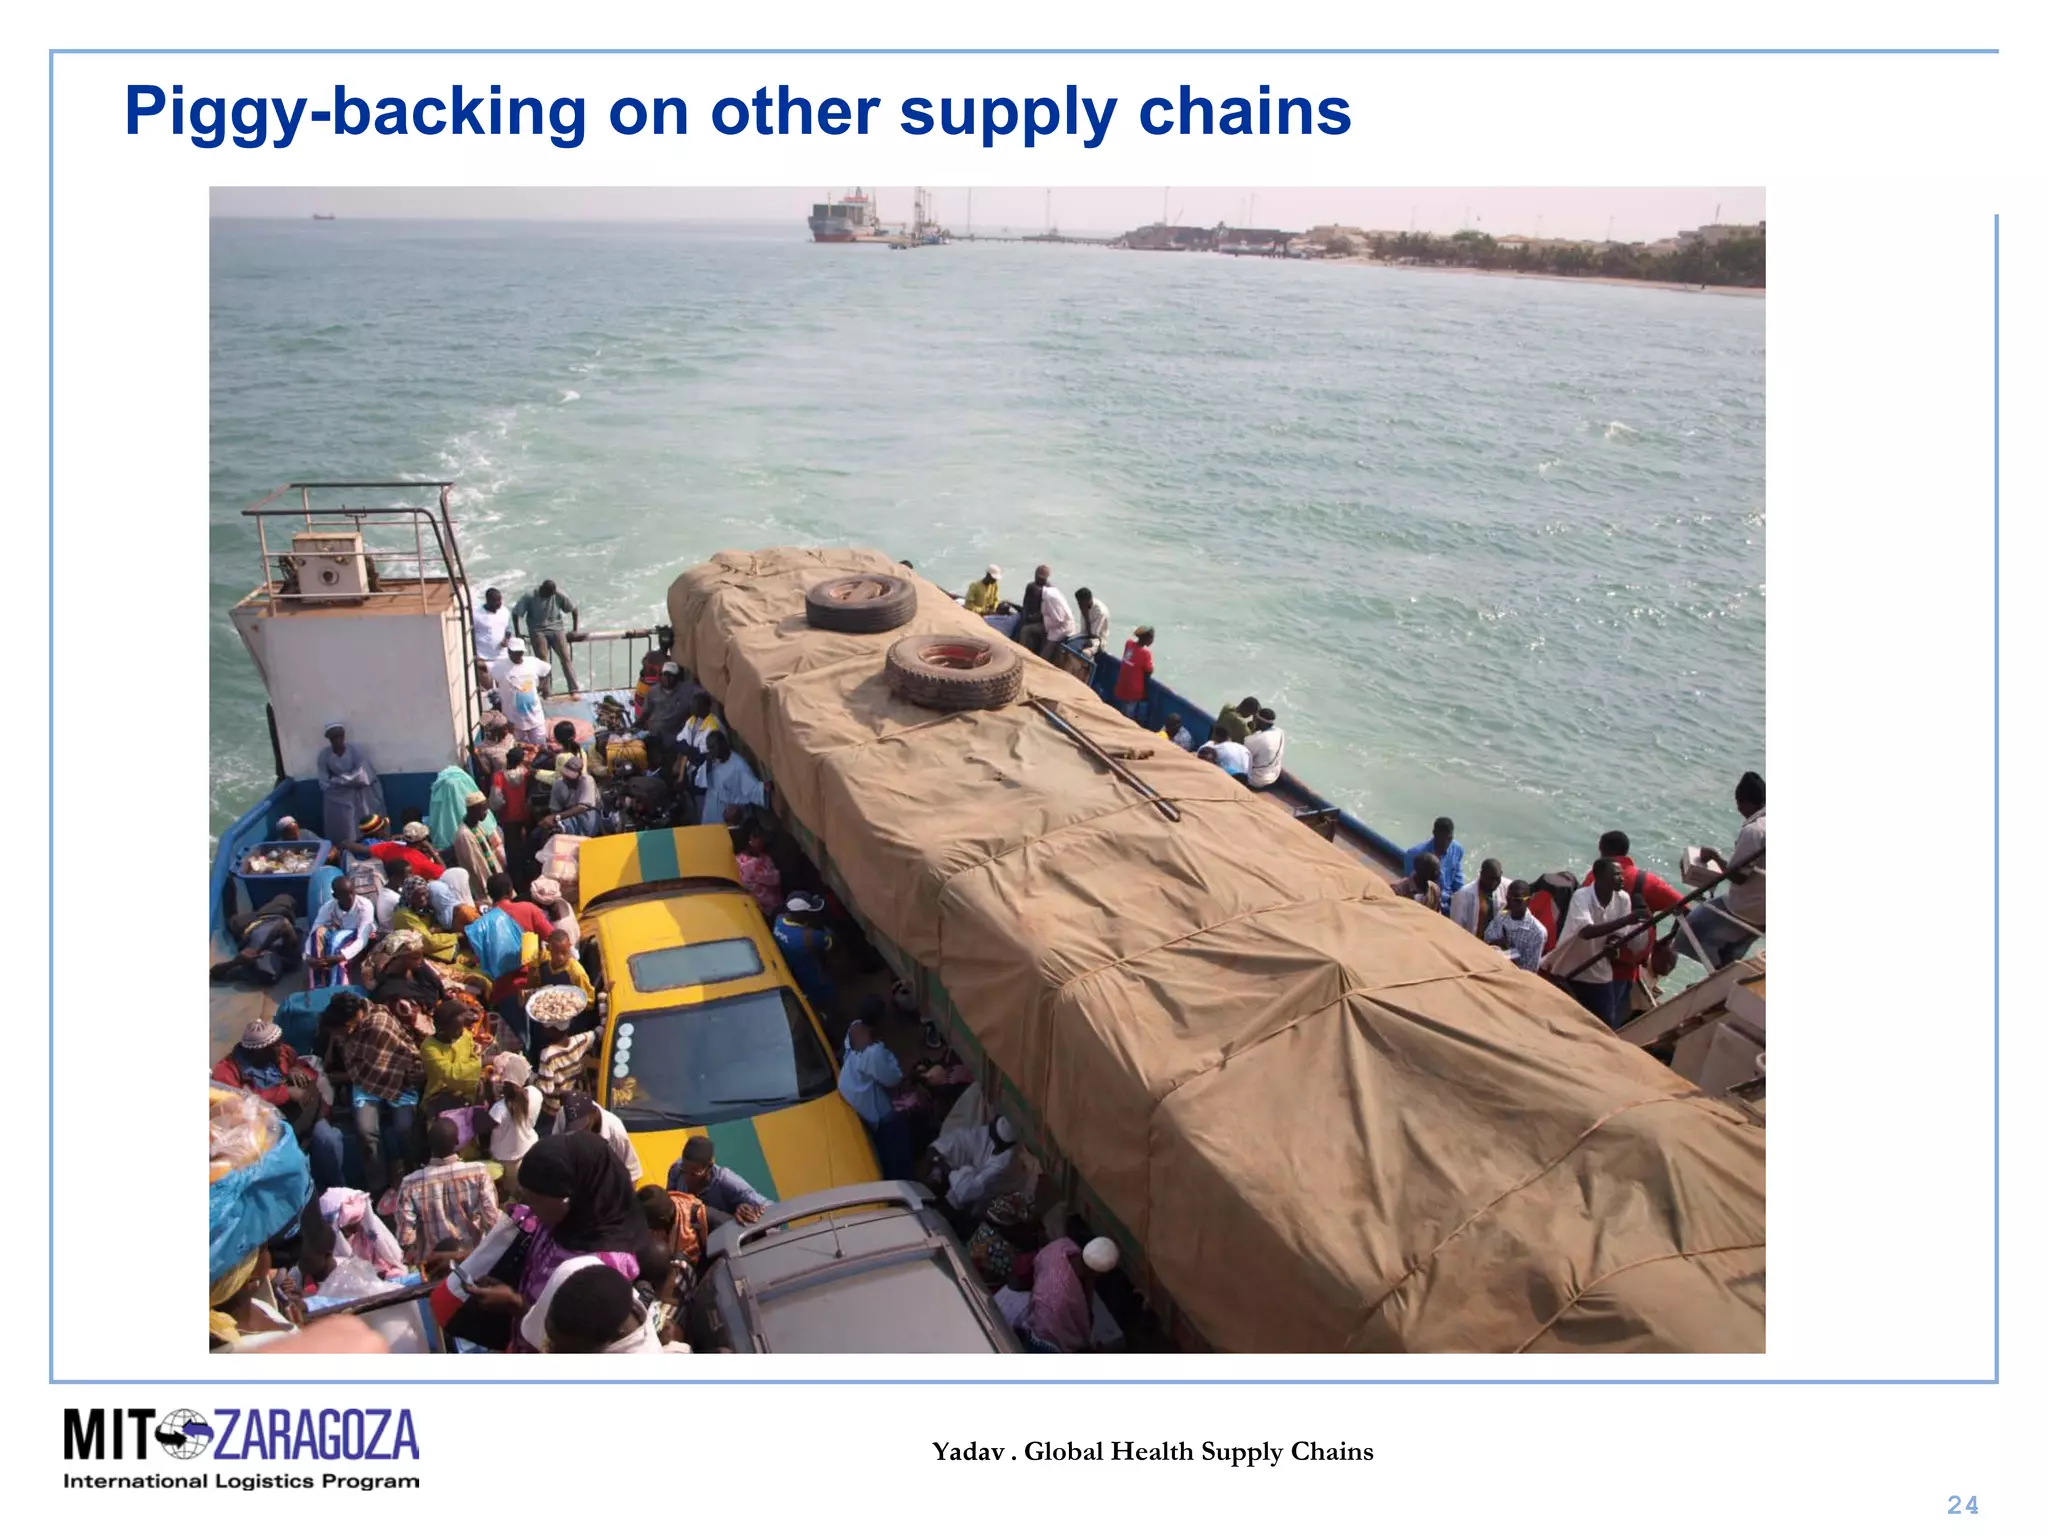
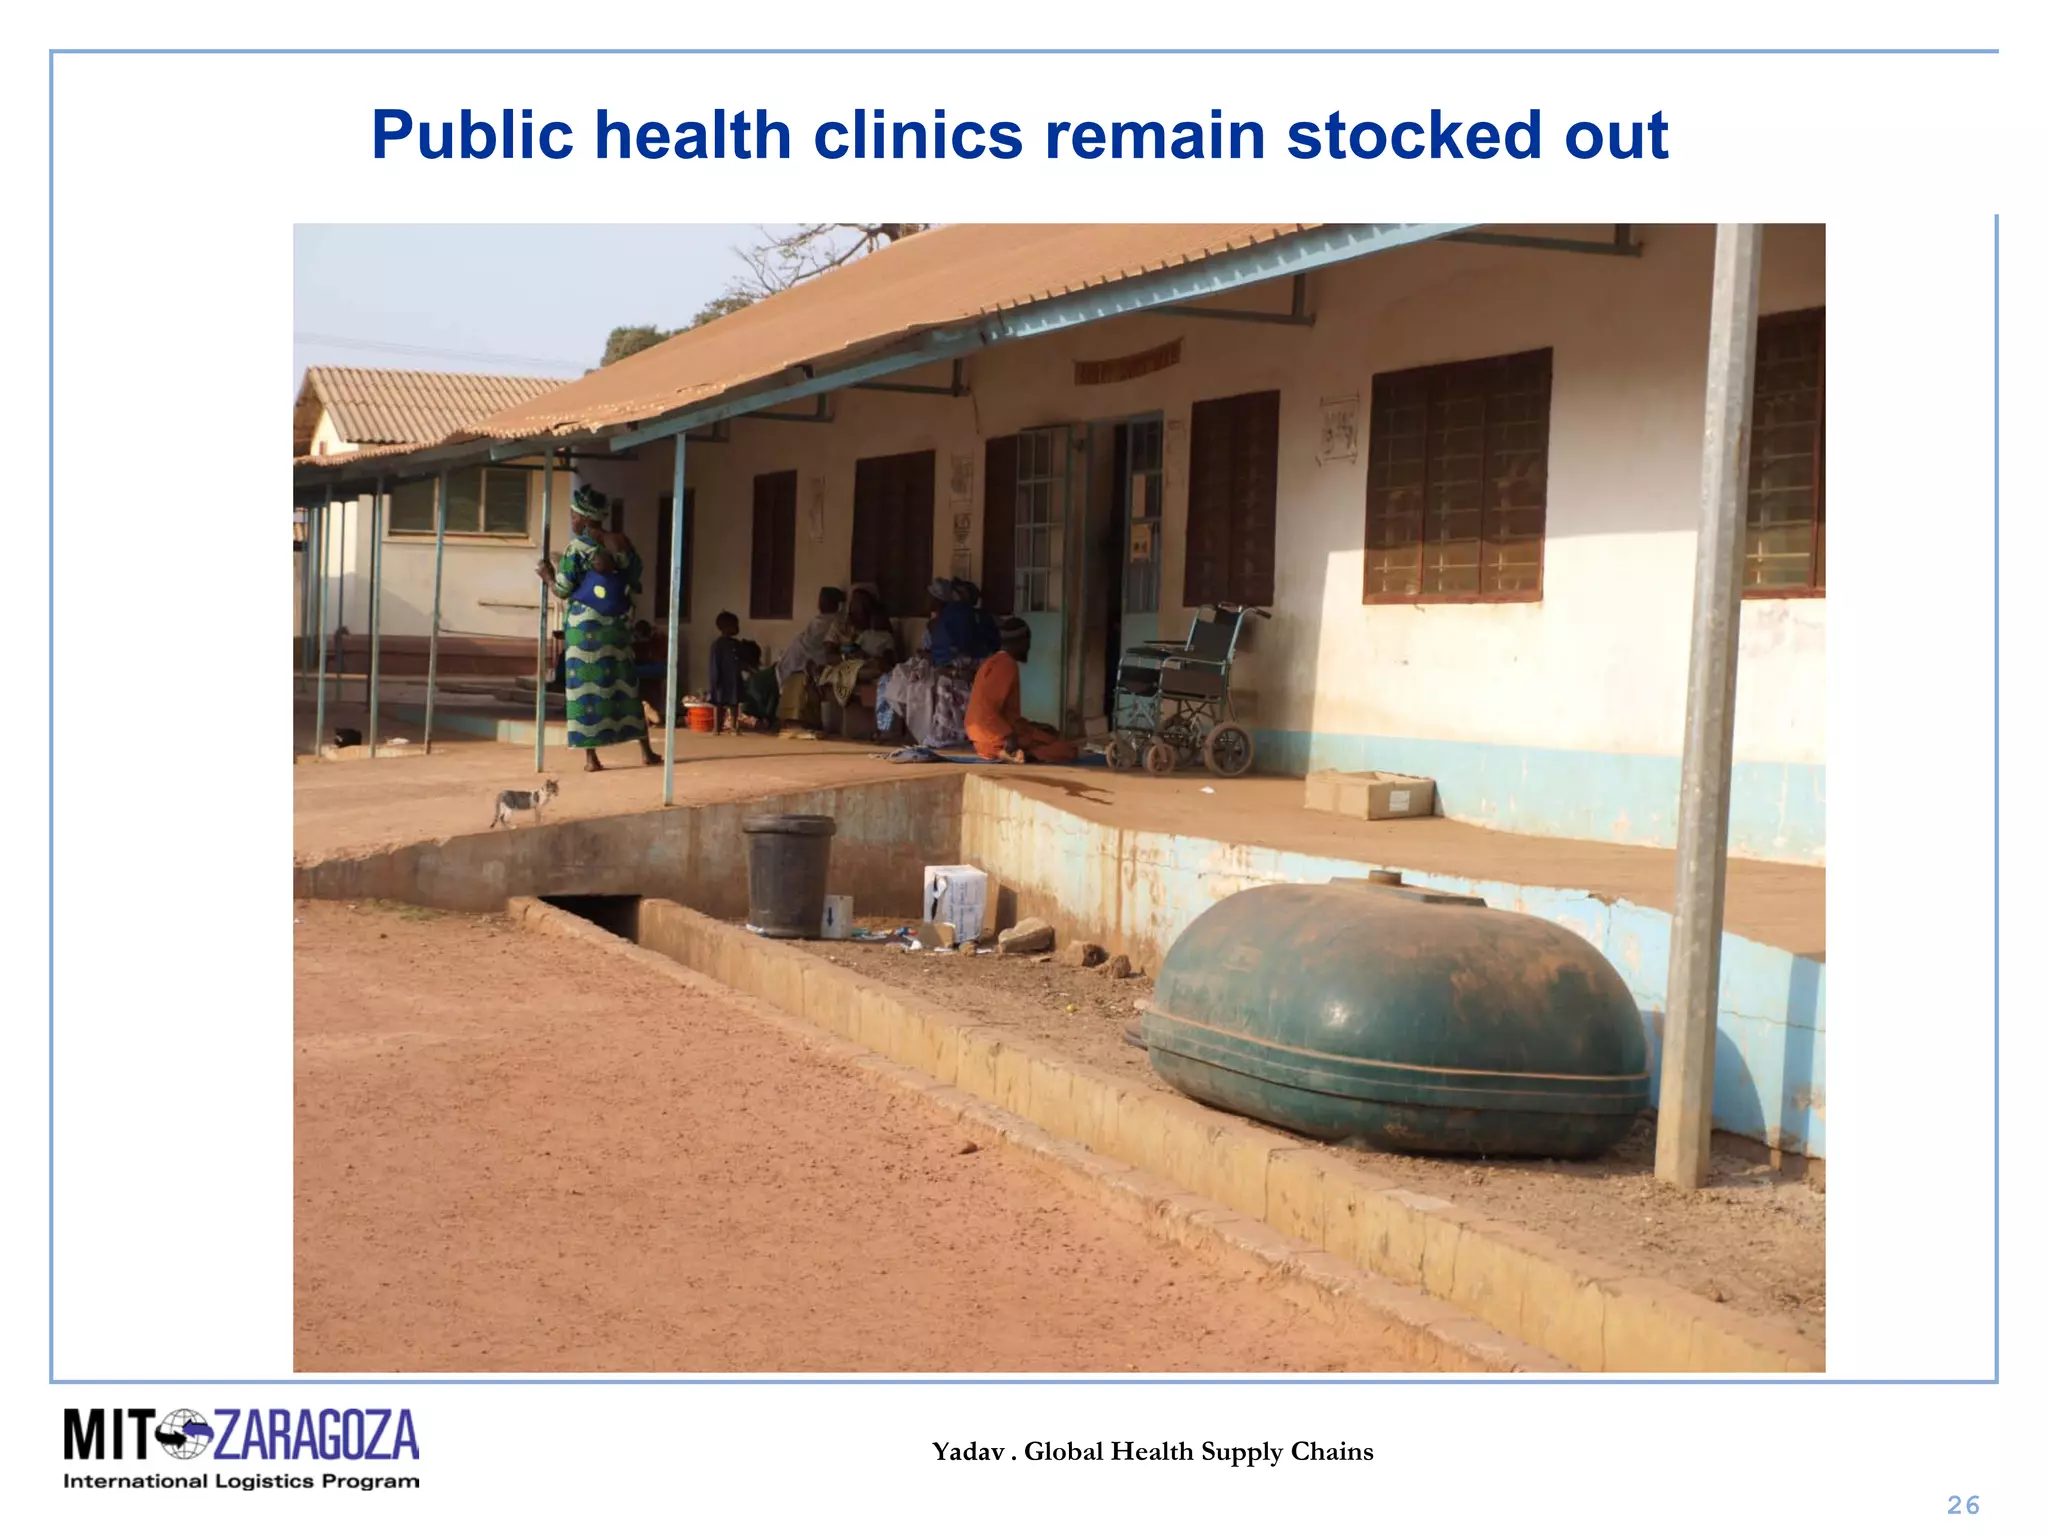
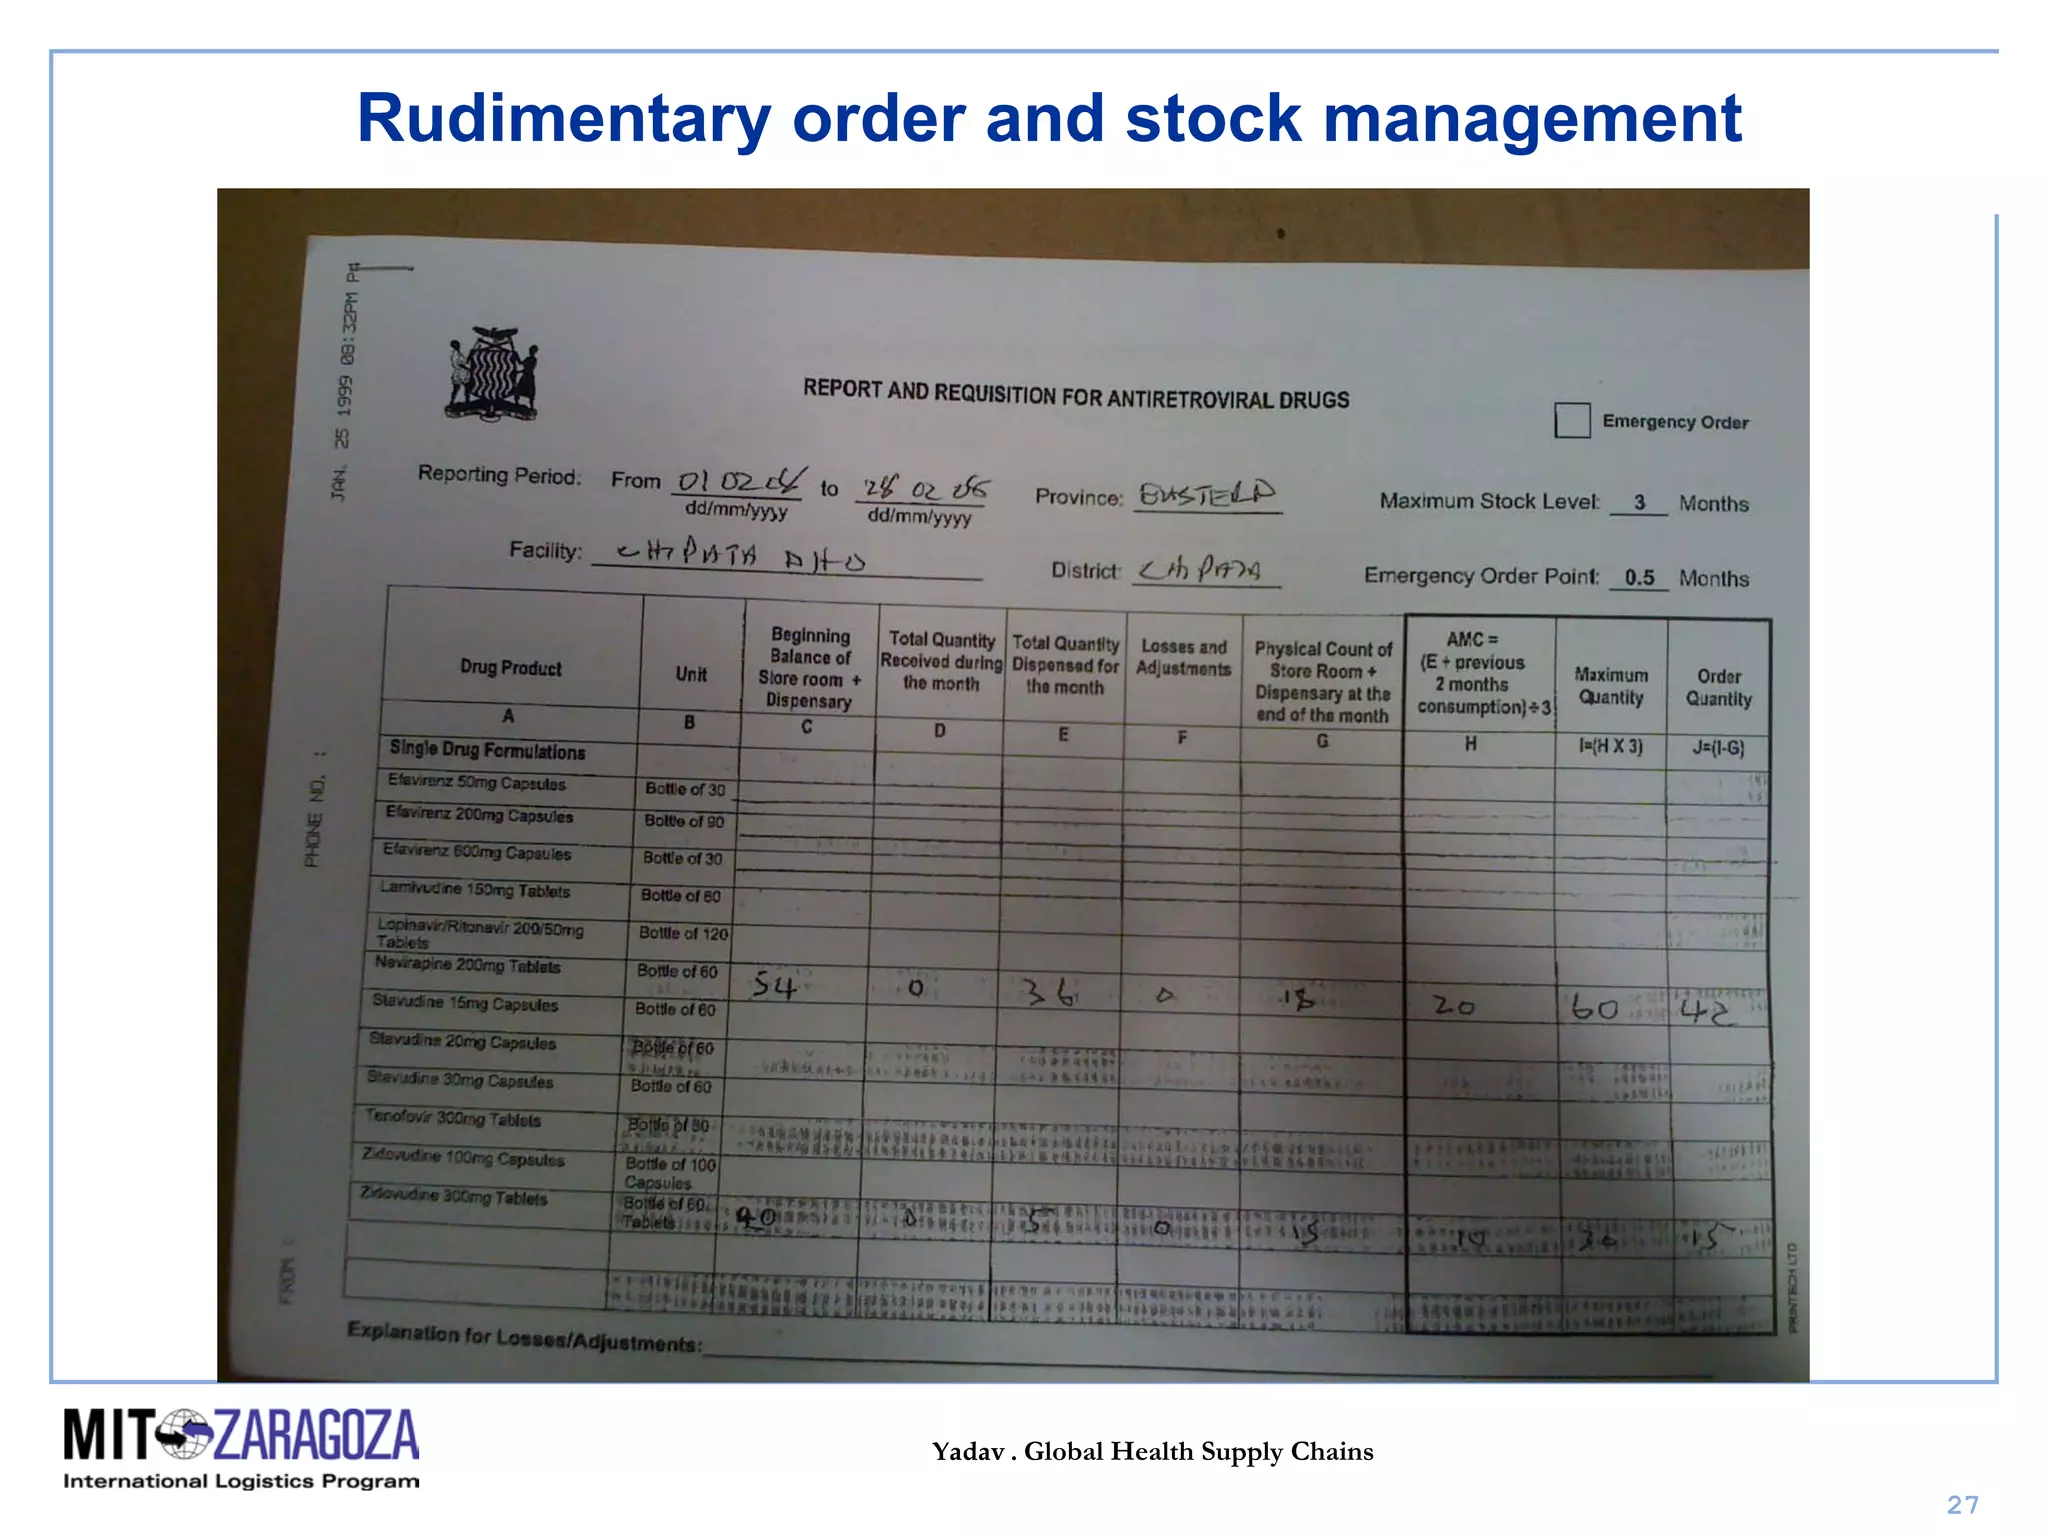
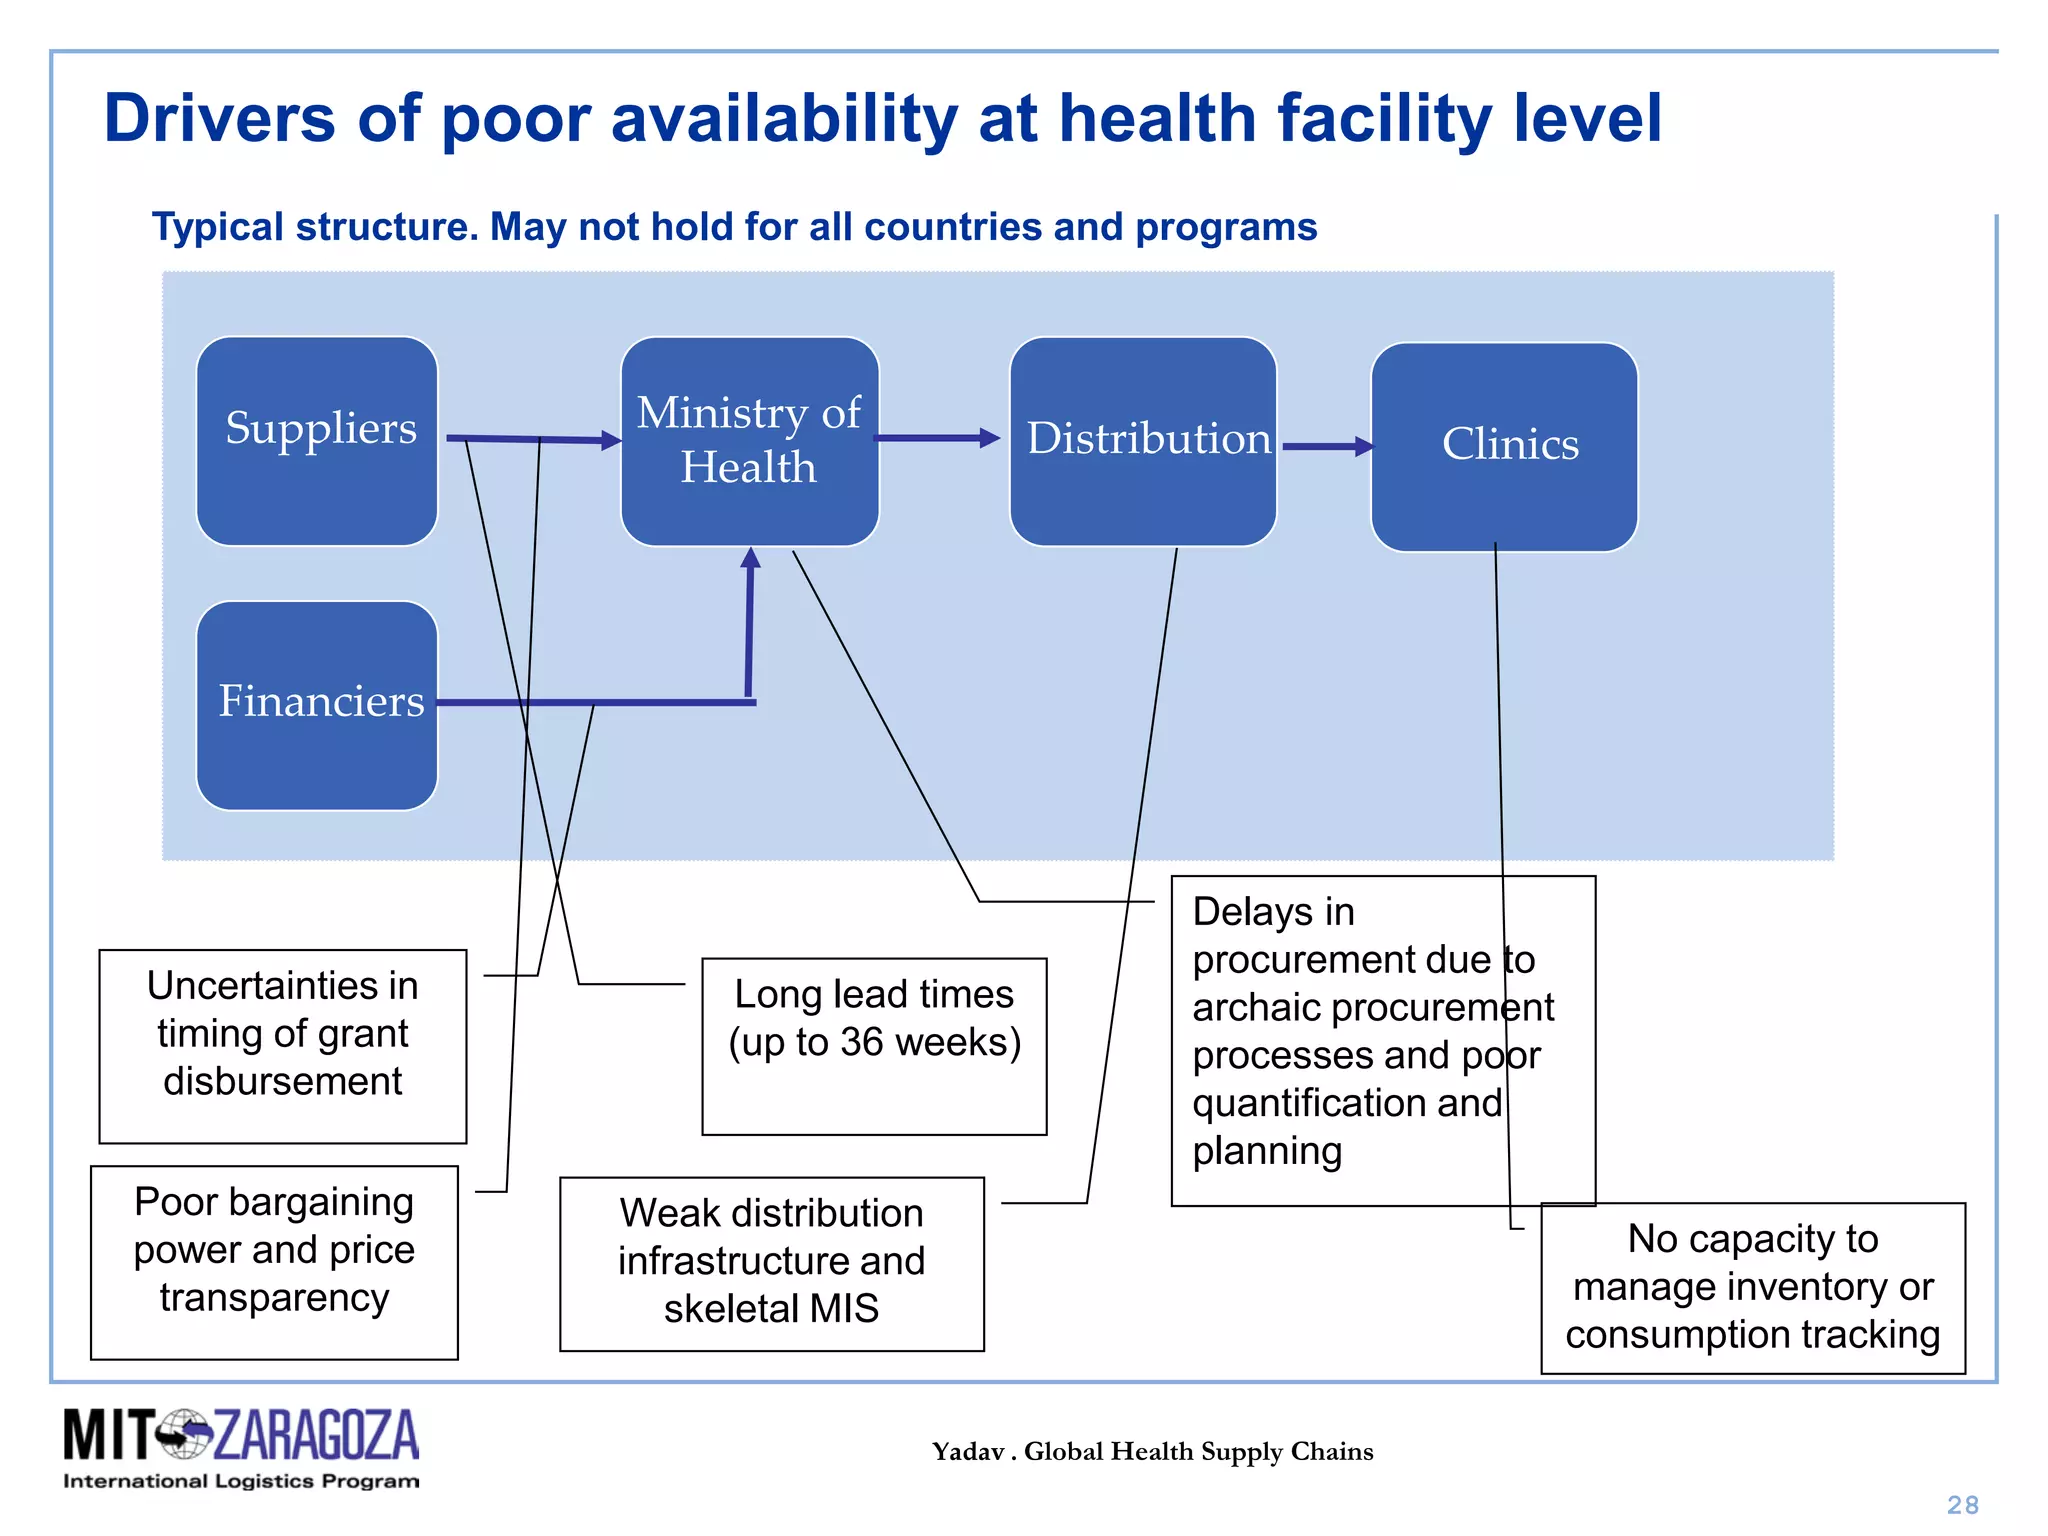
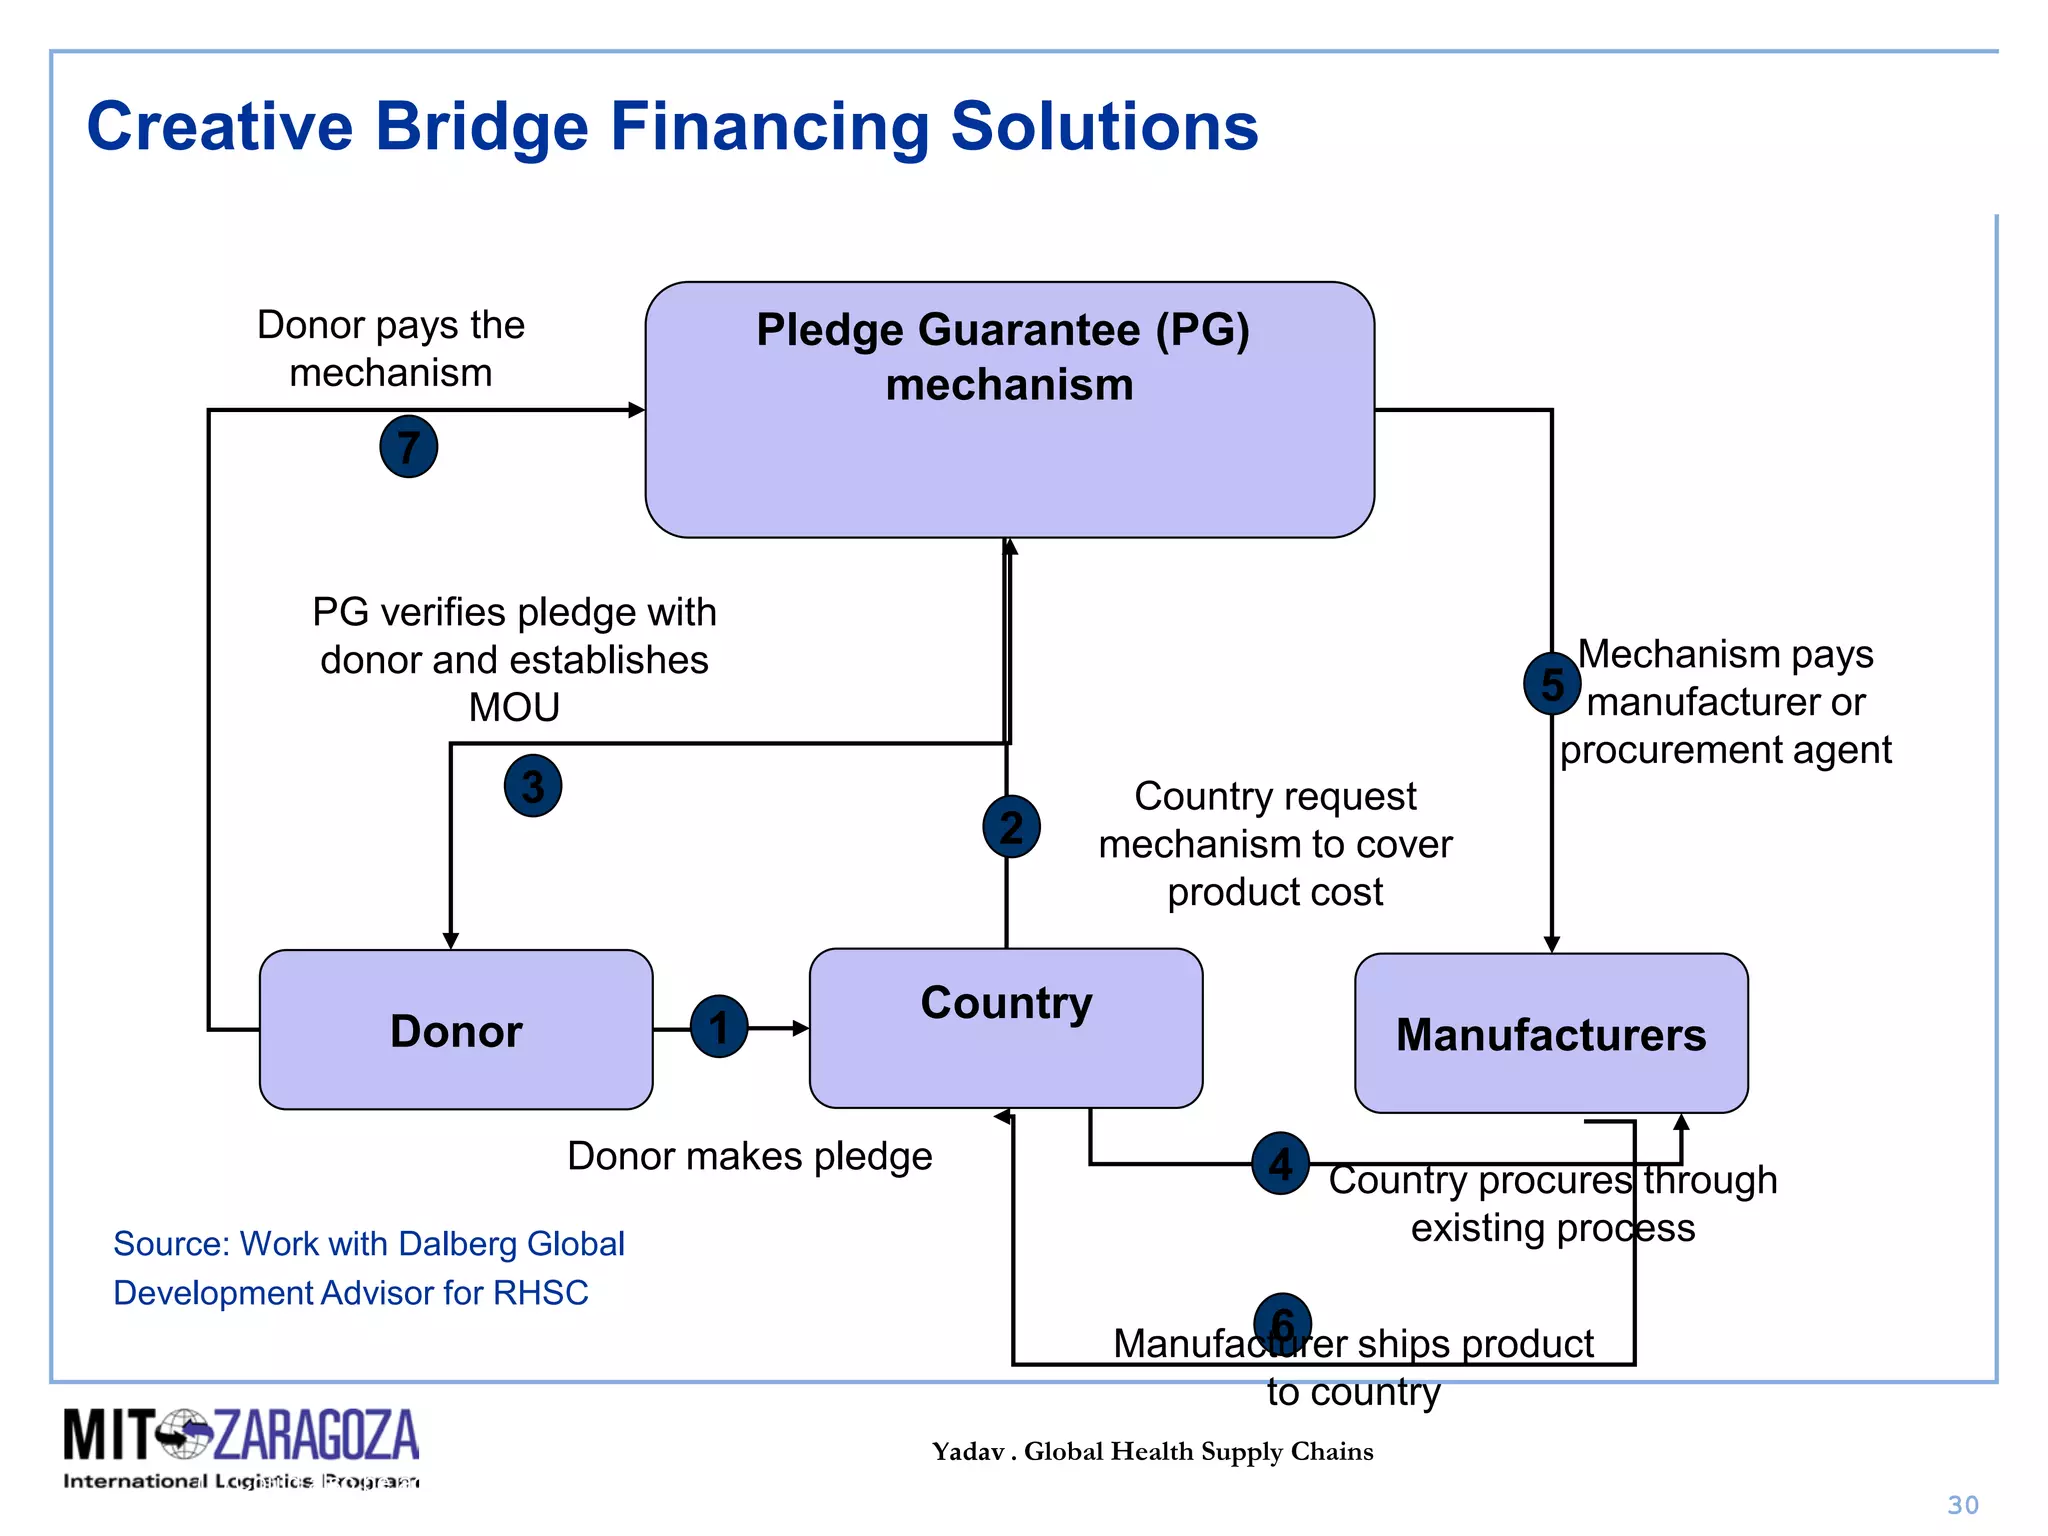
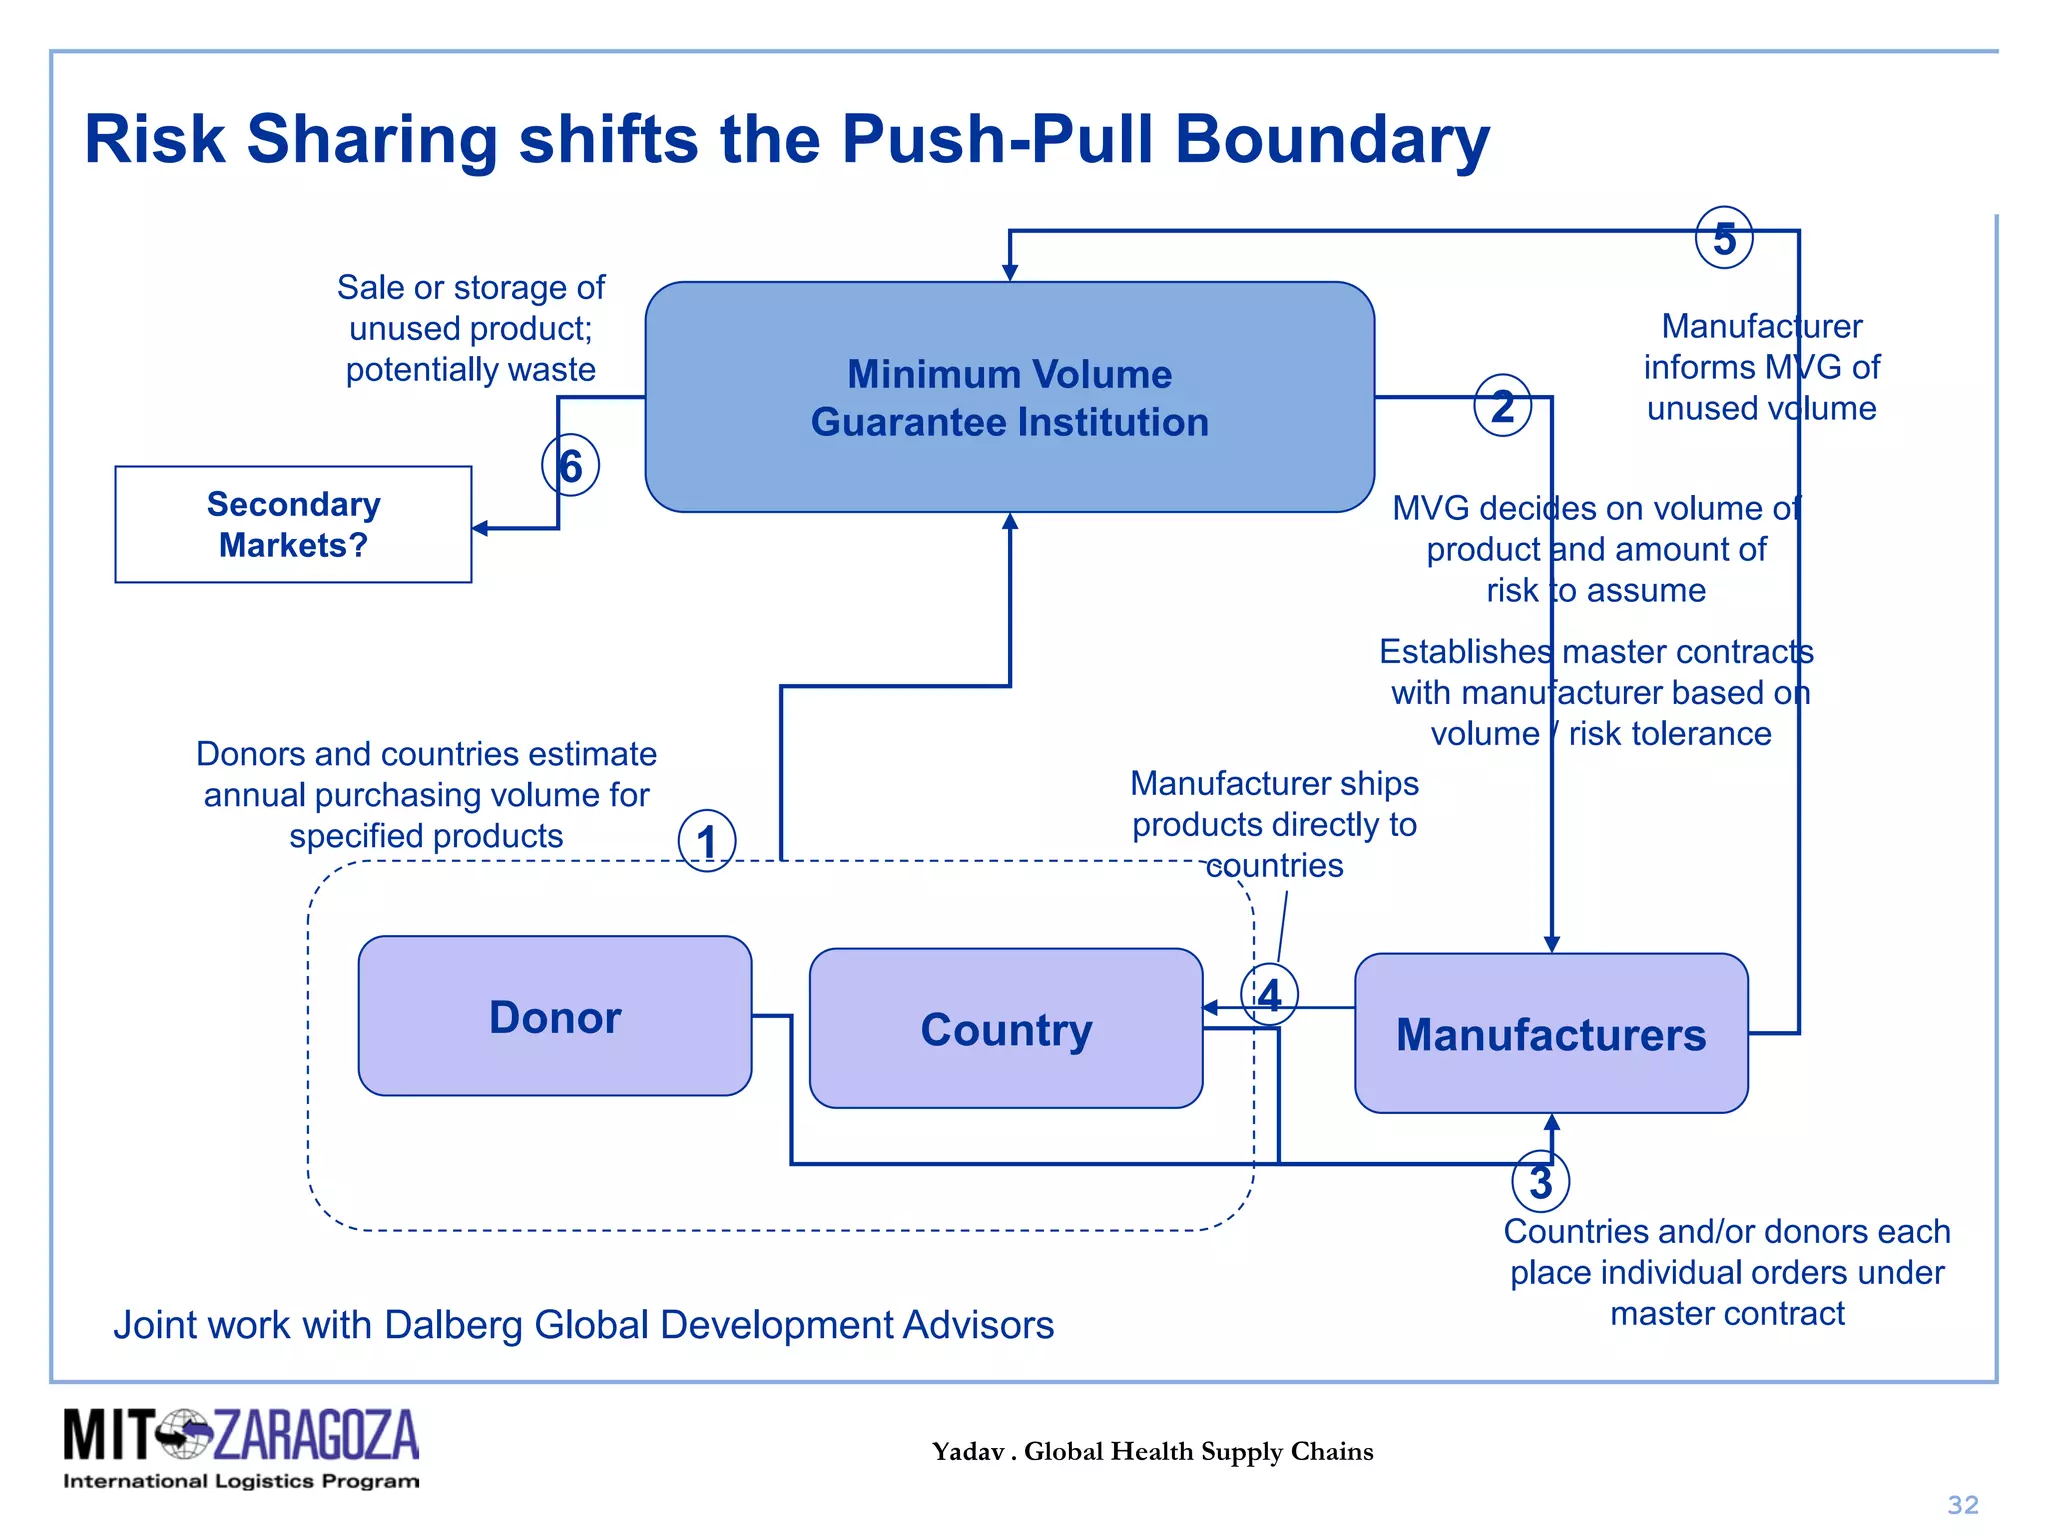
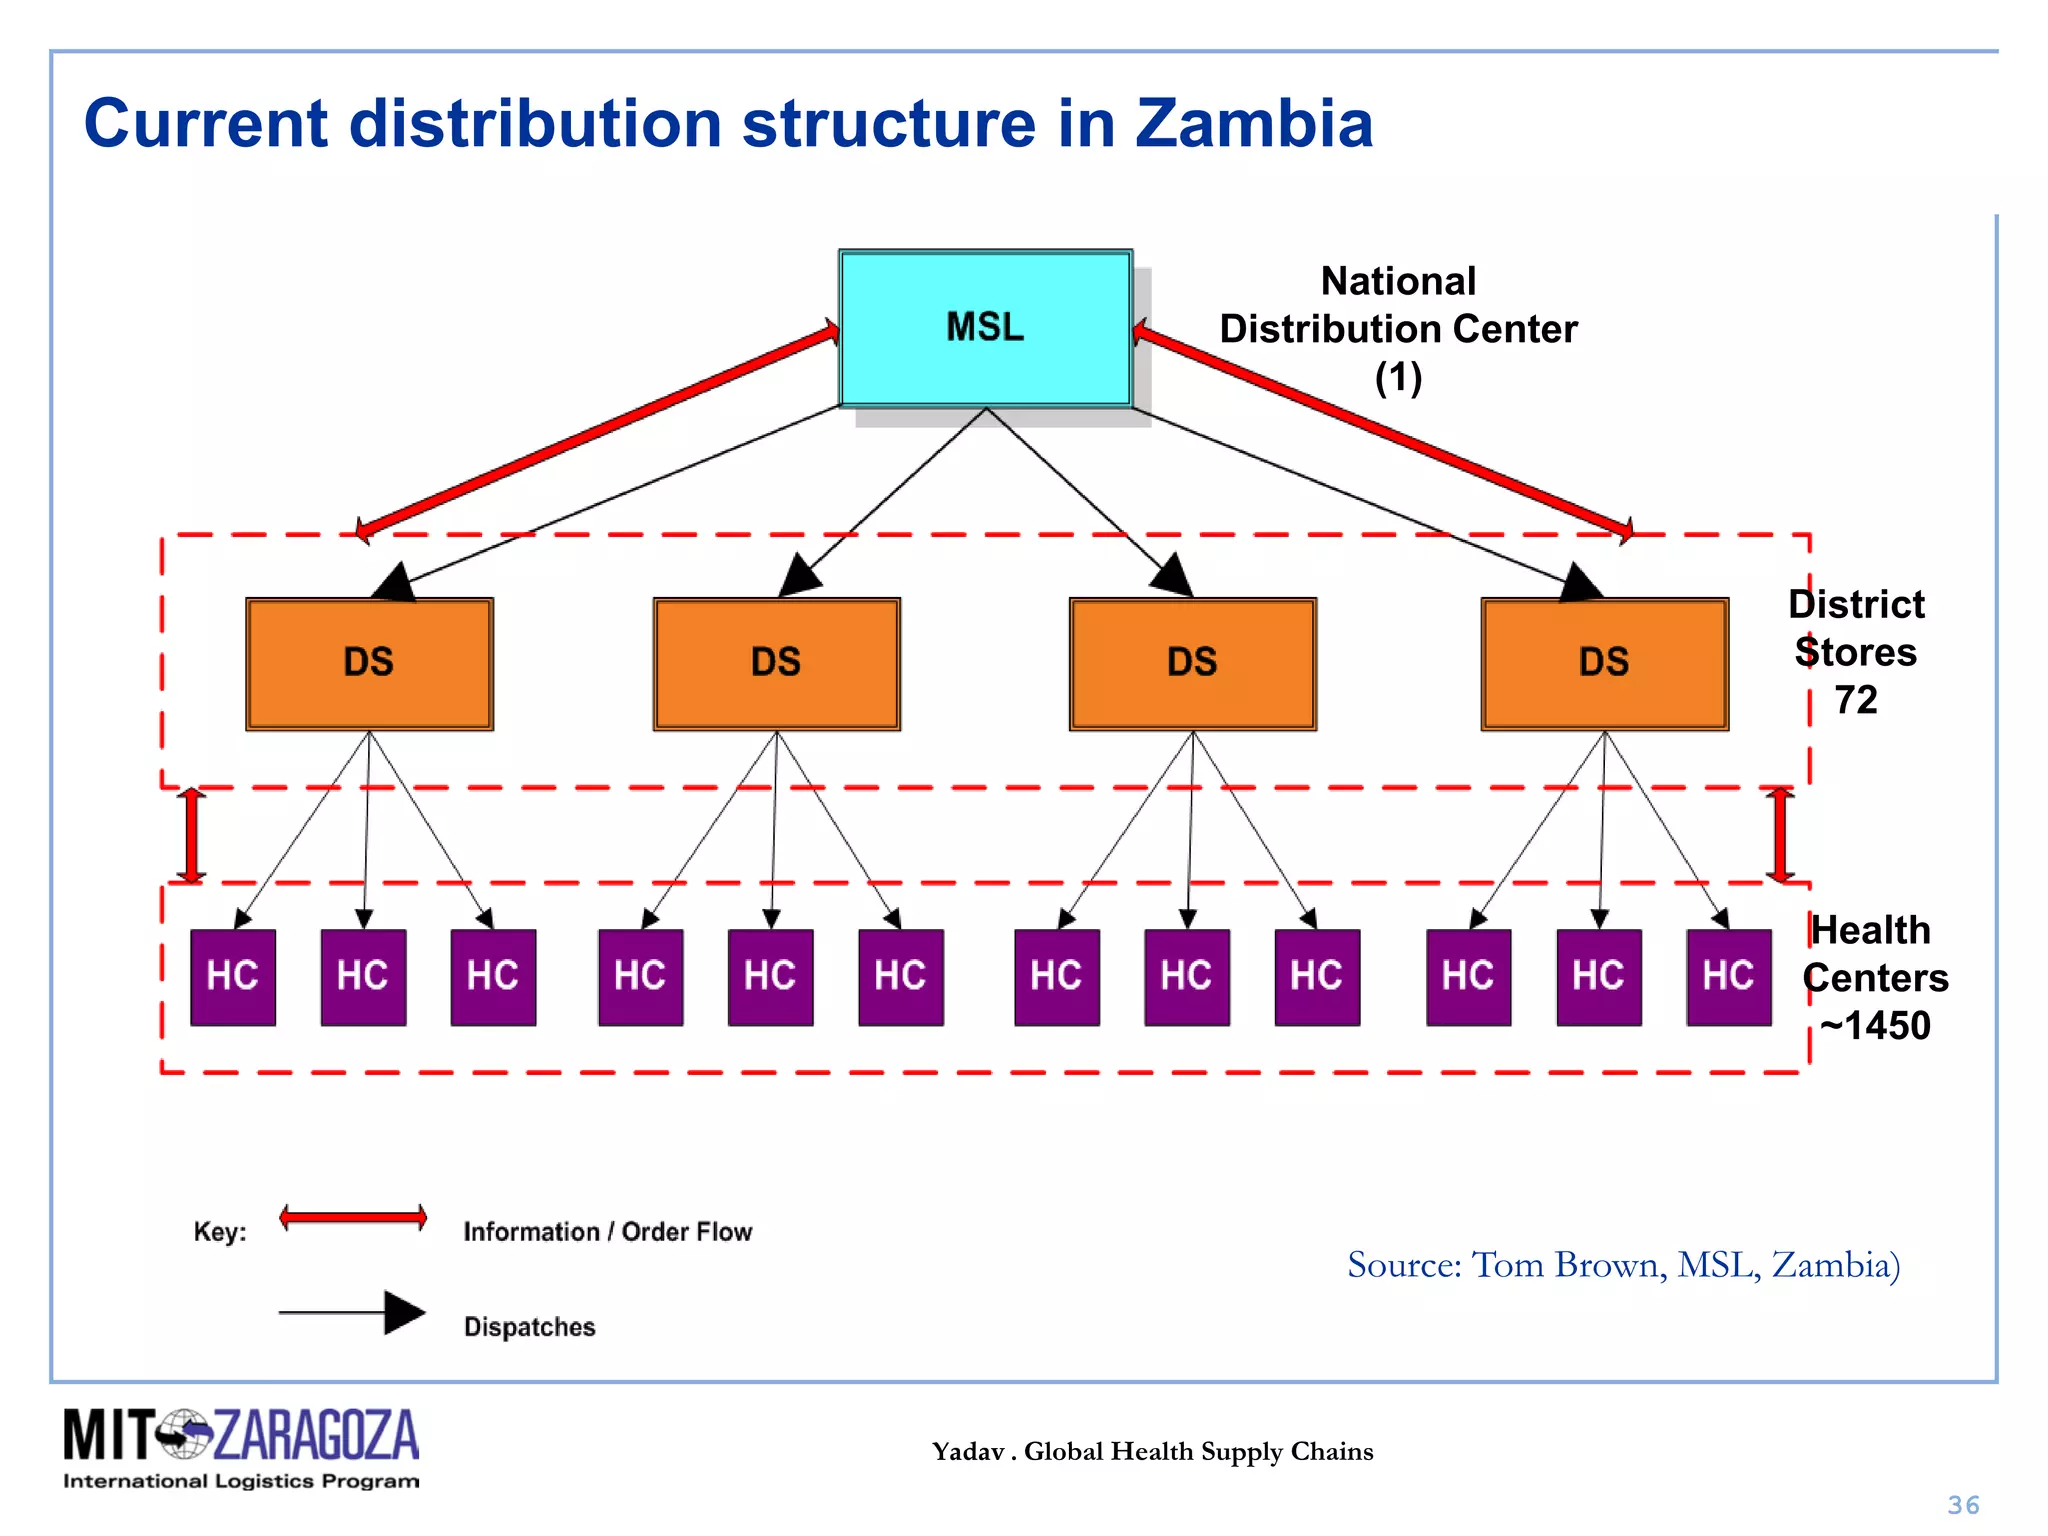
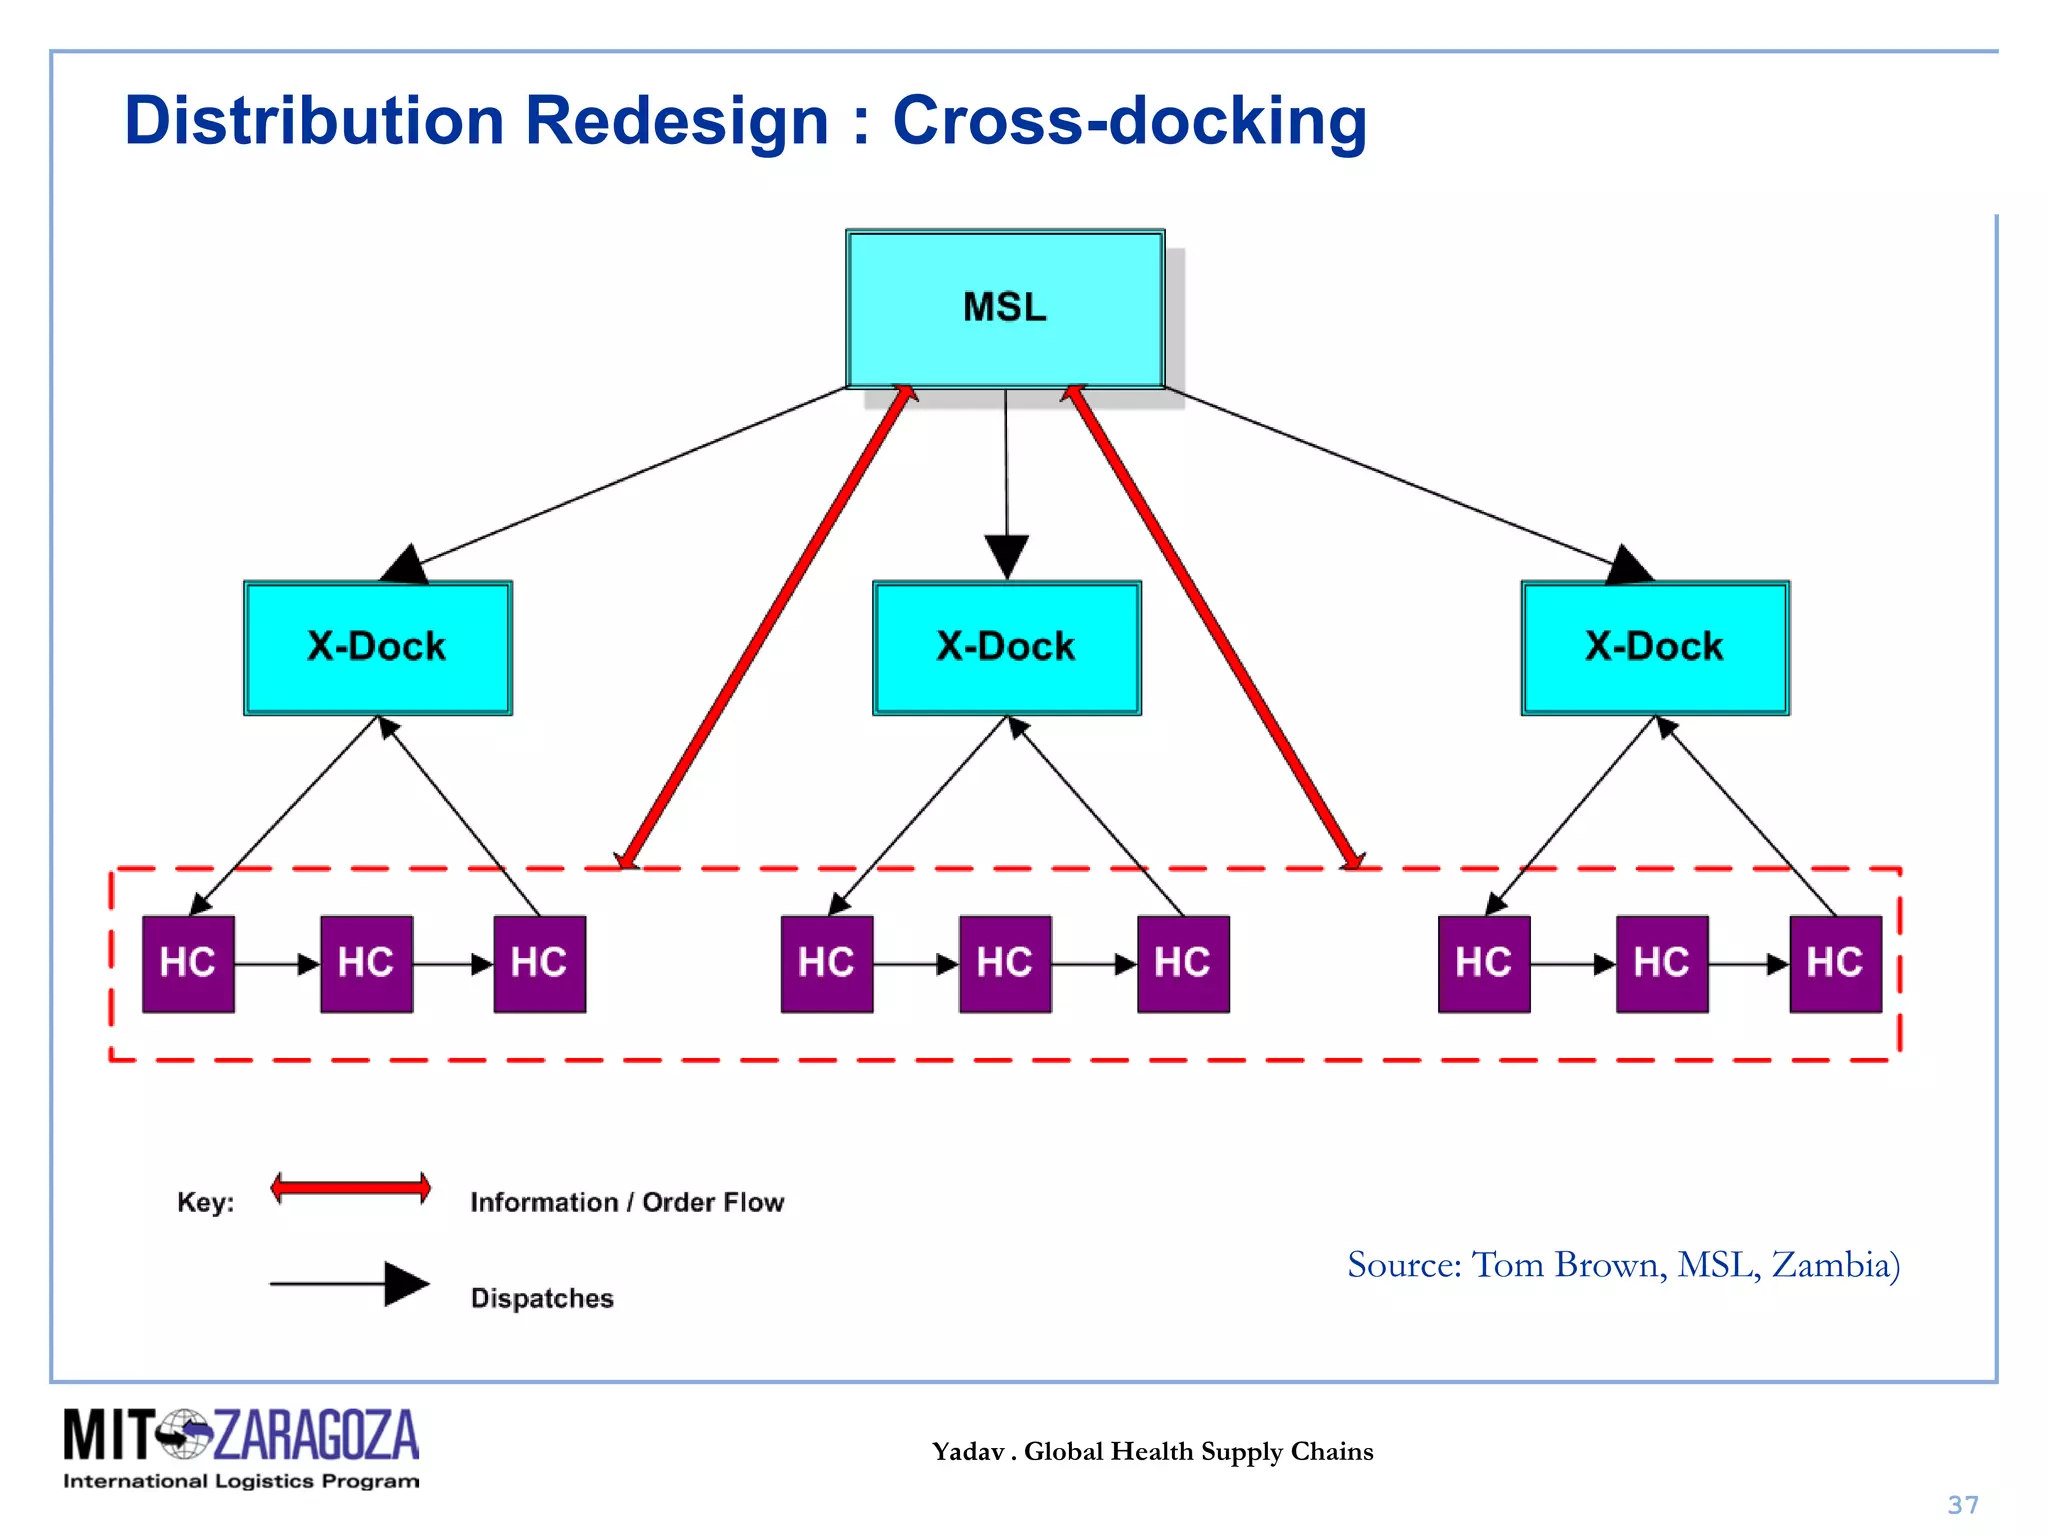
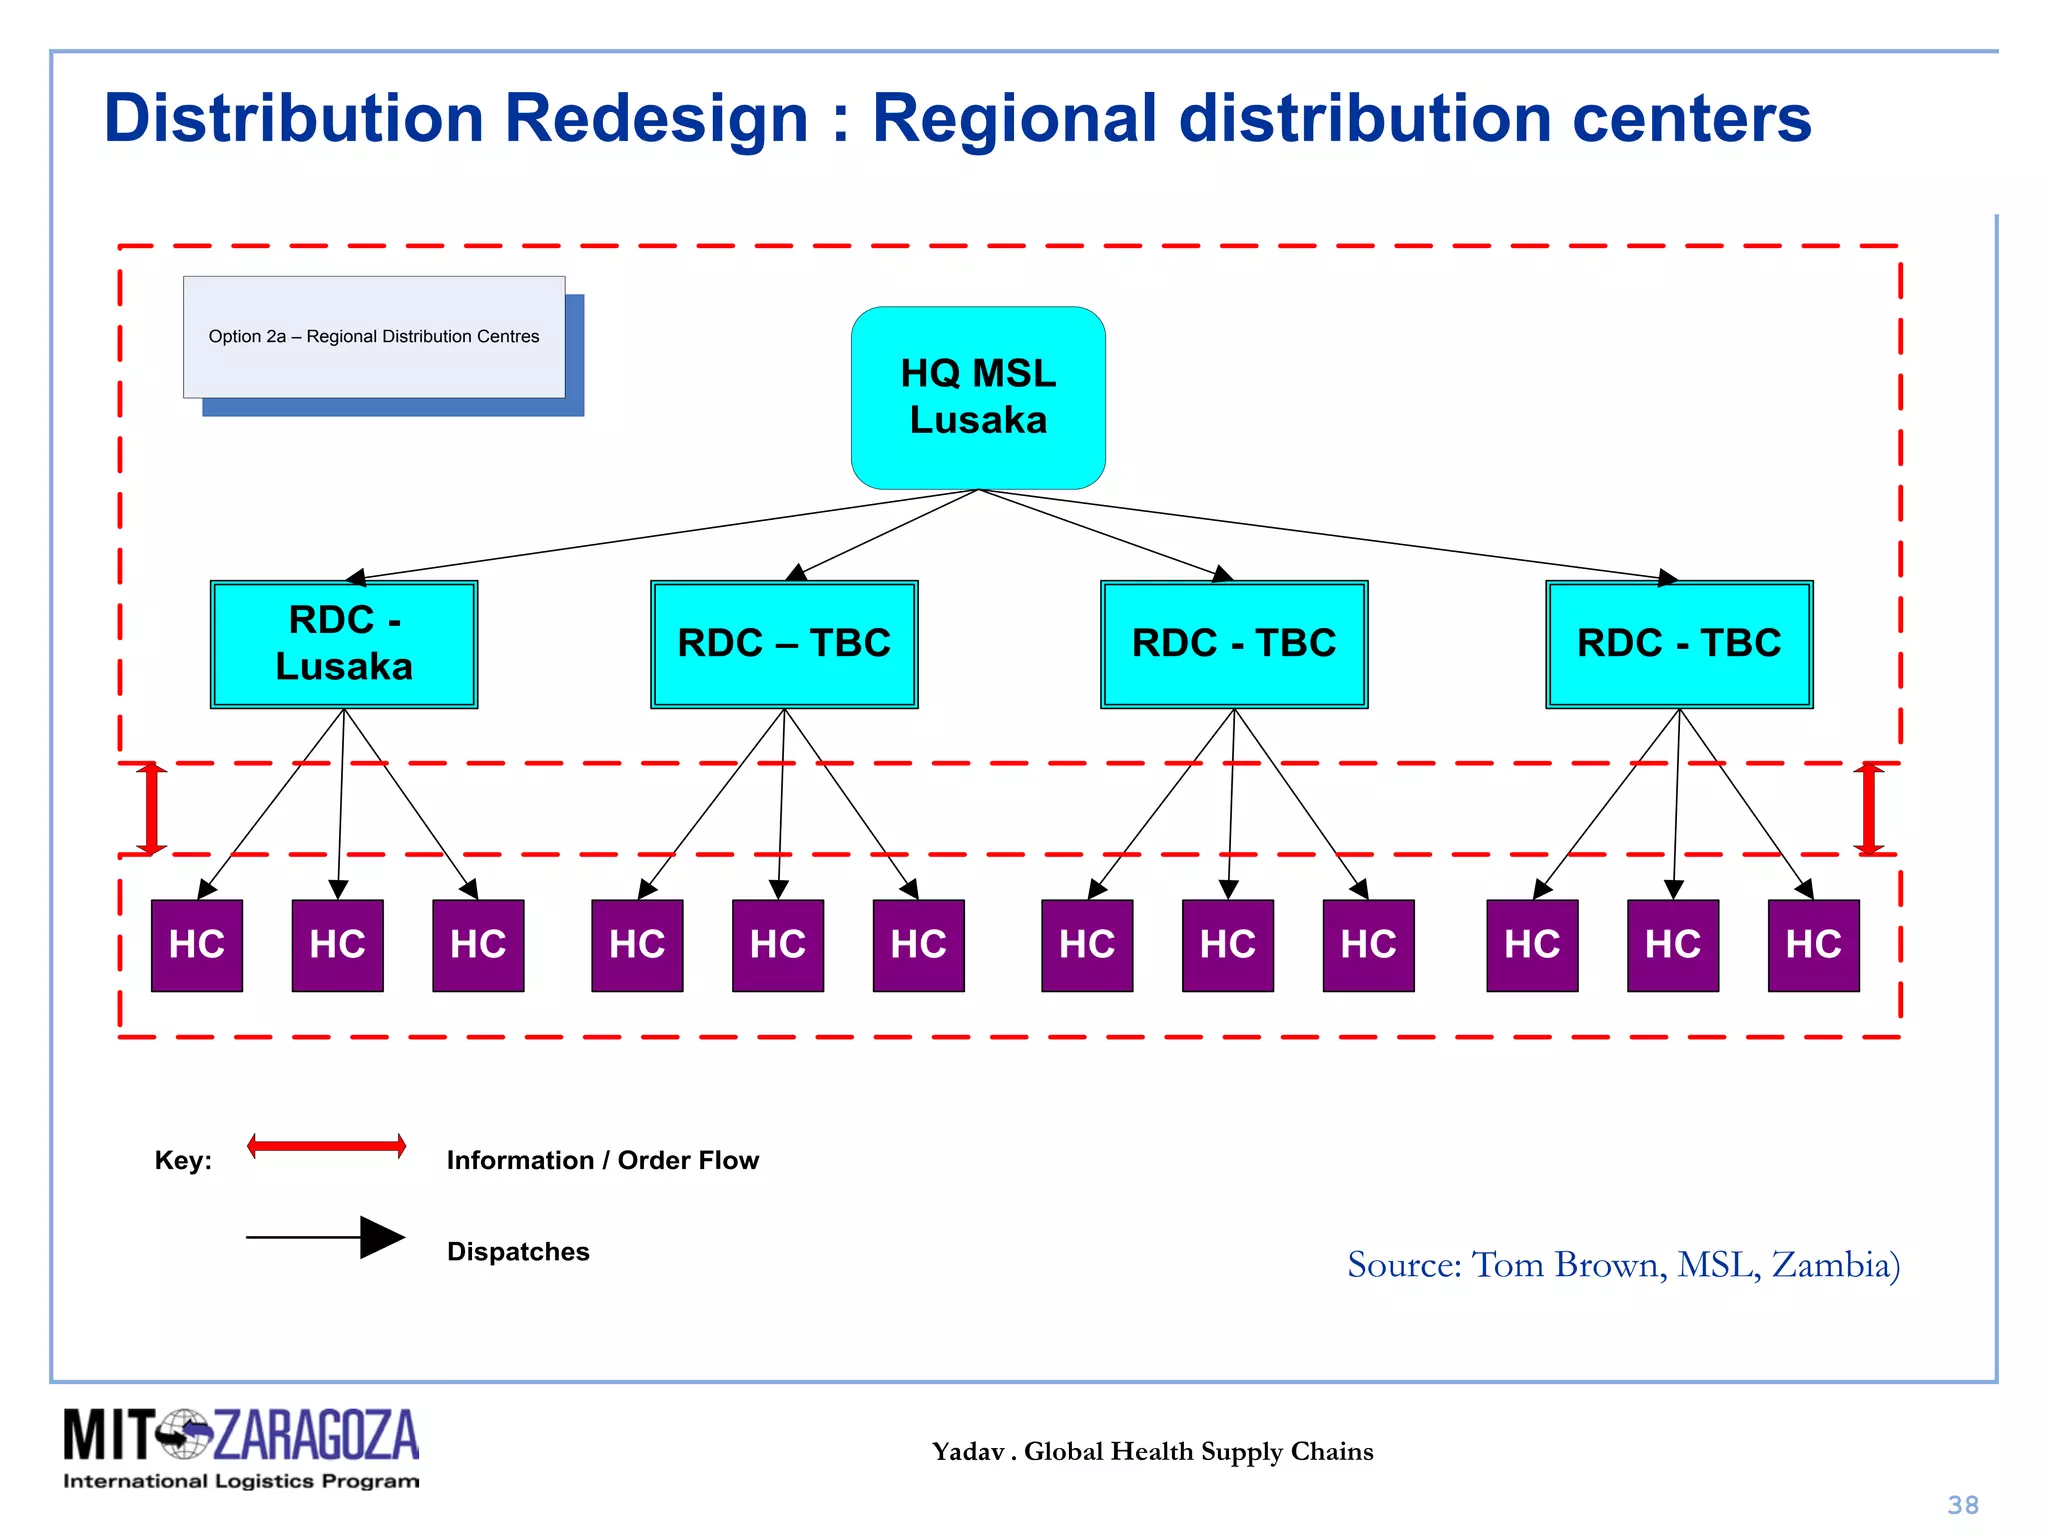
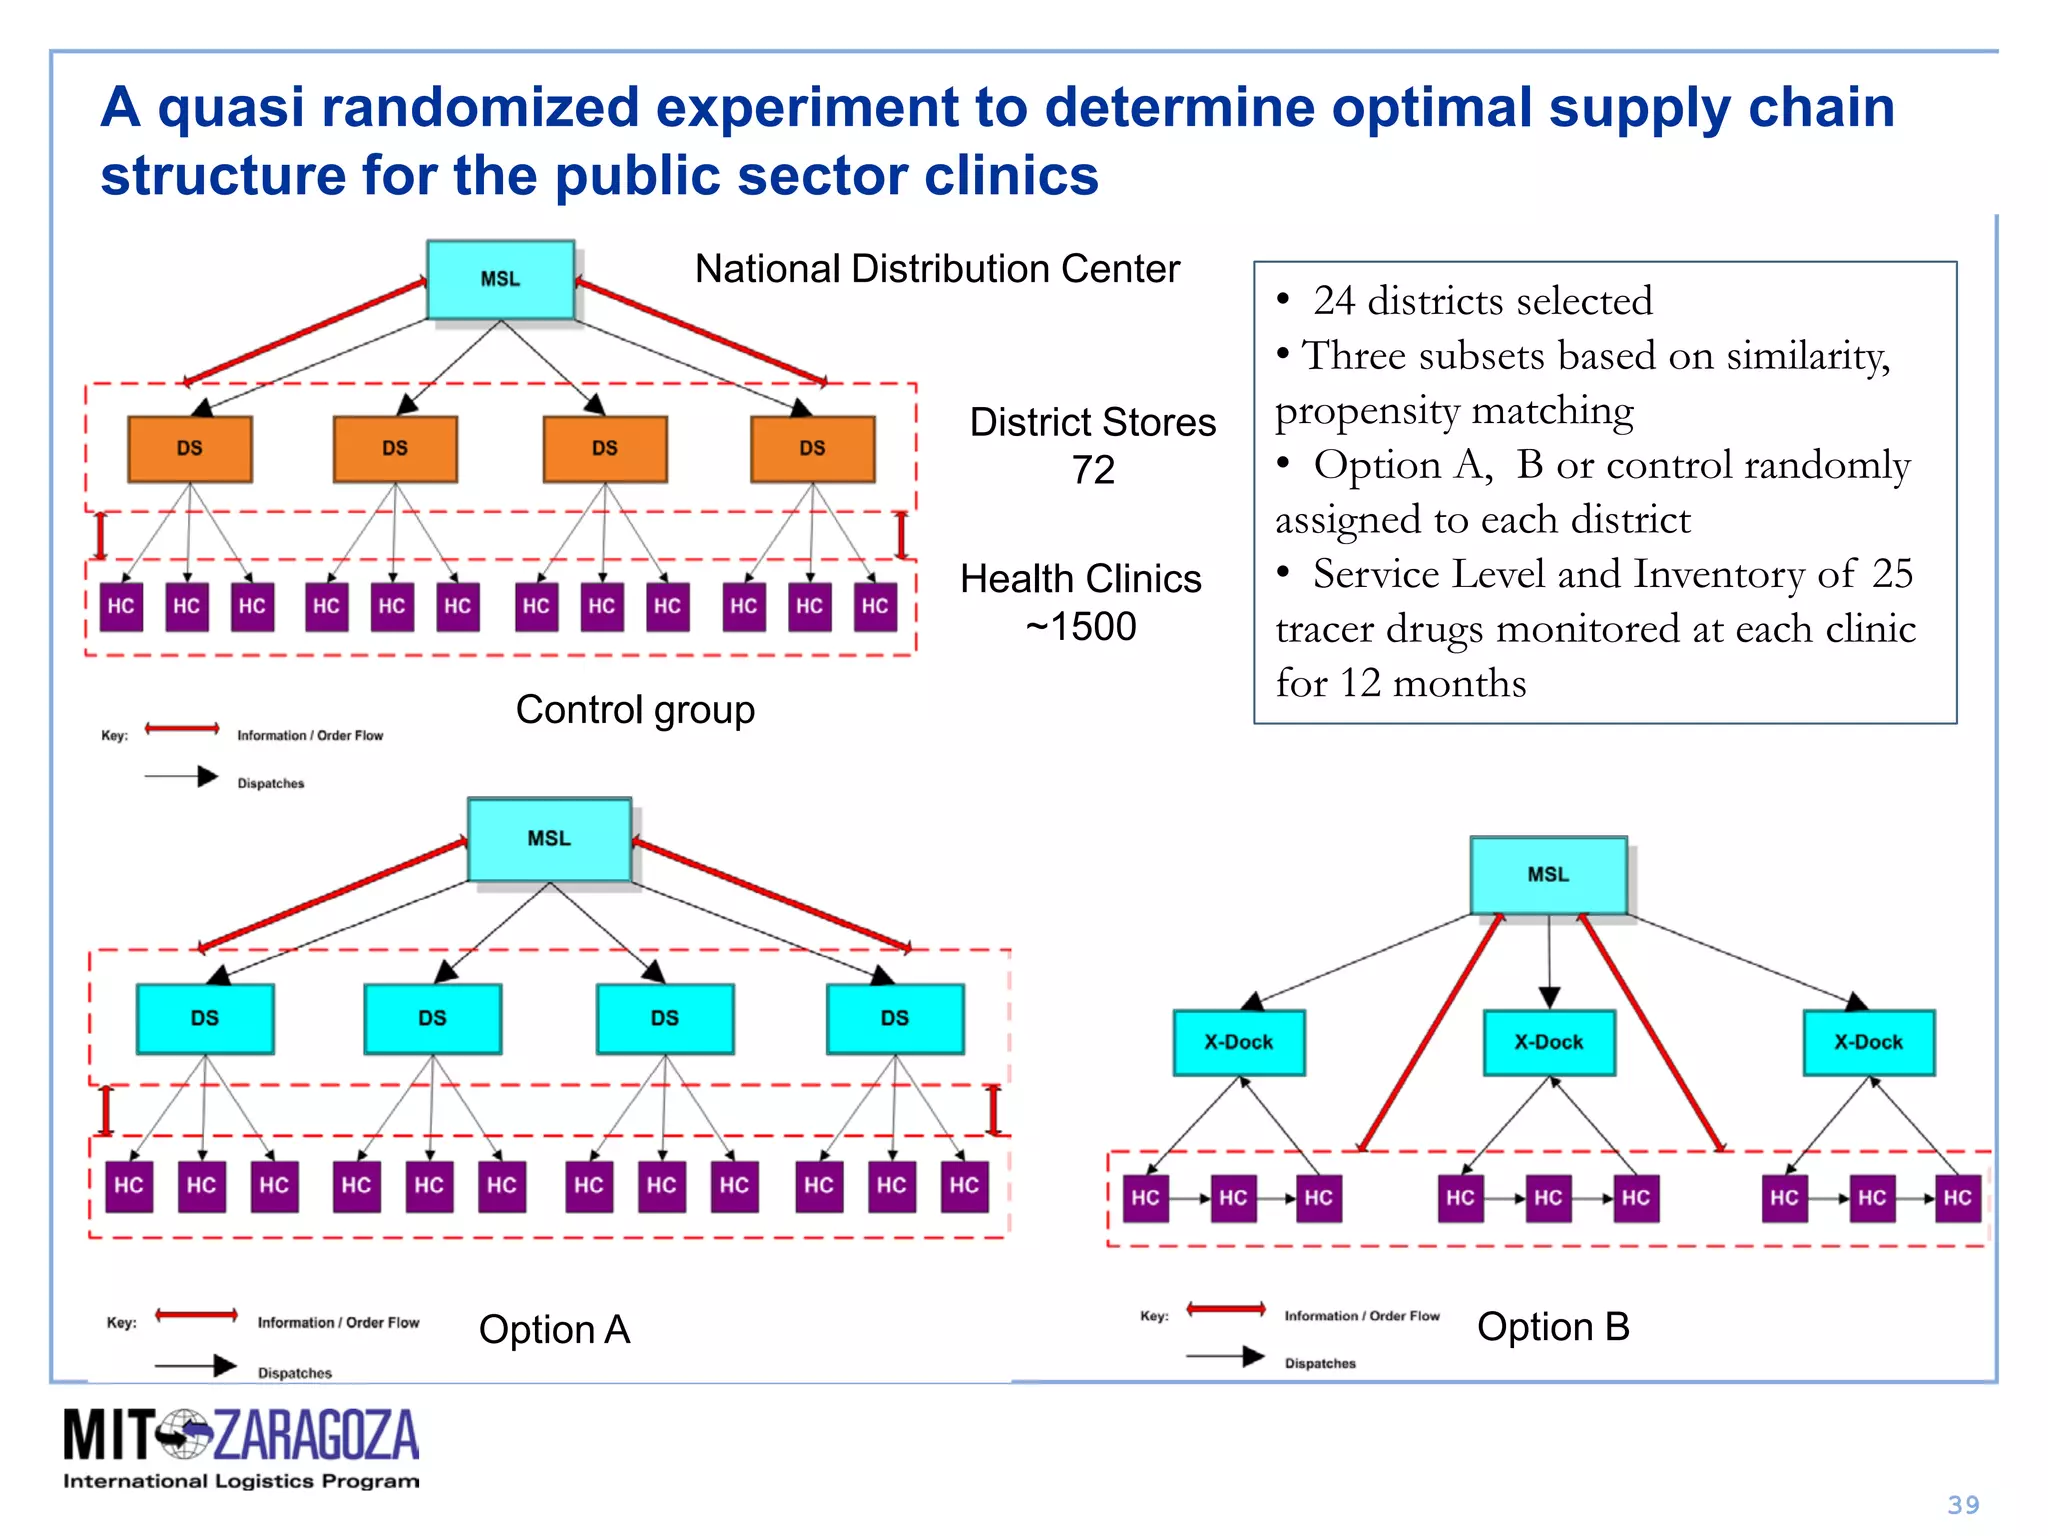
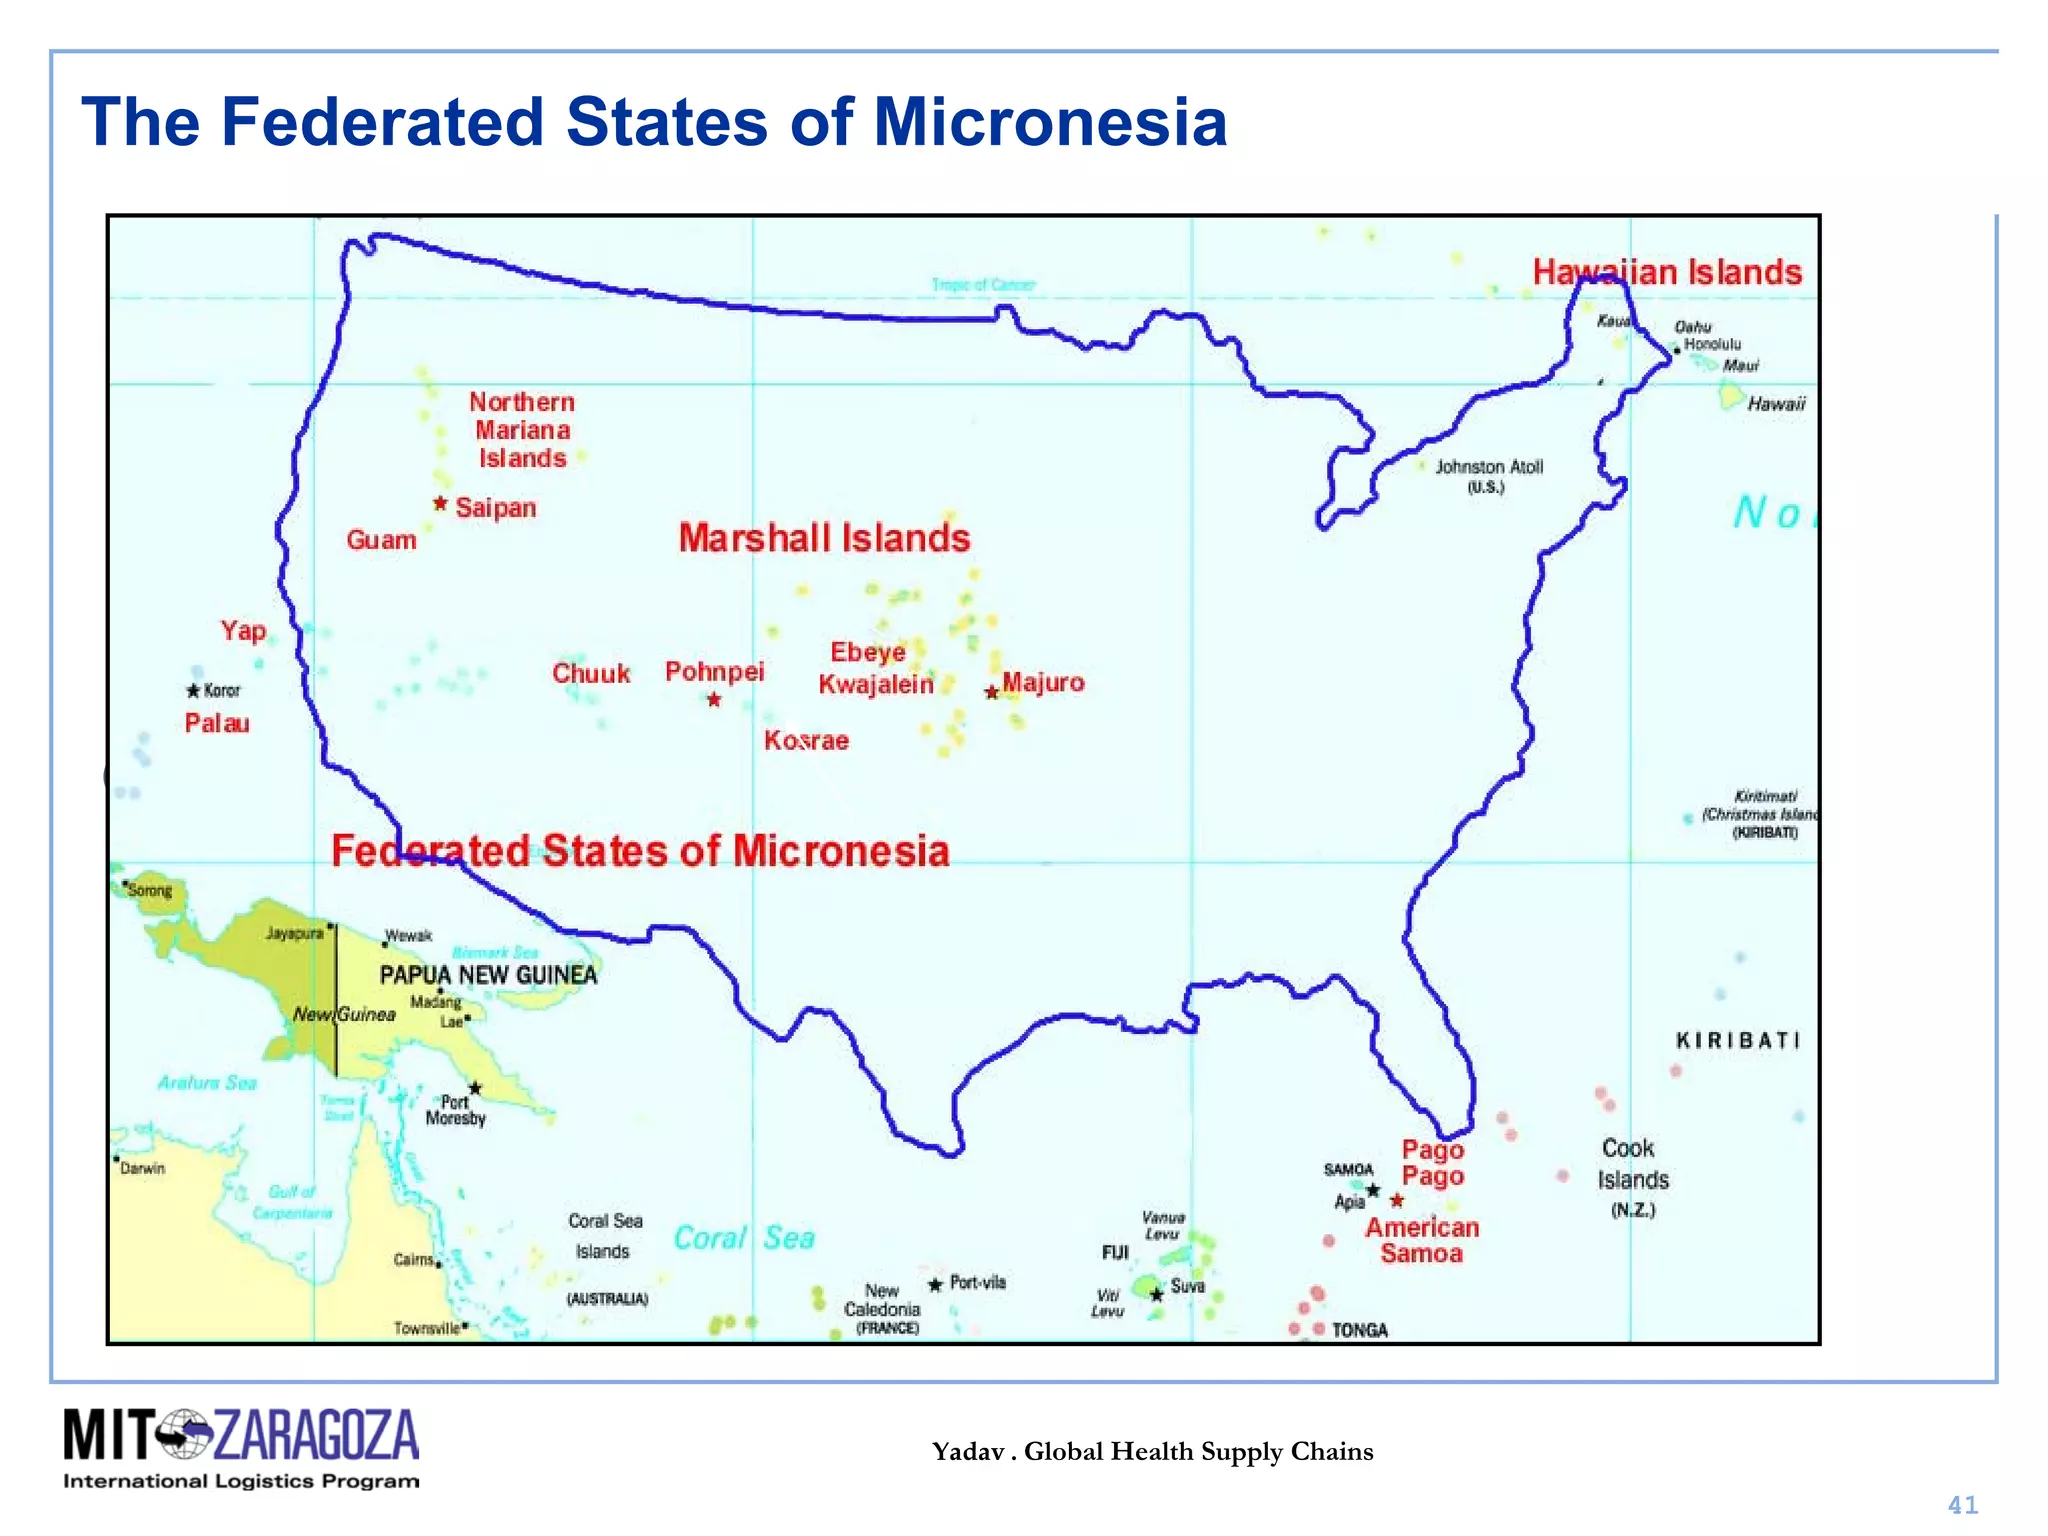
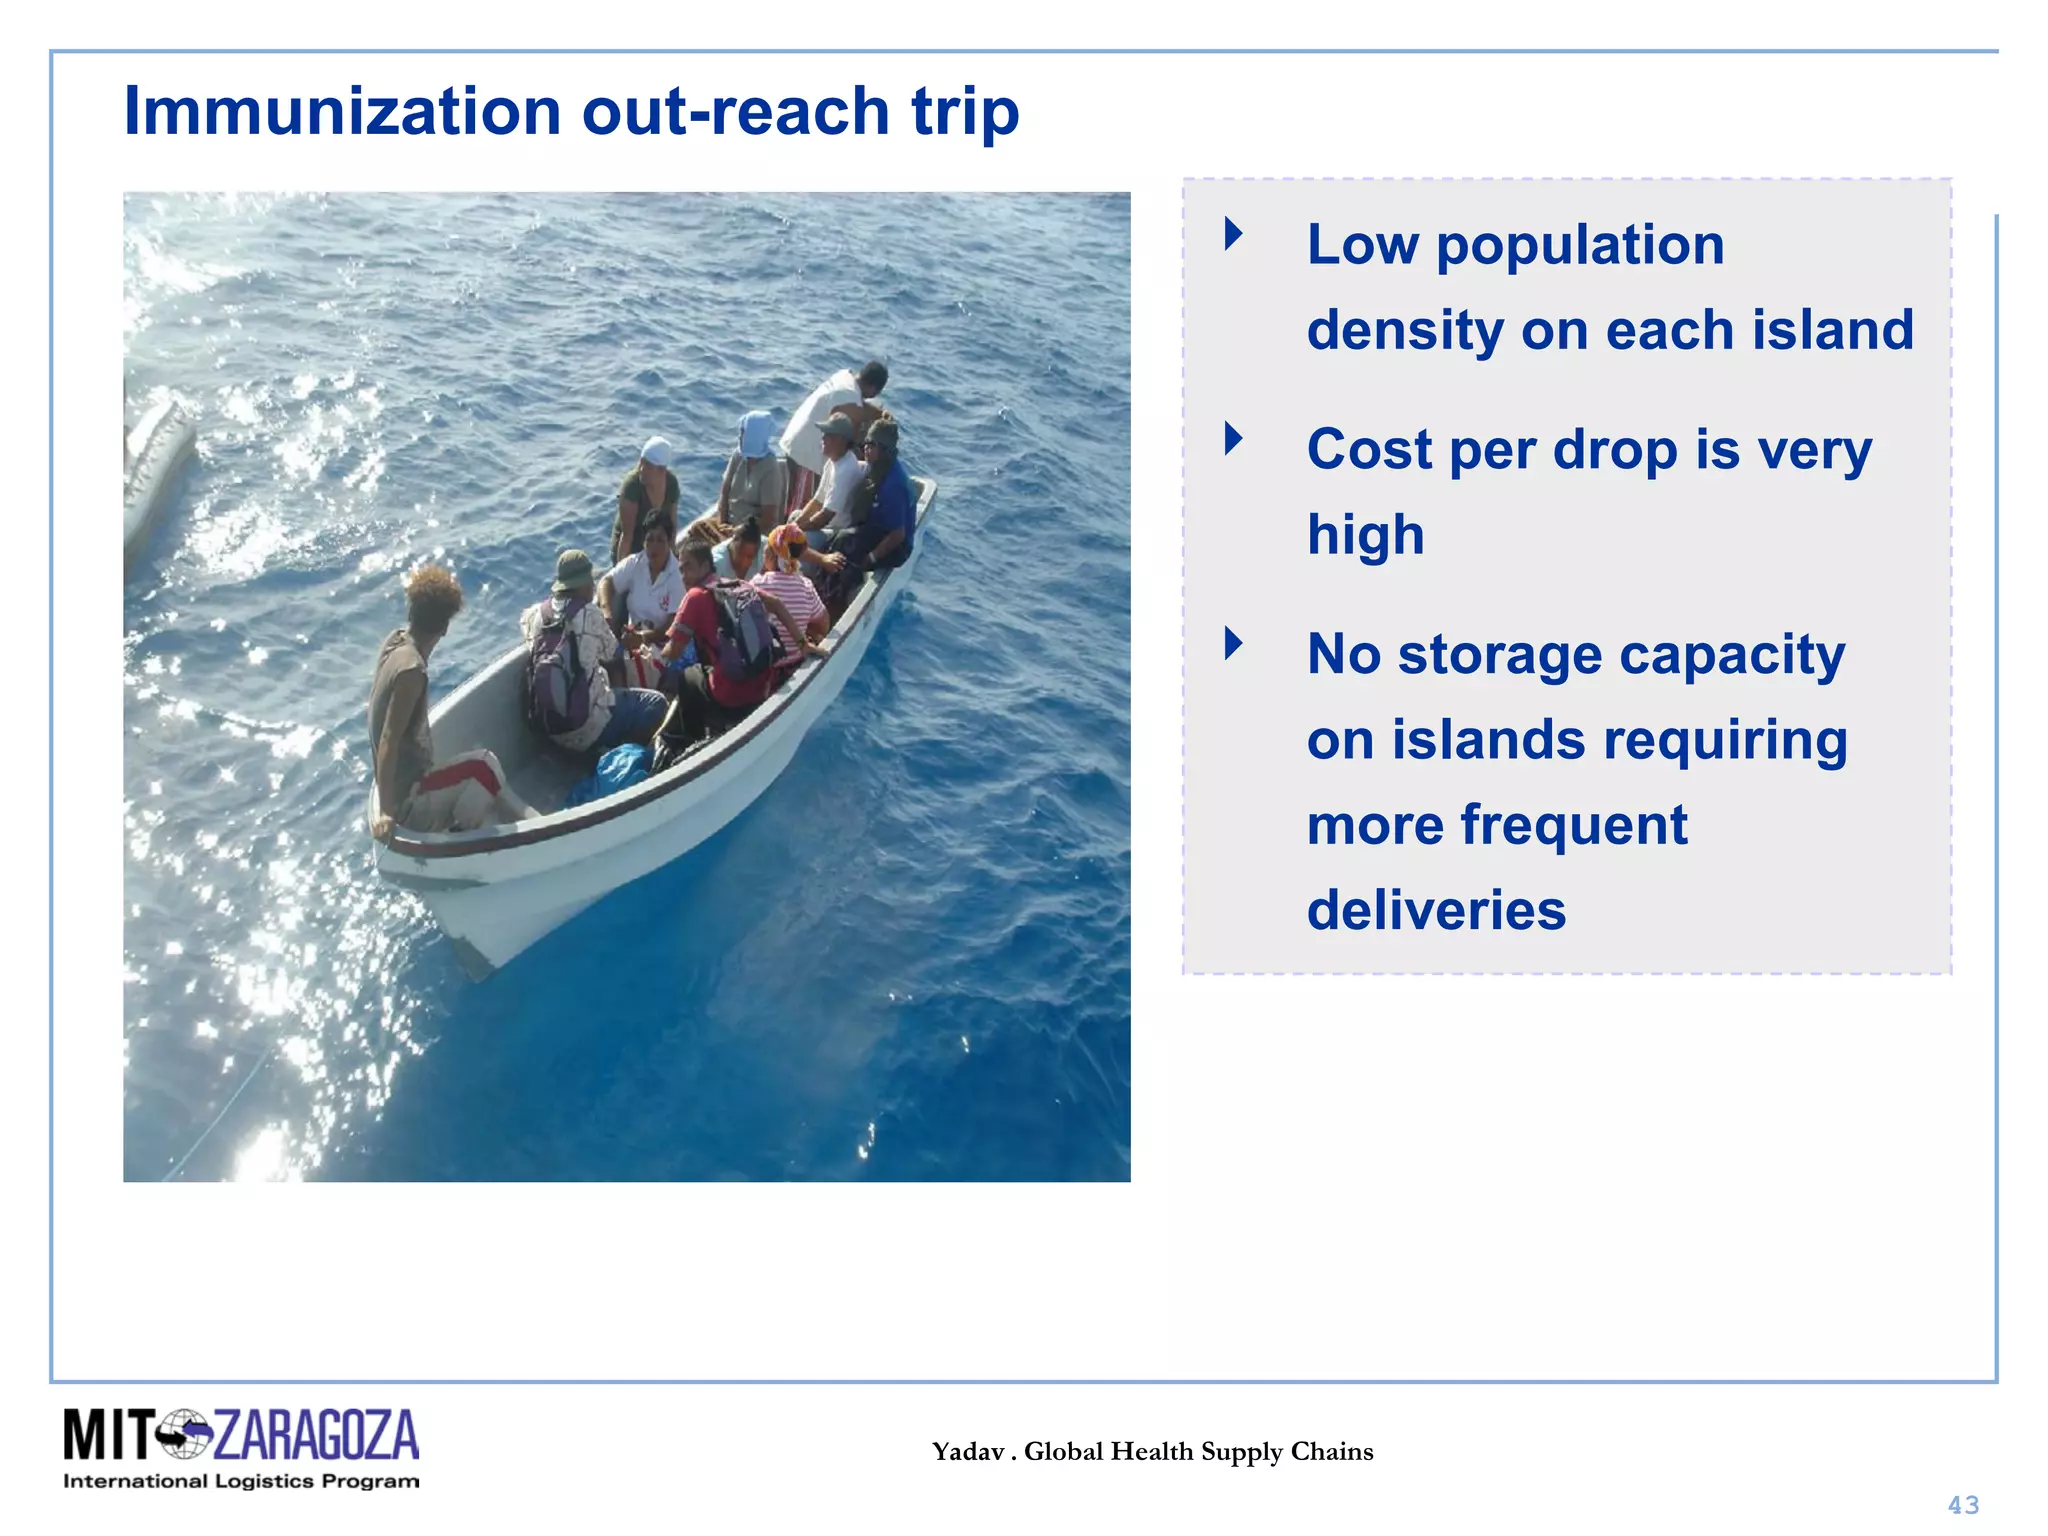
Improving Health in the World and Saving
Lives with More Effective Supply Chains
Sustainability Gala
Netherlands, June 2, 2010
Prashant Yadav
Yadav . Global Health Supply Chains
2
Clinton Foundation HIV/AIDS Initiative
Acknowledgements
Bill and Melinda Gates Foundation
Center for Global Development
UK Department for International Dev.
MIT and MIT-Zaragoza Logistics Program
World Health Organization
Healthcare Redesign Group
Medicines for Malaria Venture
Resources for the Future
Dalberg Global Development Advisors
INSEAD
US Agency for International Development
Government of Zambia
Government of Uganda
Government of Ghana
Government of Kyrgyzstan
Government of South Africa
Government of Tanzania
World Bank
Government of Nigeria
UN Global Fund to fight HIV/AIDS, TB and Malaria
Harvard Medical School
Zaragoza Logistics Center
UNFPA
John Snow Inc.
Yadav . Global Health Supply Chains
3
The supply chain for health and happiness
Health care workers
Drug Supplies
Equipment (Lab+Other)
Facility Infrastructure
Health care
production
process
Patient
Health
care
Clinical
outcome
Health production
process
Environment, Sanitation,
Nutrition
Patient’s ability to willingness
to manage their health
Income and Wealth
Quality of Life
production
process
Goods and services
Health
Quality of
Life
Material Inputs
Goods and
services
production
process
Key focus of
supply chain
innovation
Yadav . Global Health Supply Chains
4
Health: The World is Not Flat
Yadav . Global Health Supply Chains
5
Does increased wealth result in better health?
Yadav . Global Health Supply Chains
6
Unprecedented increases in financing for global health
0
5000
10000
15000
20000
25000
1990 1991 1992 1993 1994 1995 1996 1997 1998 1999 2000 2001 2002 2003 2004 2005 2006 2007
Year
Million$
Australia Austria Belgium
Canada Denmark Finland
France Germany Greece
Ireland Italy Japan
Luxembourg Netherlands New Zealand
Norway Portugal Spain
Sweden Switzerland United Kingdom
United States Bill & Melinda Gates Foundation Corporate Donations
Debt Repayments (IBRD) Other
Yadav . Global Health Supply Chains
7
End patients
Drug
Manufacturers
Private
Channel
Buyers
Public
Channel
Buyers
NGO
Channel
Buyers
NGOs
International
Financing
Public
Sector
Private
Sector
International financing flows for health products (1)
Slide template borrowed from
Dalberg Global Development
Advisors- AMFm RBM Task Force
Presentation
Yadav . Global Health Supply Chains
8
End patients
Drug
Manufacturers
Private
Channel
Buyers
Public
Channel
Buyers
NGO
Channel
Buyers
NGOs
International
Financing
Public
Sector
Private
Sector
Slide template borrowed from
Dalberg Global Development
Advisors- AMFm RBM Task Force
Presentation
International financing flows for health products (2)
Yadav . Global Health Supply Chains
9
Most diseases are treatable with existing medicines
Yadav . Global Health Supply Chains
10
Many of these medicines are however not available
Average availability was only 34.9% in the public sector and 63.2% in the private sector
Source: WHO, Health Action International, United Nations MDG8 Report
Yadav . Global Health Supply Chains
Why do people seek treatment in the private sector?
Travel distances are large to reach public facilities
Yadav . Global Health Supply Chains
Waiting lines are long at public facilities
Yadav . Global Health Supply Chains
Drug availability is low at public facilities
Yadav . Global Health Supply Chains
14
Private sector supply chains for medicines
Yadav . Global Health Supply Chains
15
Points of access for medicines in the private sector
Yadav . Global Health Supply Chains
16
Points of access for medicines in the private sector
Yadav . Global Health Supply Chains
17
Points of access for medicines in the private sector
Yadav . Global Health Supply Chains
18
18
Points of access for medicines in the private sector
Non fixed structure retail store
Fixed structure retail storeDrug storeLicensed pharmacy
Drug hawker
Source: MMV
Structurally different supply chains serve each of these end retail points
Yadav . Global Health Supply Chains
19
Source: Joint study with CHAI and UNZA in Zambia
Yadav . Global Health Supply Chains
20
Source: Joint study with CHAI and UNZA in Zambia
Yadav . Global Health Supply Chains
21
Source: Joint study with CHAI and UNZA in Zambia
Yadav . Global Health Supply Chains
22
-
2,000
4,000
6,000
8,000
10,000
12,000
- 1 2 3 4 5 6
Pricechargedforafullcourseofantimalarialin
ZambianKwacha
Competition Index= # of sources for anti-malarials in 1 km radius
How retail competition impacts price
P value = 0.0854
Study of over 100 outlets in 4 districts in Zambia
Yadav . Global Health Supply Chains
23
CR-n ratios and Herfindahl index for wholesalers in Uganda
Ratio
CR-1 27.7%
CR-2 43.3%
CR-3 55.8%
CR-4 63.8%
CR-5 71.8%
CR-6 77.6%
CR-7 83.3%
CR-8 87.2%
CR-9 90.5%
CR-10 92.3%
Under-5 Adult Total
HHI 4398 1323 1398
Usually a market with HHI less than 1,000 is
considered to be a competitive marketplace
1,000-1,800 to be a moderately concentrated
marketplace
1,800 or greater to be a highly concentrated
marketplace
Yadav . Global Health Supply Chains
24
Piggy-backing on other supply chains
Yadav . Global Health Supply Chains
25
Public sector supply chains for medicines
Yadav . Global Health Supply Chains
26
Public health clinics remain stocked out
Yadav . Global Health Supply Chains
27
Rudimentary order and stock management
Yadav . Global Health Supply Chains
28
Drivers of poor availability at health facility level
Suppliers Ministry of
Health
Distribution
Financiers
Clinics
Uncertainties in
timing of grant
disbursement
Long lead times
(up to 36 weeks)
Delays in
procurement due to
archaic procurement
processes and poor
quantification and
planning
Weak distribution
infrastructure and
skeletal MIS
No capacity to
manage inventory or
consumption tracking
Typical structure. May not hold for all countries and programs
Poor bargaining
power and price
transparency
Yadav . Global Health Supply Chains
29
Supply Chain Redesign Options
Yadav . Global Health Supply Chains
30
Creative Bridge Financing Solutions
Pledge Guarantee (PG)
mechanism
Donor
Country
Manufacturers1
Donor makes pledge
2
Country request
mechanism to cover
product cost
3
PG verifies pledge with
donor and establishes
MOU
4 Country procures through
existing process
5
Mechanism pays
manufacturer or
procurement agent
6Manufacturer ships product
to country
7
Donor pays the
mechanism
(1) Could also be accessed by NGO or UNFPA
Source: Existing McKinsey and JSI Deliver analysis; Dalberg analysis
Source: Work with Dalberg Global
Development Advisor for RHSC
Yadav . Global Health Supply Chains
Forecast Driven
Drug Substance
Manufacturing
Current Push-Pull Boundary in Global Health Supply Chains
Co-formulating and
Packaging
Pre-delivery
Inspection
Shipping and
Transport
Drug Substance
Inventory
Final Product
Inventory
Order Driven
Inventory /Order Interface
Source : Yadav, Sekhri and Curtis (2006)
Yadav . Global Health Supply Chains
32
Risk Sharing shifts the Push-Pull Boundary
Source: Existing McKinsey and JSI Deliver analysis; Dalberg analysis
Minimum Volume
Guarantee Institution
Country ManufacturersDonor
1
Donors and countries estimate
annual purchasing volume for
specified products
2
MVG decides on volume of
product and amount of
risk to assume
Establishes master contracts
with manufacturer based on
volume / risk tolerance
3
Countries and/or donors each
place individual orders under
master contract
4
Manufacturer ships
products directly to
countries
5
Manufacturer
informs MVG of
unused volume
Secondary
Markets?
6
Sale or storage of
unused product;
potentially waste
Joint work with Dalberg Global Development Advisors
Yadav . Global Health Supply Chains
Forecast Driven
Drug Substance
Manufacturing
Shifted Push-Pull Boundary in Global Health Supply Chains
Co-formulating and
Packaging
Pre-delivery
Inspection
Shipping and
Transport
Drug Substance
Inventory
Final Product
Inventory
Order Driven
Inventory /Order Interface
Source : Yadav, Sekhri and Curtis (2006)
Yadav . Global Health Supply Chains
34
Regional Health Commodity Supply Hubs
Source : Yadav, Sekhri and Curtis (2006)
Reduced lead-time
Reduced stock-outs
Reduced logistics cost
Yadav . Global Health Supply Chains
35
Regional Health Commodity Supply Hubs
Source: Partnership for Supply Chain Management
Yadav . Global Health Supply Chains
36
National
Distribution Center
(1)
District
Stores
72
Health
Centers
~1450
Source: Tom Brown, MSL, Zambia)
Current distribution structure in Zambia
Yadav . Global Health Supply Chains
37
Distribution Redesign : Cross-docking
Source: Tom Brown, MSL, Zambia)
Yadav . Global Health Supply Chains
38
Distribution Redesign : Regional distribution centers
HC HC HC HC HC HC HC HC HC HC HC HC
RDC -
Lusaka
RDC – TBC RDC - TBC RDC - TBC
Key: Information / Order Flow
Dispatches
HQ MSL
Lusaka
Option 2a – Regional Distribution Centres
Source: Tom Brown, MSL, Zambia)
Yadav . Global Health Supply Chains
39
A quasi randomized experiment to determine optimal supply chain
structure for the public sector clinics
National Distribution Center
District Stores
72
Health Clinics
~1500
Option BOption A
• 24 districts selected
• Three subsets based on similarity,
propensity matching
• Option A, B or control randomly
assigned to each district
• Service Level and Inventory of 25
tracer drugs monitored at each clinic
for 12 months
Control group
Yadav . Global Health Supply Chains
40
The CSCMP Global Health
Distribution System Challenge
Courtesy: Blair Sachs Hanewall, Bill and Melinda Gates Foundation
Yadav . Global Health Supply Chains
41
The Federated States of Micronesia
Yadav . Global Health Supply Chains
42
Immunization program staff at work
Yadav . Global Health Supply Chains
43
Immunization out-reach trip
 Low population
density on each island
 Cost per drop is very
high
 No storage capacity
on islands requiring
more frequent
deliveries
Yadav . Global Health Supply Chains
44
Summary

Improving Health in the World and Saving Lives with More Effective Supply Chains

  • 1.
    Improving Health inthe World and Saving Lives with More Effective Supply Chains Sustainability Gala Netherlands, June 2, 2010 Prashant Yadav
  • 2.
    Yadav . GlobalHealth Supply Chains 2 Clinton Foundation HIV/AIDS Initiative Acknowledgements Bill and Melinda Gates Foundation Center for Global Development UK Department for International Dev. MIT and MIT-Zaragoza Logistics Program World Health Organization Healthcare Redesign Group Medicines for Malaria Venture Resources for the Future Dalberg Global Development Advisors INSEAD US Agency for International Development Government of Zambia Government of Uganda Government of Ghana Government of Kyrgyzstan Government of South Africa Government of Tanzania World Bank Government of Nigeria UN Global Fund to fight HIV/AIDS, TB and Malaria Harvard Medical School Zaragoza Logistics Center UNFPA John Snow Inc.
  • 3.
    Yadav . GlobalHealth Supply Chains 3 The supply chain for health and happiness Health care workers Drug Supplies Equipment (Lab+Other) Facility Infrastructure Health care production process Patient Health care Clinical outcome Health production process Environment, Sanitation, Nutrition Patient’s ability to willingness to manage their health Income and Wealth Quality of Life production process Goods and services Health Quality of Life Material Inputs Goods and services production process Key focus of supply chain innovation
  • 4.
    Yadav . GlobalHealth Supply Chains 4 Health: The World is Not Flat
  • 5.
    Yadav . GlobalHealth Supply Chains 5 Does increased wealth result in better health?
  • 6.
    Yadav . GlobalHealth Supply Chains 6 Unprecedented increases in financing for global health 0 5000 10000 15000 20000 25000 1990 1991 1992 1993 1994 1995 1996 1997 1998 1999 2000 2001 2002 2003 2004 2005 2006 2007 Year Million$ Australia Austria Belgium Canada Denmark Finland France Germany Greece Ireland Italy Japan Luxembourg Netherlands New Zealand Norway Portugal Spain Sweden Switzerland United Kingdom United States Bill & Melinda Gates Foundation Corporate Donations Debt Repayments (IBRD) Other
  • 7.
    Yadav . GlobalHealth Supply Chains 7 End patients Drug Manufacturers Private Channel Buyers Public Channel Buyers NGO Channel Buyers NGOs International Financing Public Sector Private Sector International financing flows for health products (1) Slide template borrowed from Dalberg Global Development Advisors- AMFm RBM Task Force Presentation
  • 8.
    Yadav . GlobalHealth Supply Chains 8 End patients Drug Manufacturers Private Channel Buyers Public Channel Buyers NGO Channel Buyers NGOs International Financing Public Sector Private Sector Slide template borrowed from Dalberg Global Development Advisors- AMFm RBM Task Force Presentation International financing flows for health products (2)
  • 9.
    Yadav . GlobalHealth Supply Chains 9 Most diseases are treatable with existing medicines
  • 10.
    Yadav . GlobalHealth Supply Chains 10 Many of these medicines are however not available Average availability was only 34.9% in the public sector and 63.2% in the private sector Source: WHO, Health Action International, United Nations MDG8 Report
  • 11.
    Yadav . GlobalHealth Supply Chains Why do people seek treatment in the private sector? Travel distances are large to reach public facilities
  • 12.
    Yadav . GlobalHealth Supply Chains Waiting lines are long at public facilities
  • 13.
    Yadav . GlobalHealth Supply Chains Drug availability is low at public facilities
  • 14.
    Yadav . GlobalHealth Supply Chains 14 Private sector supply chains for medicines
  • 15.
    Yadav . GlobalHealth Supply Chains 15 Points of access for medicines in the private sector
  • 16.
    Yadav . GlobalHealth Supply Chains 16 Points of access for medicines in the private sector
  • 17.
    Yadav . GlobalHealth Supply Chains 17 Points of access for medicines in the private sector
  • 18.
    Yadav . GlobalHealth Supply Chains 18 18 Points of access for medicines in the private sector Non fixed structure retail store Fixed structure retail storeDrug storeLicensed pharmacy Drug hawker Source: MMV Structurally different supply chains serve each of these end retail points
  • 19.
    Yadav . GlobalHealth Supply Chains 19 Source: Joint study with CHAI and UNZA in Zambia
  • 20.
    Yadav . GlobalHealth Supply Chains 20 Source: Joint study with CHAI and UNZA in Zambia
  • 21.
    Yadav . GlobalHealth Supply Chains 21 Source: Joint study with CHAI and UNZA in Zambia
  • 22.
    Yadav . GlobalHealth Supply Chains 22 - 2,000 4,000 6,000 8,000 10,000 12,000 - 1 2 3 4 5 6 Pricechargedforafullcourseofantimalarialin ZambianKwacha Competition Index= # of sources for anti-malarials in 1 km radius How retail competition impacts price P value = 0.0854 Study of over 100 outlets in 4 districts in Zambia
  • 23.
    Yadav . GlobalHealth Supply Chains 23 CR-n ratios and Herfindahl index for wholesalers in Uganda Ratio CR-1 27.7% CR-2 43.3% CR-3 55.8% CR-4 63.8% CR-5 71.8% CR-6 77.6% CR-7 83.3% CR-8 87.2% CR-9 90.5% CR-10 92.3% Under-5 Adult Total HHI 4398 1323 1398 Usually a market with HHI less than 1,000 is considered to be a competitive marketplace 1,000-1,800 to be a moderately concentrated marketplace 1,800 or greater to be a highly concentrated marketplace
  • 24.
    Yadav . GlobalHealth Supply Chains 24 Piggy-backing on other supply chains
  • 25.
    Yadav . GlobalHealth Supply Chains 25 Public sector supply chains for medicines
  • 26.
    Yadav . GlobalHealth Supply Chains 26 Public health clinics remain stocked out
  • 27.
    Yadav . GlobalHealth Supply Chains 27 Rudimentary order and stock management
  • 28.
    Yadav . GlobalHealth Supply Chains 28 Drivers of poor availability at health facility level Suppliers Ministry of Health Distribution Financiers Clinics Uncertainties in timing of grant disbursement Long lead times (up to 36 weeks) Delays in procurement due to archaic procurement processes and poor quantification and planning Weak distribution infrastructure and skeletal MIS No capacity to manage inventory or consumption tracking Typical structure. May not hold for all countries and programs Poor bargaining power and price transparency
  • 29.
    Yadav . GlobalHealth Supply Chains 29 Supply Chain Redesign Options
  • 30.
    Yadav . GlobalHealth Supply Chains 30 Creative Bridge Financing Solutions Pledge Guarantee (PG) mechanism Donor Country Manufacturers1 Donor makes pledge 2 Country request mechanism to cover product cost 3 PG verifies pledge with donor and establishes MOU 4 Country procures through existing process 5 Mechanism pays manufacturer or procurement agent 6Manufacturer ships product to country 7 Donor pays the mechanism (1) Could also be accessed by NGO or UNFPA Source: Existing McKinsey and JSI Deliver analysis; Dalberg analysis Source: Work with Dalberg Global Development Advisor for RHSC
  • 31.
    Yadav . GlobalHealth Supply Chains Forecast Driven Drug Substance Manufacturing Current Push-Pull Boundary in Global Health Supply Chains Co-formulating and Packaging Pre-delivery Inspection Shipping and Transport Drug Substance Inventory Final Product Inventory Order Driven Inventory /Order Interface Source : Yadav, Sekhri and Curtis (2006)
  • 32.
    Yadav . GlobalHealth Supply Chains 32 Risk Sharing shifts the Push-Pull Boundary Source: Existing McKinsey and JSI Deliver analysis; Dalberg analysis Minimum Volume Guarantee Institution Country ManufacturersDonor 1 Donors and countries estimate annual purchasing volume for specified products 2 MVG decides on volume of product and amount of risk to assume Establishes master contracts with manufacturer based on volume / risk tolerance 3 Countries and/or donors each place individual orders under master contract 4 Manufacturer ships products directly to countries 5 Manufacturer informs MVG of unused volume Secondary Markets? 6 Sale or storage of unused product; potentially waste Joint work with Dalberg Global Development Advisors
  • 33.
    Yadav . GlobalHealth Supply Chains Forecast Driven Drug Substance Manufacturing Shifted Push-Pull Boundary in Global Health Supply Chains Co-formulating and Packaging Pre-delivery Inspection Shipping and Transport Drug Substance Inventory Final Product Inventory Order Driven Inventory /Order Interface Source : Yadav, Sekhri and Curtis (2006)
  • 34.
    Yadav . GlobalHealth Supply Chains 34 Regional Health Commodity Supply Hubs Source : Yadav, Sekhri and Curtis (2006) Reduced lead-time Reduced stock-outs Reduced logistics cost
  • 35.
    Yadav . GlobalHealth Supply Chains 35 Regional Health Commodity Supply Hubs Source: Partnership for Supply Chain Management
  • 36.
    Yadav . GlobalHealth Supply Chains 36 National Distribution Center (1) District Stores 72 Health Centers ~1450 Source: Tom Brown, MSL, Zambia) Current distribution structure in Zambia
  • 37.
    Yadav . GlobalHealth Supply Chains 37 Distribution Redesign : Cross-docking Source: Tom Brown, MSL, Zambia)
  • 38.
    Yadav . GlobalHealth Supply Chains 38 Distribution Redesign : Regional distribution centers HC HC HC HC HC HC HC HC HC HC HC HC RDC - Lusaka RDC – TBC RDC - TBC RDC - TBC Key: Information / Order Flow Dispatches HQ MSL Lusaka Option 2a – Regional Distribution Centres Source: Tom Brown, MSL, Zambia)
  • 39.
    Yadav . GlobalHealth Supply Chains 39 A quasi randomized experiment to determine optimal supply chain structure for the public sector clinics National Distribution Center District Stores 72 Health Clinics ~1500 Option BOption A • 24 districts selected • Three subsets based on similarity, propensity matching • Option A, B or control randomly assigned to each district • Service Level and Inventory of 25 tracer drugs monitored at each clinic for 12 months Control group
  • 40.
    Yadav . GlobalHealth Supply Chains 40 The CSCMP Global Health Distribution System Challenge Courtesy: Blair Sachs Hanewall, Bill and Melinda Gates Foundation
  • 41.
    Yadav . GlobalHealth Supply Chains 41 The Federated States of Micronesia
  • 42.
    Yadav . GlobalHealth Supply Chains 42 Immunization program staff at work
  • 43.
    Yadav . GlobalHealth Supply Chains 43 Immunization out-reach trip  Low population density on each island  Cost per drop is very high  No storage capacity on islands requiring more frequent deliveries
  • 44.
    Yadav . GlobalHealth Supply Chains 44 Summary