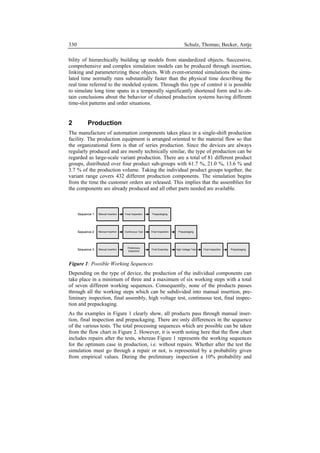
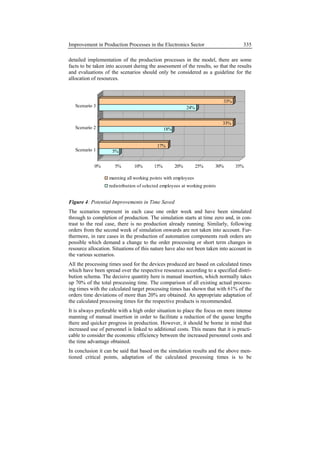
SlideShare a Scribd company logo
1 of 8
Download to read offline
Advances in Simulation for
Production and Logistics Applications
Markus Rabe (ed.)
Stuttgart, Fraunhofer IRB Verlag 2008


        Improvement in Production Processes in a
         Company in the Electronics Sector using
                       Simulation
     Verbesserung der Fertigungsabläufe in einem Unternehmen der
              Elektronikbranche mit Hilfe der Simulation


                             Thomas Schulz, Antje Becker,
                      Rockwell Automation GmbH, Haan (Germany)


Abstract: This paper deals with improvements in production runs in the manufac-
ture of electronic components for application in automatic control engineering. The
comprehensive utilization of all existing manufacturing data as well as their correct
representation play a key role here as does the critical assessment of the actual
situation. Various scenarios were considered, based on the representation of the
manufacturing processes in the simulation runs. The objective was to identify bot-
tlenecks and problems in production with the help of simulation. During the
simulation runs that were conducted, three different scenarios were considered, each
having different time-slot patterns and order situations.


1         Introduction
This paper deals with improvements in the production processes in the manufacture
of electronic components for the field of automation. A key role here is played by
the comprehensive recording and presentation of all existing production data as well
as a critical assessment of the actual situation.
Simulation here is taken to mean the quot;Replication of a dynamic process in a system
with the aid of an experimental model to obtain knowledge which can be applied to
real systemsquot; (VDI 2000). The ensuing replication of the procedures and processes
in production was realized with the simulation tool Arena Version 11.0. (cf. also
Kelton et al. 2006; Altiok and Melamed 2007). Using this simulation tool it is possi-
ble, as reported by Fuchs et al. (2004) and Treadwell and Herrmann (2005), to
examine chained assembly and production systems along with their decoupling
buffers and to assess them regarding their performance.
In order to support the efforts in the generation of models for the simulation of pro-
duction processes the simulation tool Arena offers, as described and applied by
Herpers and Schulz (2006), Rogers (2002) and Ali and de Souza (2007), the possi-
330                                                   Schulz, Thomas; Becker, Antje

bility of hierarchically building up models from standardized objects. Successive,
comprehensive and complex simulation models can be produced through insertion,
linking and parameterizing these objects. With event-oriented simulations the simu-
lated time normally runs substantially faster than the physical time describing the
real time referred to the modeled system. Through this type of control it is possible
to simulate long time spans in a temporally significantly shortened form and to ob-
tain conclusions about the behavior of chained production systems having different
time-slot patterns and order situations.


2       Production
The manufacture of automation components takes place in a single-shift production
facility. The production equipment is arranged oriented to the material flow so that
the organizational form is that of series production. Since the devices are always
regularly produced and are mostly technically similar, the type of production can be
regarded as large-scale variant production. There are a total of 81 different product
groups, distributed over four product sub-groups with 61.7 %, 21.0 %, 13.6 % and
3.7 % of the production volume. Taking the individual product groups together, the
variant range covers 432 different production components. The simulation begins
from the time the customer orders are released. This implies that the assemblies for
the components are already produced and all other parts needed are available.


Figure 1: Possible Working Sequences
Depending on the type of device, the production of the individual components can
take place in a minimum of three and a maximum of six working steps with a total
of seven different working sequences. Consequently, none of the products passes
through all the working steps which can be subdivided into manual insertion, pre-
liminary inspection, final assembly, high voltage test, continuous test, final inspec-
tion and prepackaging.
As the examples in Figure 1 clearly show, all products pass through manual inser-
tion, final inspection and prepackaging. There are only differences in the sequence
of the various tests. The total processing sequences which are possible can be taken
from the flow chart in Figure 2. However, it is worth noting here that the flow chart
includes repairs after the tests, whereas Figure 1 represents the working sequences
for the optimum case in production, i.e. without repairs. Whether after the test the
simulation must go through a repair or not, is represented by a probability given
from empirical values. During the preliminary inspection a 10% probability and
Improvement in Production Processes in the Electronics Sector                                                 331

during the high voltage test a 5% probability was accepted. For the repair after the
continuous test and the final inspection due to the negligibly small material repair
frequency a probability of 0% was accepted.


                         Production
                        Order Printed


                           Manual
                          Insertion


                          Preliminary   no
                          Inspection?


                          yes


                         Preliminary
    Reparation           Inspection


                                                                High Voltage   no
                   no       Test                                   Test?
                         successful?
                                                                 yes
                          yes
                                                               High Voltage
                                             Reparation
                                                                   Test
                            Final       no
                          Essembly?


                          yes                             no       Test
                                                                successful?

                           Final
                         Essembly                                yes


                                                                Continuous     no
                                                                   Test


                                                                 yes

                                                               Continuous                                 Final
                                             Reparation                             Reparation
                                                                  Test                                 Inspection


                                                          no       Test                          no       Test
                                                                successful?                            successful?

                                                                 yes                                    yes


                                                                                                      Prepackaging


                                                                                                        Shipping


Figure 2: Flow Chart
The simulation assumes that the working points are occupied normally so that the
distribution of the employees for the processing steps of manual insertion, final
assembly, preliminary inspection, high-voltage test, continuous test, final inspection,
repair and prepackaging can be taken as a fixed quantity.


3                Simulation
The simulation tool Arena Version 11.0 is based on mechanisms of event-oriented
simulation. In contrast to continuous simulation, with this type of simulation the
individual events play an important role. The characteristic feature of event-con-
trolled simulation is that each planned event has a time of occurrence and its
332                                                    Schulz, Thomas; Becker, Antje

occurrence causes a certain transition of status. The simulation time can be increased
to the time of occurrence of the next event and the relevant event can be simulated if
nothing significant occurs between these events. Through time incrementation to the
time of occurrence of the next event longer waiting periods are bridged.
After the implementation of all initial data, the model sequence begins. The data re-
quired for the progression of the simulation are read in from an Excel table after the
start of the simulation and then pass through the model as attributes of entities. The
basis for the data forms the actual quantity of orders of selected weeks of the re-
garded enterprise. For this the creation time, order number, order quantity and the
sequence number are essential. Appropriately specified probabilities define whether
the relevant product has to be repaired after a test or not. Before the entities leave
the model, the respective process time is acquired with the associated order number.
For improved evaluation of the scenarios, statistics with mean, minimum and maxi-
mum loading on the applied resources and queues were also included in the model
definition. The maximum duration for all simulation runs is restricted to two weeks
to ensure better comparability of the characterizing figures to be evaluated. The
respective operating time of the work procedures, which are differentiated according
to the products, corresponds to the adapted calculated operating time.
The distribution of resources represents a further constituent of the basic data. Here,
differentiation is made between the actually existing working points and the usual
manning of the working points, particularly as more working points are available
than employees. This differentiation is important for the subsequent consideration of
the scenarios between pure employee distribution and the full exploitation of all
capacities.


3.1      Simulation of Scenario 1
Scenario 1 represents one week with a relatively low order volume. To improve the
simulation results two analytical approaches are to be considered. Firstly, the man-
ning of the machines or working points can be varied with the existing number of
employees. The second approach checks in what relationship the manning of all
working points influences the result of the sum of the process times in comparison to
the result with a distribution of employees.
At the best solution found with distribution of the employees to other stations, the
final inspection is reduced by two employees and the manual insertion is increased
by two employees. At all other stations the original manning is retained. Although
the maximum queue length at manual insertion and that of prepackaging remain
constant, they in turn increase at the final inspection. The increased loading on final
inspection is compensated by the improvement at the other stations.
If all working points are manned, the percentage loading on all stations reduces or
remains partially constant and is reflected in the decisive characterizing figures. As a
result, it can be said of Scenario 1 that with a redistribution of the employees the
mean process time of the orders can be reduced by 5%. Increasing the personnel by
four employees causes a reduction in the sum of the process times of 17%.
Improvement in Production Processes in the Electronics Sector                       333


3.2      Simulation of Scenario 2
The simulation of Scenario 2 involves one week with an average order volume. With
a pure redistribution of the employees the simulation result can be improved, al-
though production completion takes up almost as much time as in the initial situa-
tion. In total at the best case found, the maximum queue length reduces, but the
mean loading falls. The queue length in prepackaging is clearly reduced, whereas
final inspection shows a marked increase. This increase however appears to have no
serious effect on the result. All other values do not display any significant changes
and for this reason are not mentioned at this point.
If all capacities are exploited, the production of the orders finishes only ten minutes
earlier than in the initial situation. However, the sum of the process times falls sub-
stantially. Similarly, there is a noticeable reduction of the values in prepackaging
and in final inspection, whereas the positive changes for manual insertion are rela-
tively slight. With Scenario 2 the redistribution of the employees can lead to a
reduction in the mean process time of up to 18%. If all resources are fully exploited
and the personnel is increase by four employees, the potential reduction in the sum
of the process times is 33%.


3.3      Simulation of Scenario 3
Scenario 3 represents one week with a very high order volume. When an employee
redistribution is carried out, the process time is of similar length as in the initial
situation, but the sum of the process times is substantially reduced. With the exploi-
tation of all capacities even more time is saved. Consideration of the results of
Scenario 3 for the case of the redistribution of employees shows that the loading and
the maximum queue length of manual insertion are only reduced slightly. A signifi-
cant improvement is seen with the preliminary inspection, but the values for the high
voltage test and final inspection have increased. Due to the improved loading values
of almost all stations, these increases to not impair the final result of the simulation
run.
If all capacities for Scenario 3 are fully exploited, the most noticeable change is with
the manual insertion. Furthermore, the prepackaging displays a clearly positive
change with regard to queue lengths and the mean order quantity. With all other
stations there were no far-reaching changes so that they are not mentioned at this
point. Comparison of the two methods of improvement demonstrate that in the case
of the redistribution of employees a time saving of up to 24% is possible. When the
capacity is fully loaded, the saving increases to 33%.


3.4      Comparison of the Scenarios
In all three scenarios the orders were finished in the specified time. Overall, with the
three scenarios an increase in the sum of the process times was found, but it must be
taken into account that both the mean process time per order and the mean quantity
per order have increased.
334                                                          Schulz, Thomas; Becker, Antje


      450%
      400%                                                 441%         low order volume
                                                                        (Scenario 1)
      350%
      300%                                                              average order volume
                                                                        (Scenario 2)
      250%
                                                                        very high order volume
      200%                                          231%                (Scenario 3)
                              226%
      150%
                       152%
      100%      100%                         100%
       50%
       0%
             process time per order   sum of the process times per
                                                  shift


Figure 3: Relationship between the process times and order situation
A percentage comparison of the respective increases in Figure 3 shows that the
process times increase disproportionately to the mean quantity per order. As an
example this is shown based on the data quot;Optimum with redistributionquot; for the three
scenarios.
From Scenario 1 to Scenario 2 the mean quantity per order increases by 17.02%.
The process time per order increases by 52.68%, whereas the sum of the process
times increases by 131.87%. Comparison between Scenario 1 and Scenario 3 shows
a rise in the mean quantities per order of 42.17%. In this case the process time per
order increases by 126.34% and the sum of the process times increases to even
341.15%.
If the respective potential improvements in the sum of the process times with redis-
tribution of the employees and exploitation of all capacities is compared in Figure 4,
an increase with higher order quantities is found. In Scenario 1, which represents a
low order situation, time savings of 5% with a redistribution of employees and 17%
with full exploitation of capacity are possible. Scenario 2, which represents an aver-
age order situation, includes a potential improvement of 18% due to employee
redistribution and 33% due to manning all working points. With the highest order
situation in Scenario 3 a reduction in the sum of the process times of 24% can be
obtained with redistribution of the employees and 33% with full exploitation of all
capacities.


4        Summary
The findings published by Hernandez-Matias et al. (2008), which shows that as a
simulation tool Arena presents a solid basis for a continuous improvement in pro-
duction processes can be confirmed with this paper. Through the comparison of
different simulation runs with in each case different allocation of resources, the best
distribution of personnel has been found for the individual scenarios. Despite a very
Improvement in Production Processes in the Electronics Sector                       335

detailed implementation of the production processes in the model, there are some
facts to be taken into account during the assessment of the results, so that the results
and evaluations of the scenarios should only be considered as a guideline for the
allocation of resources.


                                                                            33%
   Scenario 3                                              24%


                                                                            33%
   Scenario 2                                  18%


                                           17%
   Scenario 1        5%


            0%        5%       10%       15%         20%         25%    30%       35%

                   manning all working points with employees
                   redistribution of selected employees at working points


Figure 4: Potential Improvements in Time Saved
The scenarios represent in each case one order week and have been simulated
through to completion of production. The simulation starts at time zero and, in con-
trast to the real case, there is no production already running. Similarly, following
orders from the second week of simulation onwards are not taken into account. Fur-
thermore, in rare cases in the production of automation components rush orders are
possible which demand a change to the order processing or short term changes in
resource allocation. Situations of this nature have also not been taken into account in
the various scenarios.
All the processing times used for the devices produced are based on calculated times
which have been spread over the respective resources according to a specified distri-
bution schema. The decisive quantity here is manual insertion, which normally takes
up 70% of the total processing time. The comparison of all existing actual process-
ing times with the calculated target processing times has shown that with 61% of the
orders time deviations of more than 20% are obtained. An appropriate adaptation of
the calculated processing times for the respective products is recommended.
It is always preferable with a high order situation to place the focus on more intense
manning of manual insertion in order to facilitate a reduction of the queue lengths
there and quicker progress in production. However, it should be borne in mind that
increased use of personnel is linked to additional costs. This means that it is practi-
cable to consider the economic efficiency between the increased personnel costs and
the time advantage obtained.
In conclusion it can be said that based on the simulation results and the above men-
tioned critical points, adaptation of the calculated processing times is to be
336                                                  Schulz, Thomas; Becker, Antje

recommended. With these corrected values a subsequent regularly implemented
simulation of the current order situation represents one way of checking the existing
allocation of resources and, where necessary, their adaptation.


References
Ali, A.; de Souza, R. (2007) Modeling and simulation of hard disk drive final as-
      sembly using a HDD template. In: Henderson, S.G.; Biller, B.; Hsieh, M.-H.;
      Shortle, J.; Tew, J.D.; Barton, R.R. (eds.) Proceedings of the 2007 Winter
      Simulation Conference, Washington D.C. (USA). IEEE Press, Piscataway, pp.
      1641-1650
Altiok, T.; Melamed, B. (2007) Simulation modeling and analysis with Arena. Aca-
     demic Press, Amsterdam, Boston
Fuchs, M.; Friedland, R.; Gocev, P. (2004) Modeling and simulation of context-
     sensitive decisions on an assembly line. In: Mertins, K.; Rabe, M. (eds.): Ex-
     periences from the Future. New Methods and Applications in Simulation for
     Production and Logistics. Fraunhofer IRB, Stuttgart, pp. 95-102
Hernandez-Matias, J.C.; Vizan, A.; Perez-Garcia, J.; Rios, J. (2008) An integrated
     modeling framework to support manufacturing system diagnosis for
     continuous improvement. In: Robotics and CIM 24 (2008) 2, pp. 187-199
Herpers, S.; Schulz, T. (2006) Modellierung eines integrierten Produktion-Lager-
     Knotens. In: Wenzel, S. (ed.): Simulation in Produktion und Logistik 2006,
     Conference Proceedings 12th ASIM Dedicated Conference. SCS Publishing
     House, Erlangen, pp. 73-82
Kelton, W.D.; Sadowski, R.P.; Sturrock, D.T. (2006) Simulation with Arena, 4th ed.
     McGraw-Hill, New York
Rogers, P. (2002) Simulation of manufacturing operations: Optimum-seeking simu-
    lation in the design and control of manufacturing systems: Experience with
    optquest for Arena. In: Yücesan, E.; Chen, C.-H.; Snowdon, J.L.; Charnes,
    J.M. (eds.) Proceedings of the 2002 Winter Simulation Conference, San Diego
    (USA). IEEE, Piscataway, pp. 1142-1150
Treadwell, M.A.; Herrmann, J.C. (2005) A kanban module for simulating pull pro-
     duction in Arena. In: Kuhl, M.E.; Steiger, N.M.; Armstrong, F.B.; Joines, J.A.
     (eds.) Proceedings of the 2005 Winter Simulation Conference, Orlando (USA).
     SCS International, San Diego, pp. 1413-1417
VDI (2000) Richtlinie 3633, Blatt 1: Simulation von Logistik-, Materialfluss- und
    Produktions-systemen – Grundlagen. Beuth, Berlin

More Related Content

More from Thomas Schulz

Industrie 4.0 - Potentiale erkennen und umsetzten
Industrie 4.0 - Potentiale erkennen und umsetztenIndustrie 4.0 - Potentiale erkennen und umsetzten
Industrie 4.0 - Potentiale erkennen und umsetztenThomas Schulz
 
CAQ in der Aus- und Weiterbildung - Teil 2
CAQ in der Aus- und Weiterbildung - Teil 2CAQ in der Aus- und Weiterbildung - Teil 2
CAQ in der Aus- und Weiterbildung - Teil 2Thomas Schulz
 
Mit PC Hotel überwachen
Mit PC Hotel überwachenMit PC Hotel überwachen
Mit PC Hotel überwachenThomas Schulz
 
Produktionsplanung und Prozessoptimierung als integrativer Bestandteil von Ma...
Produktionsplanung und Prozessoptimierung als integrativer Bestandteil von Ma...Produktionsplanung und Prozessoptimierung als integrativer Bestandteil von Ma...
Produktionsplanung und Prozessoptimierung als integrativer Bestandteil von Ma...Thomas Schulz
 
Fundierte Basis für Entscheider
Fundierte Basis für EntscheiderFundierte Basis für Entscheider
Fundierte Basis für EntscheiderThomas Schulz
 
Reengineering am Beispiel eines Heizkraftwerks
Reengineering am Beispiel eines HeizkraftwerksReengineering am Beispiel eines Heizkraftwerks
Reengineering am Beispiel eines HeizkraftwerksThomas Schulz
 
Feuerverzinken - Sicher ins Jahr 2000
Feuerverzinken - Sicher ins Jahr 2000Feuerverzinken - Sicher ins Jahr 2000
Feuerverzinken - Sicher ins Jahr 2000Thomas Schulz
 
Freisetzung ungenutzter Reserven bei der Fertigung von Holzfaserplattender
Freisetzung ungenutzter Reserven bei der Fertigung von HolzfaserplattenderFreisetzung ungenutzter Reserven bei der Fertigung von Holzfaserplattender
Freisetzung ungenutzter Reserven bei der Fertigung von HolzfaserplattenderThomas Schulz
 
Feinplanung von Fertigungsaufträgen
Feinplanung von FertigungsaufträgenFeinplanung von Fertigungsaufträgen
Feinplanung von FertigungsaufträgenThomas Schulz
 
Fertigungs-Optimierung - MES-Lösung für Kennzahlenanalyse und Prozessüberwachung
Fertigungs-Optimierung - MES-Lösung für Kennzahlenanalyse und ProzessüberwachungFertigungs-Optimierung - MES-Lösung für Kennzahlenanalyse und Prozessüberwachung
Fertigungs-Optimierung - MES-Lösung für Kennzahlenanalyse und ProzessüberwachungThomas Schulz
 

More from Thomas Schulz (10)

Industrie 4.0 - Potentiale erkennen und umsetzten
Industrie 4.0 - Potentiale erkennen und umsetztenIndustrie 4.0 - Potentiale erkennen und umsetzten
Industrie 4.0 - Potentiale erkennen und umsetzten
 
CAQ in der Aus- und Weiterbildung - Teil 2
CAQ in der Aus- und Weiterbildung - Teil 2CAQ in der Aus- und Weiterbildung - Teil 2
CAQ in der Aus- und Weiterbildung - Teil 2
 
Mit PC Hotel überwachen
Mit PC Hotel überwachenMit PC Hotel überwachen
Mit PC Hotel überwachen
 
Produktionsplanung und Prozessoptimierung als integrativer Bestandteil von Ma...
Produktionsplanung und Prozessoptimierung als integrativer Bestandteil von Ma...Produktionsplanung und Prozessoptimierung als integrativer Bestandteil von Ma...
Produktionsplanung und Prozessoptimierung als integrativer Bestandteil von Ma...
 
Fundierte Basis für Entscheider
Fundierte Basis für EntscheiderFundierte Basis für Entscheider
Fundierte Basis für Entscheider
 
Reengineering am Beispiel eines Heizkraftwerks
Reengineering am Beispiel eines HeizkraftwerksReengineering am Beispiel eines Heizkraftwerks
Reengineering am Beispiel eines Heizkraftwerks
 
Feuerverzinken - Sicher ins Jahr 2000
Feuerverzinken - Sicher ins Jahr 2000Feuerverzinken - Sicher ins Jahr 2000
Feuerverzinken - Sicher ins Jahr 2000
 
Freisetzung ungenutzter Reserven bei der Fertigung von Holzfaserplattender
Freisetzung ungenutzter Reserven bei der Fertigung von HolzfaserplattenderFreisetzung ungenutzter Reserven bei der Fertigung von Holzfaserplattender
Freisetzung ungenutzter Reserven bei der Fertigung von Holzfaserplattender
 
Feinplanung von Fertigungsaufträgen
Feinplanung von FertigungsaufträgenFeinplanung von Fertigungsaufträgen
Feinplanung von Fertigungsaufträgen
 
Fertigungs-Optimierung - MES-Lösung für Kennzahlenanalyse und Prozessüberwachung
Fertigungs-Optimierung - MES-Lösung für Kennzahlenanalyse und ProzessüberwachungFertigungs-Optimierung - MES-Lösung für Kennzahlenanalyse und Prozessüberwachung
Fertigungs-Optimierung - MES-Lösung für Kennzahlenanalyse und Prozessüberwachung
 

Recently uploaded

Presentation on how to chat with PDF using ChatGPT code interpreter
Presentation on how to chat with PDF using ChatGPT code interpreterPresentation on how to chat with PDF using ChatGPT code interpreter
Presentation on how to chat with PDF using ChatGPT code interpreternaman860154
 
IAC 2024 - IA Fast Track to Search Focused AI Solutions
IAC 2024 - IA Fast Track to Search Focused AI SolutionsIAC 2024 - IA Fast Track to Search Focused AI Solutions
IAC 2024 - IA Fast Track to Search Focused AI SolutionsEnterprise Knowledge
 
Understanding the Laravel MVC Architecture
Understanding the Laravel MVC ArchitectureUnderstanding the Laravel MVC Architecture
Understanding the Laravel MVC ArchitecturePixlogix Infotech
 
08448380779 Call Girls In Civil Lines Women Seeking Men
08448380779 Call Girls In Civil Lines Women Seeking Men08448380779 Call Girls In Civil Lines Women Seeking Men
08448380779 Call Girls In Civil Lines Women Seeking MenDelhi Call girls
 
Neo4j - How KGs are shaping the future of Generative AI at AWS Summit London ...
Neo4j - How KGs are shaping the future of Generative AI at AWS Summit London ...Neo4j - How KGs are shaping the future of Generative AI at AWS Summit London ...
Neo4j - How KGs are shaping the future of Generative AI at AWS Summit London ...Neo4j
 
Key Features Of Token Development (1).pptx
Key  Features Of Token  Development (1).pptxKey  Features Of Token  Development (1).pptx
Key Features Of Token Development (1).pptxLBM Solutions
 
Automating Business Process via MuleSoft Composer | Bangalore MuleSoft Meetup...
Automating Business Process via MuleSoft Composer | Bangalore MuleSoft Meetup...Automating Business Process via MuleSoft Composer | Bangalore MuleSoft Meetup...
Automating Business Process via MuleSoft Composer | Bangalore MuleSoft Meetup...shyamraj55
 
Snow Chain-Integrated Tire for a Safe Drive on Winter Roads
Snow Chain-Integrated Tire for a Safe Drive on Winter RoadsSnow Chain-Integrated Tire for a Safe Drive on Winter Roads
Snow Chain-Integrated Tire for a Safe Drive on Winter RoadsHyundai Motor Group
 
Pigging Solutions in Pet Food Manufacturing
Pigging Solutions in Pet Food ManufacturingPigging Solutions in Pet Food Manufacturing
Pigging Solutions in Pet Food ManufacturingPigging Solutions
 
FULL ENJOY 🔝 8264348440 🔝 Call Girls in Diplomatic Enclave | Delhi
FULL ENJOY 🔝 8264348440 🔝 Call Girls in Diplomatic Enclave | DelhiFULL ENJOY 🔝 8264348440 🔝 Call Girls in Diplomatic Enclave | Delhi
FULL ENJOY 🔝 8264348440 🔝 Call Girls in Diplomatic Enclave | Delhisoniya singh
 
Human Factors of XR: Using Human Factors to Design XR Systems
Human Factors of XR: Using Human Factors to Design XR SystemsHuman Factors of XR: Using Human Factors to Design XR Systems
Human Factors of XR: Using Human Factors to Design XR SystemsMark Billinghurst
 
AI as an Interface for Commercial Buildings
AI as an Interface for Commercial BuildingsAI as an Interface for Commercial Buildings
AI as an Interface for Commercial BuildingsMemoori
 
WhatsApp 9892124323 ✓Call Girls In Kalyan ( Mumbai ) secure service
WhatsApp 9892124323 ✓Call Girls In Kalyan ( Mumbai ) secure serviceWhatsApp 9892124323 ✓Call Girls In Kalyan ( Mumbai ) secure service
WhatsApp 9892124323 ✓Call Girls In Kalyan ( Mumbai ) secure servicePooja Nehwal
 
Pigging Solutions Piggable Sweeping Elbows
Pigging Solutions Piggable Sweeping ElbowsPigging Solutions Piggable Sweeping Elbows
Pigging Solutions Piggable Sweeping ElbowsPigging Solutions
 
Enhancing Worker Digital Experience: A Hands-on Workshop for Partners
Enhancing Worker Digital Experience: A Hands-on Workshop for PartnersEnhancing Worker Digital Experience: A Hands-on Workshop for Partners
Enhancing Worker Digital Experience: A Hands-on Workshop for PartnersThousandEyes
 
Kotlin Multiplatform & Compose Multiplatform - Starter kit for pragmatics
Kotlin Multiplatform & Compose Multiplatform - Starter kit for pragmaticsKotlin Multiplatform & Compose Multiplatform - Starter kit for pragmatics
Kotlin Multiplatform & Compose Multiplatform - Starter kit for pragmaticscarlostorres15106
 
My Hashitalk Indonesia April 2024 Presentation
My Hashitalk Indonesia April 2024 PresentationMy Hashitalk Indonesia April 2024 Presentation
My Hashitalk Indonesia April 2024 PresentationRidwan Fadjar
 
The Codex of Business Writing Software for Real-World Solutions 2.pptx
The Codex of Business Writing Software for Real-World Solutions 2.pptxThe Codex of Business Writing Software for Real-World Solutions 2.pptx
The Codex of Business Writing Software for Real-World Solutions 2.pptxMalak Abu Hammad
 
Next-generation AAM aircraft unveiled by Supernal, S-A2
Next-generation AAM aircraft unveiled by Supernal, S-A2Next-generation AAM aircraft unveiled by Supernal, S-A2
Next-generation AAM aircraft unveiled by Supernal, S-A2Hyundai Motor Group
 

Recently uploaded (20)

Presentation on how to chat with PDF using ChatGPT code interpreter
Presentation on how to chat with PDF using ChatGPT code interpreterPresentation on how to chat with PDF using ChatGPT code interpreter
Presentation on how to chat with PDF using ChatGPT code interpreter
 
IAC 2024 - IA Fast Track to Search Focused AI Solutions
IAC 2024 - IA Fast Track to Search Focused AI SolutionsIAC 2024 - IA Fast Track to Search Focused AI Solutions
IAC 2024 - IA Fast Track to Search Focused AI Solutions
 
Understanding the Laravel MVC Architecture
Understanding the Laravel MVC ArchitectureUnderstanding the Laravel MVC Architecture
Understanding the Laravel MVC Architecture
 
Vulnerability_Management_GRC_by Sohang Sengupta.pptx
Vulnerability_Management_GRC_by Sohang Sengupta.pptxVulnerability_Management_GRC_by Sohang Sengupta.pptx
Vulnerability_Management_GRC_by Sohang Sengupta.pptx
 
08448380779 Call Girls In Civil Lines Women Seeking Men
08448380779 Call Girls In Civil Lines Women Seeking Men08448380779 Call Girls In Civil Lines Women Seeking Men
08448380779 Call Girls In Civil Lines Women Seeking Men
 
Neo4j - How KGs are shaping the future of Generative AI at AWS Summit London ...
Neo4j - How KGs are shaping the future of Generative AI at AWS Summit London ...Neo4j - How KGs are shaping the future of Generative AI at AWS Summit London ...
Neo4j - How KGs are shaping the future of Generative AI at AWS Summit London ...
 
Key Features Of Token Development (1).pptx
Key  Features Of Token  Development (1).pptxKey  Features Of Token  Development (1).pptx
Key Features Of Token Development (1).pptx
 
Automating Business Process via MuleSoft Composer | Bangalore MuleSoft Meetup...
Automating Business Process via MuleSoft Composer | Bangalore MuleSoft Meetup...Automating Business Process via MuleSoft Composer | Bangalore MuleSoft Meetup...
Automating Business Process via MuleSoft Composer | Bangalore MuleSoft Meetup...
 
Snow Chain-Integrated Tire for a Safe Drive on Winter Roads
Snow Chain-Integrated Tire for a Safe Drive on Winter RoadsSnow Chain-Integrated Tire for a Safe Drive on Winter Roads
Snow Chain-Integrated Tire for a Safe Drive on Winter Roads
 
Pigging Solutions in Pet Food Manufacturing
Pigging Solutions in Pet Food ManufacturingPigging Solutions in Pet Food Manufacturing
Pigging Solutions in Pet Food Manufacturing
 
FULL ENJOY 🔝 8264348440 🔝 Call Girls in Diplomatic Enclave | Delhi
FULL ENJOY 🔝 8264348440 🔝 Call Girls in Diplomatic Enclave | DelhiFULL ENJOY 🔝 8264348440 🔝 Call Girls in Diplomatic Enclave | Delhi
FULL ENJOY 🔝 8264348440 🔝 Call Girls in Diplomatic Enclave | Delhi
 
Human Factors of XR: Using Human Factors to Design XR Systems
Human Factors of XR: Using Human Factors to Design XR SystemsHuman Factors of XR: Using Human Factors to Design XR Systems
Human Factors of XR: Using Human Factors to Design XR Systems
 
AI as an Interface for Commercial Buildings
AI as an Interface for Commercial BuildingsAI as an Interface for Commercial Buildings
AI as an Interface for Commercial Buildings
 
WhatsApp 9892124323 ✓Call Girls In Kalyan ( Mumbai ) secure service
WhatsApp 9892124323 ✓Call Girls In Kalyan ( Mumbai ) secure serviceWhatsApp 9892124323 ✓Call Girls In Kalyan ( Mumbai ) secure service
WhatsApp 9892124323 ✓Call Girls In Kalyan ( Mumbai ) secure service
 
Pigging Solutions Piggable Sweeping Elbows
Pigging Solutions Piggable Sweeping ElbowsPigging Solutions Piggable Sweeping Elbows
Pigging Solutions Piggable Sweeping Elbows
 
Enhancing Worker Digital Experience: A Hands-on Workshop for Partners
Enhancing Worker Digital Experience: A Hands-on Workshop for PartnersEnhancing Worker Digital Experience: A Hands-on Workshop for Partners
Enhancing Worker Digital Experience: A Hands-on Workshop for Partners
 
Kotlin Multiplatform & Compose Multiplatform - Starter kit for pragmatics
Kotlin Multiplatform & Compose Multiplatform - Starter kit for pragmaticsKotlin Multiplatform & Compose Multiplatform - Starter kit for pragmatics
Kotlin Multiplatform & Compose Multiplatform - Starter kit for pragmatics
 
My Hashitalk Indonesia April 2024 Presentation
My Hashitalk Indonesia April 2024 PresentationMy Hashitalk Indonesia April 2024 Presentation
My Hashitalk Indonesia April 2024 Presentation
 
The Codex of Business Writing Software for Real-World Solutions 2.pptx
The Codex of Business Writing Software for Real-World Solutions 2.pptxThe Codex of Business Writing Software for Real-World Solutions 2.pptx
The Codex of Business Writing Software for Real-World Solutions 2.pptx
 
Next-generation AAM aircraft unveiled by Supernal, S-A2
Next-generation AAM aircraft unveiled by Supernal, S-A2Next-generation AAM aircraft unveiled by Supernal, S-A2
Next-generation AAM aircraft unveiled by Supernal, S-A2
 

Improvement in Production Processes in a Company in the Electronics Sector using Simulation

  • 1. Advances in Simulation for Production and Logistics Applications Markus Rabe (ed.) Stuttgart, Fraunhofer IRB Verlag 2008 Improvement in Production Processes in a Company in the Electronics Sector using Simulation Verbesserung der Fertigungsabläufe in einem Unternehmen der Elektronikbranche mit Hilfe der Simulation Thomas Schulz, Antje Becker, Rockwell Automation GmbH, Haan (Germany) Abstract: This paper deals with improvements in production runs in the manufac- ture of electronic components for application in automatic control engineering. The comprehensive utilization of all existing manufacturing data as well as their correct representation play a key role here as does the critical assessment of the actual situation. Various scenarios were considered, based on the representation of the manufacturing processes in the simulation runs. The objective was to identify bot- tlenecks and problems in production with the help of simulation. During the simulation runs that were conducted, three different scenarios were considered, each having different time-slot patterns and order situations. 1 Introduction This paper deals with improvements in the production processes in the manufacture of electronic components for the field of automation. A key role here is played by the comprehensive recording and presentation of all existing production data as well as a critical assessment of the actual situation. Simulation here is taken to mean the quot;Replication of a dynamic process in a system with the aid of an experimental model to obtain knowledge which can be applied to real systemsquot; (VDI 2000). The ensuing replication of the procedures and processes in production was realized with the simulation tool Arena Version 11.0. (cf. also Kelton et al. 2006; Altiok and Melamed 2007). Using this simulation tool it is possi- ble, as reported by Fuchs et al. (2004) and Treadwell and Herrmann (2005), to examine chained assembly and production systems along with their decoupling buffers and to assess them regarding their performance. In order to support the efforts in the generation of models for the simulation of pro- duction processes the simulation tool Arena offers, as described and applied by Herpers and Schulz (2006), Rogers (2002) and Ali and de Souza (2007), the possi-
  • 2. 330 Schulz, Thomas; Becker, Antje bility of hierarchically building up models from standardized objects. Successive, comprehensive and complex simulation models can be produced through insertion, linking and parameterizing these objects. With event-oriented simulations the simu- lated time normally runs substantially faster than the physical time describing the real time referred to the modeled system. Through this type of control it is possible to simulate long time spans in a temporally significantly shortened form and to ob- tain conclusions about the behavior of chained production systems having different time-slot patterns and order situations. 2 Production The manufacture of automation components takes place in a single-shift production facility. The production equipment is arranged oriented to the material flow so that the organizational form is that of series production. Since the devices are always regularly produced and are mostly technically similar, the type of production can be regarded as large-scale variant production. There are a total of 81 different product groups, distributed over four product sub-groups with 61.7 %, 21.0 %, 13.6 % and 3.7 % of the production volume. Taking the individual product groups together, the variant range covers 432 different production components. The simulation begins from the time the customer orders are released. This implies that the assemblies for the components are already produced and all other parts needed are available. Figure 1: Possible Working Sequences Depending on the type of device, the production of the individual components can take place in a minimum of three and a maximum of six working steps with a total of seven different working sequences. Consequently, none of the products passes through all the working steps which can be subdivided into manual insertion, pre- liminary inspection, final assembly, high voltage test, continuous test, final inspec- tion and prepackaging. As the examples in Figure 1 clearly show, all products pass through manual inser- tion, final inspection and prepackaging. There are only differences in the sequence of the various tests. The total processing sequences which are possible can be taken from the flow chart in Figure 2. However, it is worth noting here that the flow chart includes repairs after the tests, whereas Figure 1 represents the working sequences for the optimum case in production, i.e. without repairs. Whether after the test the simulation must go through a repair or not, is represented by a probability given from empirical values. During the preliminary inspection a 10% probability and
  • 3. Improvement in Production Processes in the Electronics Sector 331 during the high voltage test a 5% probability was accepted. For the repair after the continuous test and the final inspection due to the negligibly small material repair frequency a probability of 0% was accepted. Production Order Printed Manual Insertion Preliminary no Inspection? yes Preliminary Reparation Inspection High Voltage no no Test Test? successful? yes yes High Voltage Reparation Test Final no Essembly? yes no Test successful? Final Essembly yes Continuous no Test yes Continuous Final Reparation Reparation Test Inspection no Test no Test successful? successful? yes yes Prepackaging Shipping Figure 2: Flow Chart The simulation assumes that the working points are occupied normally so that the distribution of the employees for the processing steps of manual insertion, final assembly, preliminary inspection, high-voltage test, continuous test, final inspection, repair and prepackaging can be taken as a fixed quantity. 3 Simulation The simulation tool Arena Version 11.0 is based on mechanisms of event-oriented simulation. In contrast to continuous simulation, with this type of simulation the individual events play an important role. The characteristic feature of event-con- trolled simulation is that each planned event has a time of occurrence and its
  • 4. 332 Schulz, Thomas; Becker, Antje occurrence causes a certain transition of status. The simulation time can be increased to the time of occurrence of the next event and the relevant event can be simulated if nothing significant occurs between these events. Through time incrementation to the time of occurrence of the next event longer waiting periods are bridged. After the implementation of all initial data, the model sequence begins. The data re- quired for the progression of the simulation are read in from an Excel table after the start of the simulation and then pass through the model as attributes of entities. The basis for the data forms the actual quantity of orders of selected weeks of the re- garded enterprise. For this the creation time, order number, order quantity and the sequence number are essential. Appropriately specified probabilities define whether the relevant product has to be repaired after a test or not. Before the entities leave the model, the respective process time is acquired with the associated order number. For improved evaluation of the scenarios, statistics with mean, minimum and maxi- mum loading on the applied resources and queues were also included in the model definition. The maximum duration for all simulation runs is restricted to two weeks to ensure better comparability of the characterizing figures to be evaluated. The respective operating time of the work procedures, which are differentiated according to the products, corresponds to the adapted calculated operating time. The distribution of resources represents a further constituent of the basic data. Here, differentiation is made between the actually existing working points and the usual manning of the working points, particularly as more working points are available than employees. This differentiation is important for the subsequent consideration of the scenarios between pure employee distribution and the full exploitation of all capacities. 3.1 Simulation of Scenario 1 Scenario 1 represents one week with a relatively low order volume. To improve the simulation results two analytical approaches are to be considered. Firstly, the man- ning of the machines or working points can be varied with the existing number of employees. The second approach checks in what relationship the manning of all working points influences the result of the sum of the process times in comparison to the result with a distribution of employees. At the best solution found with distribution of the employees to other stations, the final inspection is reduced by two employees and the manual insertion is increased by two employees. At all other stations the original manning is retained. Although the maximum queue length at manual insertion and that of prepackaging remain constant, they in turn increase at the final inspection. The increased loading on final inspection is compensated by the improvement at the other stations. If all working points are manned, the percentage loading on all stations reduces or remains partially constant and is reflected in the decisive characterizing figures. As a result, it can be said of Scenario 1 that with a redistribution of the employees the mean process time of the orders can be reduced by 5%. Increasing the personnel by four employees causes a reduction in the sum of the process times of 17%.
  • 5. Improvement in Production Processes in the Electronics Sector 333 3.2 Simulation of Scenario 2 The simulation of Scenario 2 involves one week with an average order volume. With a pure redistribution of the employees the simulation result can be improved, al- though production completion takes up almost as much time as in the initial situa- tion. In total at the best case found, the maximum queue length reduces, but the mean loading falls. The queue length in prepackaging is clearly reduced, whereas final inspection shows a marked increase. This increase however appears to have no serious effect on the result. All other values do not display any significant changes and for this reason are not mentioned at this point. If all capacities are exploited, the production of the orders finishes only ten minutes earlier than in the initial situation. However, the sum of the process times falls sub- stantially. Similarly, there is a noticeable reduction of the values in prepackaging and in final inspection, whereas the positive changes for manual insertion are rela- tively slight. With Scenario 2 the redistribution of the employees can lead to a reduction in the mean process time of up to 18%. If all resources are fully exploited and the personnel is increase by four employees, the potential reduction in the sum of the process times is 33%. 3.3 Simulation of Scenario 3 Scenario 3 represents one week with a very high order volume. When an employee redistribution is carried out, the process time is of similar length as in the initial situation, but the sum of the process times is substantially reduced. With the exploi- tation of all capacities even more time is saved. Consideration of the results of Scenario 3 for the case of the redistribution of employees shows that the loading and the maximum queue length of manual insertion are only reduced slightly. A signifi- cant improvement is seen with the preliminary inspection, but the values for the high voltage test and final inspection have increased. Due to the improved loading values of almost all stations, these increases to not impair the final result of the simulation run. If all capacities for Scenario 3 are fully exploited, the most noticeable change is with the manual insertion. Furthermore, the prepackaging displays a clearly positive change with regard to queue lengths and the mean order quantity. With all other stations there were no far-reaching changes so that they are not mentioned at this point. Comparison of the two methods of improvement demonstrate that in the case of the redistribution of employees a time saving of up to 24% is possible. When the capacity is fully loaded, the saving increases to 33%. 3.4 Comparison of the Scenarios In all three scenarios the orders were finished in the specified time. Overall, with the three scenarios an increase in the sum of the process times was found, but it must be taken into account that both the mean process time per order and the mean quantity per order have increased.
  • 6. 334 Schulz, Thomas; Becker, Antje 450% 400% 441% low order volume (Scenario 1) 350% 300% average order volume (Scenario 2) 250% very high order volume 200% 231% (Scenario 3) 226% 150% 152% 100% 100% 100% 50% 0% process time per order sum of the process times per shift Figure 3: Relationship between the process times and order situation A percentage comparison of the respective increases in Figure 3 shows that the process times increase disproportionately to the mean quantity per order. As an example this is shown based on the data quot;Optimum with redistributionquot; for the three scenarios. From Scenario 1 to Scenario 2 the mean quantity per order increases by 17.02%. The process time per order increases by 52.68%, whereas the sum of the process times increases by 131.87%. Comparison between Scenario 1 and Scenario 3 shows a rise in the mean quantities per order of 42.17%. In this case the process time per order increases by 126.34% and the sum of the process times increases to even 341.15%. If the respective potential improvements in the sum of the process times with redis- tribution of the employees and exploitation of all capacities is compared in Figure 4, an increase with higher order quantities is found. In Scenario 1, which represents a low order situation, time savings of 5% with a redistribution of employees and 17% with full exploitation of capacity are possible. Scenario 2, which represents an aver- age order situation, includes a potential improvement of 18% due to employee redistribution and 33% due to manning all working points. With the highest order situation in Scenario 3 a reduction in the sum of the process times of 24% can be obtained with redistribution of the employees and 33% with full exploitation of all capacities. 4 Summary The findings published by Hernandez-Matias et al. (2008), which shows that as a simulation tool Arena presents a solid basis for a continuous improvement in pro- duction processes can be confirmed with this paper. Through the comparison of different simulation runs with in each case different allocation of resources, the best distribution of personnel has been found for the individual scenarios. Despite a very
  • 7. Improvement in Production Processes in the Electronics Sector 335 detailed implementation of the production processes in the model, there are some facts to be taken into account during the assessment of the results, so that the results and evaluations of the scenarios should only be considered as a guideline for the allocation of resources. 33% Scenario 3 24% 33% Scenario 2 18% 17% Scenario 1 5% 0% 5% 10% 15% 20% 25% 30% 35% manning all working points with employees redistribution of selected employees at working points Figure 4: Potential Improvements in Time Saved The scenarios represent in each case one order week and have been simulated through to completion of production. The simulation starts at time zero and, in con- trast to the real case, there is no production already running. Similarly, following orders from the second week of simulation onwards are not taken into account. Fur- thermore, in rare cases in the production of automation components rush orders are possible which demand a change to the order processing or short term changes in resource allocation. Situations of this nature have also not been taken into account in the various scenarios. All the processing times used for the devices produced are based on calculated times which have been spread over the respective resources according to a specified distri- bution schema. The decisive quantity here is manual insertion, which normally takes up 70% of the total processing time. The comparison of all existing actual process- ing times with the calculated target processing times has shown that with 61% of the orders time deviations of more than 20% are obtained. An appropriate adaptation of the calculated processing times for the respective products is recommended. It is always preferable with a high order situation to place the focus on more intense manning of manual insertion in order to facilitate a reduction of the queue lengths there and quicker progress in production. However, it should be borne in mind that increased use of personnel is linked to additional costs. This means that it is practi- cable to consider the economic efficiency between the increased personnel costs and the time advantage obtained. In conclusion it can be said that based on the simulation results and the above men- tioned critical points, adaptation of the calculated processing times is to be
  • 8. 336 Schulz, Thomas; Becker, Antje recommended. With these corrected values a subsequent regularly implemented simulation of the current order situation represents one way of checking the existing allocation of resources and, where necessary, their adaptation. References Ali, A.; de Souza, R. (2007) Modeling and simulation of hard disk drive final as- sembly using a HDD template. In: Henderson, S.G.; Biller, B.; Hsieh, M.-H.; Shortle, J.; Tew, J.D.; Barton, R.R. (eds.) Proceedings of the 2007 Winter Simulation Conference, Washington D.C. (USA). IEEE Press, Piscataway, pp. 1641-1650 Altiok, T.; Melamed, B. (2007) Simulation modeling and analysis with Arena. Aca- demic Press, Amsterdam, Boston Fuchs, M.; Friedland, R.; Gocev, P. (2004) Modeling and simulation of context- sensitive decisions on an assembly line. In: Mertins, K.; Rabe, M. (eds.): Ex- periences from the Future. New Methods and Applications in Simulation for Production and Logistics. Fraunhofer IRB, Stuttgart, pp. 95-102 Hernandez-Matias, J.C.; Vizan, A.; Perez-Garcia, J.; Rios, J. (2008) An integrated modeling framework to support manufacturing system diagnosis for continuous improvement. In: Robotics and CIM 24 (2008) 2, pp. 187-199 Herpers, S.; Schulz, T. (2006) Modellierung eines integrierten Produktion-Lager- Knotens. In: Wenzel, S. (ed.): Simulation in Produktion und Logistik 2006, Conference Proceedings 12th ASIM Dedicated Conference. SCS Publishing House, Erlangen, pp. 73-82 Kelton, W.D.; Sadowski, R.P.; Sturrock, D.T. (2006) Simulation with Arena, 4th ed. McGraw-Hill, New York Rogers, P. (2002) Simulation of manufacturing operations: Optimum-seeking simu- lation in the design and control of manufacturing systems: Experience with optquest for Arena. In: Yücesan, E.; Chen, C.-H.; Snowdon, J.L.; Charnes, J.M. (eds.) Proceedings of the 2002 Winter Simulation Conference, San Diego (USA). IEEE, Piscataway, pp. 1142-1150 Treadwell, M.A.; Herrmann, J.C. (2005) A kanban module for simulating pull pro- duction in Arena. In: Kuhl, M.E.; Steiger, N.M.; Armstrong, F.B.; Joines, J.A. (eds.) Proceedings of the 2005 Winter Simulation Conference, Orlando (USA). SCS International, San Diego, pp. 1413-1417 VDI (2000) Richtlinie 3633, Blatt 1: Simulation von Logistik-, Materialfluss- und Produktions-systemen – Grundlagen. Beuth, Berlin