Imact Of Compounding On Investment Returns
•
0 likes•190 views

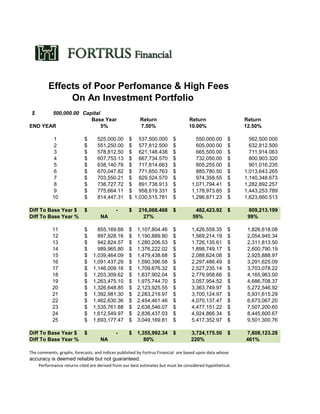
Chart reflecting how portfolio size is greatly impacted by returns and fees.

Recommended
More Related Content
What's hot
What's hot (8)
Similar to Imact Of Compounding On Investment Returns
Similar to Imact Of Compounding On Investment Returns (20)
Imact Of Compounding On Investment Returns
- 1. Effects of Poor Perfomance & High Fees On An Investment Portfolio 500,000.00$ Capital Base Year Return Return Return END YEAR 5% 7.50% 10.00% 12.50% 1 525,000.00$ 537,500.000$ 550,000.00$ 562,500.000$ 2 551,250.00$ 577,812.500$ 605,000.00$ 632,812.500$ 3 578,812.50$ 621,148.438$ 665,500.00$ 711,914.063$ 4 607,753.13$ 667,734.570$ 732,050.00$ 800,903.320$ 5 638,140.78$ 717,814.663$ 805,255.00$ 901,016.235$ 6 670,047.82$ 771,650.763$ 885,780.50$ 1,013,643.265$ 7 703,550.21$ 829,524.570$ 974,358.55$ 1,140,348.673$ 8 738,727.72$ 891,738.913$ 1,071,794.41$ 1,282,892.257$ 9 775,664.11$ 958,619.331$ 1,178,973.85$ 1,443,253.789$ 10 814,447.31$ 1,030,515.781$ 1,296,871.23$ 1,623,660.513$ Diff To Base Year $ -$ 216,068.468$ 482,423.92$ 809,213.199$ Diff To Base Year % NA 27% 59% 99% 11 855,169.68$ 1,107,804.46$ 1,426,558.35$ 1,826,618.08$ 12 897,928.16$ 1,190,889.80$ 1,569,214.19$ 2,054,945.34$ 13 942,824.57$ 1,280,206.53$ 1,726,135.61$ 2,311,813.50$ 14 989,965.80$ 1,376,222.02$ 1,898,749.17$ 2,600,790.19$ 15 1,039,464.09$ 1,479,438.68$ 2,088,624.08$ 2,925,888.97$ 16 1,091,437.29$ 1,590,396.58$ 2,297,486.49$ 3,291,625.09$ 17 1,146,009.16$ 1,709,676.32$ 2,527,235.14$ 3,703,078.22$ 18 1,203,309.62$ 1,837,902.04$ 2,779,958.66$ 4,165,963.00$ 19 1,263,475.10$ 1,975,744.70$ 3,057,954.52$ 4,686,708.37$ 20 1,326,648.85$ 2,123,925.55$ 3,363,749.97$ 5,272,546.92$ 21 1,392,981.30$ 2,283,219.97$ 3,700,124.97$ 5,931,615.29$ 22 1,462,630.36$ 2,454,461.46$ 4,070,137.47$ 6,673,067.20$ 23 1,535,761.88$ 2,638,546.07$ 4,477,151.22$ 7,507,200.60$ 24 1,612,549.97$ 2,836,437.03$ 4,924,866.34$ 8,445,600.67$ 25 1,693,177.47$ 3,049,169.81$ 5,417,352.97$ 9,501,300.76$ Diff To Base Year $ -$ 1,355,992.34$ 3,724,175.50$ 7,808,123.28$ Diff To Base Year % NA 80% 220% 461% The comments, graphs, forecasts, and indices published by Fortrus Financial are based upon data whose accuracy is deemed reliable but not guaranteed. Performance returns cited are derived from our best estimates but must be considered hypothetical.