IAM_57_Turning the Spotlight - Kent Richardson and Erik Oliver - from IAM
•
0 likes•226 views

This document analyzes data from 186 patent packages totaling over 5,000 US patents that were brokered over a three year period to provide insights into the brokered patent market. Some key findings include: 1) Pricing guidance for patent packages in the brokered market is significantly lower than prices of publicly reported deals, with an average asking price of $344,000 per patent asset. 2) Most patent packages (78%) contain 10 or fewer US patents, with the average package containing 8 US patents. Larger packages with over 20 patents are less attractive to buyers due to high diligence costs. 3) It takes an average of 51 days for buyers to review a package

Recommended
More Related Content
Similar to IAM_57_Turning the Spotlight - Kent Richardson and Erik Oliver - from IAM
Similar to IAM_57_Turning the Spotlight - Kent Richardson and Erik Oliver - from IAM (20)
IAM_57_Turning the Spotlight - Kent Richardson and Erik Oliver - from IAM
- 1. Intellectual Asset Management January/February 2013 11www.iam-magazine.com Turning the spotlight on the brokered patent market Corporations regularly evaluate patent purchases and sales to address strategic business problems – typically buying patents to counter assert and selling to raise revenue. However, a lack of information about the market makes any evaluation extraordinarily difficult. A simple example illustrates the problem. Looking at the headline numbers alone from the roughly 20 public patent sales since 2010, a distorted picture emerges. Analysis of those deals suggests a purchase price of nearly US$970,000 per patent asset. However, this is significantly higher than the asking price per patent asset for most deals we have seen – US$344,000 – so any analysis using the public market could be seriously flawed. In addition, public information also fails to explain: • How many packages are on the market in a year (276). • The chances of selling a patent (about 16%). • How long it takes to sell a patent (between six and nine months). • The technologies that are available and which technologies sell (visible and high-tech). We look at the public – yet not particularly well understood – market for Although sales of brokered patent packages reach an estimated US$153 million a year, lack of data makes this a tricky market to evaluate. A review of 186 patent packages attempts to illuminate this information void By Kent Richardson and Erik Oliver bare patent transactions created primarily by patent brokers and regular patent sellers. We consider a sample of 186 total packages containing a total of 5,394 issued US patents and 7,595 total patent assets worldwide from the past three years to provide a richer, more complete view of this marketplace. Our analysis is based on a sample of the market, not the entire market. We estimate that while running buying programmes, we saw somewhere between 35% and 75% of the available packages, depending on the time and the particular project. Also, because of our clients’locations, we tended to see more US-focused transactions. We have excluded some very large deals that had over 200 patents or were not widely distributed, even though brokers may have been involved from our analysis, in order to provide decision makers with clear insights about the characteristics of the pool of packages that are readily available. Even with these notes, we believe that our data is sufficient to draw conclusions about the market. Patent brokers When a patent buyer is trying to find patents to counter assert, a large pool of potentially available patent assets must be reviewed. Many patents will fail to meet a buyer’s business needs, so a large pool is necessary. The patent broker community provides access to such a pool with specific assets that are known to be available for sale. This broker-supplied pool reduces a buyer’s diligence costs substantially. Also, brokers bring useful skills, including the following: • Selecting viable sellers, including some certainty that the seller is willing to sell. • Filtering patents and identifying important patents and claims. • Providing pricing guidance. • Providing guidance as to reasonable sale terms and timelines. Market movers
- 2. www.iam-magazine.com12 Intellectual Asset Management January/February 2013 Market movers • Defining the process for diligence, bidding and sale. For a list of brokers and contact information, see www.richardsonoliver.com/ brokers. Patent broker data Since 2009, we have interacted with more than 50 different patent brokers and sellers. The majority of brokers are relatively inactive and some no longer exist. However, some brokers have actively participated in the patent brokerage market for years. In the last 12 months, we saw 14 brokers that had at least three packages on the market. They are listed in Table 1. AST, HP, IBM, Intellectual Ventures, OIN and RPX are some of the repeat sellers of patents that we have observed. RPX’s presence is particularly notable since its selling programme began only in late 2011. When we reviewed our broker and seller data, we did not find correlations that we had anticipated. For example, there was no general correlation between the brokers and deal price (except at the extreme ends), the package sizes or the specific technology area. Anecdotally, we have found that brokers prefer technology areas that appear to sell better rather than because the broker has a specific technology capability. For example, user-interface patents and long- term evolution (LTE) related patents tend to sell better than semiconductor patents and brokers select packages accordingly. Other areas that appeared to be uncorrelated include the number of offerings relative to the higher perceived quality of the offerings – some of the better-quality packages came from brokers that put fewer packages on the market. Quality here is defined as how well the patents match the target market identified by the broker’s materials compared to our analysis of the market, technology and patents. We use a process of successive refinement in each area to identify quickly patents that will meet our clients’ needs and eliminate those that do not. Accurate identification of the target market by the brokers improves our process by lowering diligence costs and accelerating the time to a decision. However, we did find one important correlation: brokers that provide the highest-quality packages include evidence of use (EOU) with their packages more than 80% of the time. Key diligence data Upon receipt of a package from a broker, the prospective buyer is faced with some important questions: how much time and effort should I spend determining whether to bid? Knowing that very few of the packages are going to be relevant to my business, how do I best allocate my resources? The following section addresses some of those initial resource allocation questions in the context of actual data. Pricing data – disconnect from the public data For any package, the first and simplest question to answer is whether it is within the buyer’s budget. The broker’s pricing guidance is critical to determine whether any resources should be spent analysing the package. Consider how difficult the absence of pricing information is for the buyer: are the seller’s price expectations exceeding market prices? Does the broker have a good sense of the market? Is the seller just testing the waters? Is there a serious flaw in the patents? To save resources, buyers do not start diligence on packages with pricing guidance higher than their limit or well outside market prices. We see a significant improvement in pricing and price expectations information in the market. Even three years ago, we felt that prices were often unclear or unstated, and that the price of a particular package had little anchoring to market prices. We now see pricing guidance provided more regularly, and that guidance typically falls within market price ranges of other packages. Nonetheless, lack of pricing guidance continues to be a significant factor for the decision as to whether to bid on a package. For example, nearly half of the packages lack pricing guidance – this remains true for even the most recent 50 packages that we have Table 1. Broker list Table 2. Summary of data Brokers with at least three packages in last 12 months (listed alphabetically) Acorn Technologies Blue Sage Epicenter IP GTT Group Hoffman Law Firm ICAP Iceberg Innovation Capital Intellectual Profit IP Investments Group IP Offerings IPVALUE Marqera Patent Profit TAEUS Packages included in the study 186 Number of issued US patents 5,394 Total assets 7,595 Packages old enough to have sold 96 Sold 15 Percentage sold 16% Asking price per US issued patent US$577,000 Asking price per listed patent asset US$344,000 Average number of US issued patents per package 8 (excluding packages with over 200 assets) Median number of US-issued patents per package 4 (excluding packages with over 200 assets) Percentage of packages with 10 or fewer issued US patents 78% Average days from receipt to bid due 51 Average days from receipt to disposition by ROL group 21 Annual sales US$153 million Receipt of package to assignment record (days) 173
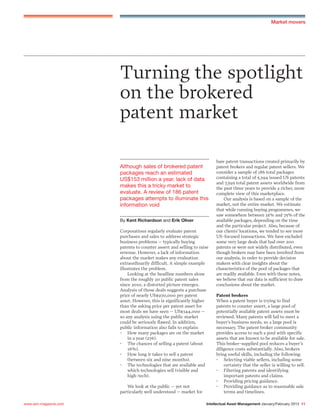
- 3. Numberofpackages Broker pricing guide <US$500k 19 US$500k-1M 29 US$20M+ 7 US$10-20M 4 US$4-10M 11 US$2-4M 14 US$1-2M 28 # of packages 0 5 10 15 20 25 30 35 Intellectual Asset Management January/February 2013 13www.iam-magazine.com Market movers evaluated. Generally, the more frequently that brokers offer packages, the more likely they are to provide pricing guidance. Pricing guidance is typically communicated as a somewhat broad range, rather than in precise terms – for example, “We think this package will sell in the low seven figures.” We therefore use pricing buckets that correspond to these ranges. Often the range information is communicated solely over the phone, adding some complexity to obtaining the information. For 112 deals where pricing was available, there was a clear preference for deals under US$2 million. To enable comparison with publicly reported deals, we computed a price per issued US patent, as well as a price per listed patent asset. In doing so, we used the midpoint of the price bucket as the estimated deal price (eg, for the US$1 million to US$2 million range, US$1.5 million is used). Two exceptions were made: one for the US$20 million-plus range, where US$20 million is used as the price; and the other for the US$4 million to US$10 million range, where detailed analysis of the deal data indicates that US$5.7 million, as opposed to US$7 million, provides a better indication of average pricing guidance. The pricing guidance is much lower than what publicly reported deals might suggest. For public deals between 2010 and 2012, the average price per sold asset was closer to US$970,000 per patent. Interestingly, the latest attempt to sell Kodak’s portfolio suggests that public markets may be coming back into line with the broker market. Looking across all deal sizes, we computed an average asking price per listed patent asset of US$344,000, with an average asking price per issued US patent of US$577,000 (we removed the top and bottom 5% of the data to reduce distortions from a handful of outliers). We also analysed the data within each pricing bucket. A note of caution: these prices are based on the broker’s pricing guidance, not on actual closed transactions. We had insufficient data to analyse the asking price per patent asset for sold packages. Number of assets per package Looking at package size, 78% of all packages have 10 or fewer US patents. The average package size (excluding packages with greater than 200 US patents or patent assets) has eight US patents or 14 total patent assets. Based on our data, once a package has more than 10 US issued patents, it is considered unusual. We find that smaller package sizes help buyers to focus their diligence resources. It is also helpful to consider the total number of patent assets in a typical package (all packages analysed). This information is set out in Table 3, and as can be seen most packages have a handful of US patents – often only a single patent family. Our data suggests that higher-priced packages generally have multiple families with a greater number of foreign counterparts and often with pending continuations. Returning to the point on pricing guidance, and considering whether EOU is included in the package, pricing generally aligns with one of three groups: • No EOU or EOU on an insignificant market leads to below market pricing guidance (for package size). • EOU on a significant but untested market leads to market pricing. • EOU that has been tested (eg, through litigation or licensing) or is on an exceptional market (eg, LTE essential) leads to above market pricing. Thus, a seller or broker looking to maximise price should not add more patents to a package. Rather, brokers and sellers should spend time better developing EOU for the select assets. A 200 patent package with no EOU will be assigned commodity pricing (approximately US$50,000 per asset). Put another way, packages larger than 20 US patents with a wide array of families are often removed from consideration early in the diligence process. This is because the diligence costs, in light of all the other packages and budget constraints, make Figure 1. Package pricing histogram (n=112)
- 4. Priceperpatent Broker pricing guide <US$500k US$500k-1M US$20M+US$10-20MUS$4-10MUS$2-4MUS$1-2M $- $200 $400 $600 $800 $1,000 $1,200 $1,400 Per US issued patent Per asset Public sold deals Avg per US issued Avg per patent asset www.iam-magazine.com14 Intellectual Asset Management January/February 2013 Market movers these packages undesirable and therefore they often fail early in the diligence process. A buyer might infer that if the seller does not know where the value is, it is going to be expensive for the buyer to find it. Package technology The packages that we reviewed fell into diverse technology areas representing the desires of various clients to address specific problems. Unsurprisingly, communications equipment, wireless technology and communication services were more common. Semiconductors tend to be less common, primarily because of the difficulty preparing and conducting diligence on EOU. Diligence and bid timing – longer than you thought? Buyers need to know when they are expected to have their diligence complete and bids ready. Our data shows that packages are sent out with an average of 51 days available to bid. However, many corporate clients need approximately 60 days from first seeing a package to placing a bid. This seeming inconsistency is reconciled by noting that the dates are target due dates. Rarely do brokers set a hard date when the package is initially distributed. Even after initial extensions, it is still common to have the final bid due date slide, which creates a disincentive to get bids in early. Most packages are received via an email, which provides a summary of the offering. Many brokers include a link to a website where additional data can be downloaded, such as PDF copies of the file histories and/or EOU. The most commonly missing item in packages is an easy-to-use spreadsheet listing of all the patent assets. The better brokers provide the list in a normalised form that is suitable for direct copy-and-paste input into patent analysis tools, such as IPVision, Thomson Innovation or Innography. The review process from when we first receive a package until we close the review of that package – including negotiating and signing a patent purchase agreement – averages 21 days. However, the average time presents a misleading picture. Drilling down further, four groupings of review time become apparent (see Table 4). Nearly 40% of packages are closed out in less than a week. These are packages that do not meet buying criteria. To run efficiently, we work with our clients to establish buying criteria early. Examples include: • Minimum review time – for example, the due date for bids allows for a minimum of 60 days before bids are due in order to accommodate diligence and corporate approval processes. • Target price for packages – if the broker’s guidance is outside of the target price, there is no need to perform diligence on the package. • Remaining patent life is sufficient (eg, at least five years remaining required). • Too many patents for meaningful analysis – for example, the client is looking for a handful of patents to Number of assets 1 2 to 5 6 to 10 11 to 25 26 to 50 51 to 100 > 100 Percentage of packages (counting US – issued only) 29% 29% 20% 14% 4% 1% 3% Percentage of packages (counting all assets) 23% 27% 17% 18% 6% 4% 5% Table 3. Sales package sizeFigure 2. Asking price per asset (US$K) (n=112)
- 5. Intellectual Asset Management January/February 2013 15www.iam-magazine.com Market movers address a specific threat. An undifferentiated package of 200 patents is not useful, especially as package size is often related to total price. • Technology area (eg, mobile handset patents only). • Encumbrances cleared – a list of companies to which the patents can be licensed is available. • Sufficient impact – for example, even assuming that the patents are valid and infringed, is there evidence for a sufficiently large market in the covered countries for the technology? • EOU minimum requirement – some buyers require that EOU exist before beginning diligence. • Other criteria – for example, some buyers will not buy from specific brokers or sellers. Bidding and buying – how many sold? Once purchasing starts, our data suggests that between 30 and 60 days to close is reasonable for a pure-patent transaction. We have closed patent purchases in a few days, but most take longer. Often, the delays stem from missing deliverables, such as a corrected assignment. We also often saw a number of assignments recorded close to the purchase recordation. For example, assignments releasing previous security interests were frequently recorded in proximity to the purchase assignment. We have experienced and heard from others that corrected assignments continue to be a significant source of delay to closing deals. We sub-sampled our data, looking at packages that had more than enough time to close (at least nine months from receipt). Of 96 packages separately analysed, only 15 had any registered assignments that were after the receipt date of the package and to an entity other than that selling the package. Thus, 16% of packages that we saw sold. Most of the purchases were to non- practising entities (NPEs) or defensive patent aggregators. The following are the definitions used to categorise purchasers: • ‘Operating company’ is a known operating company (eg, publicly traded). • ‘Defensive aggregator’ or just ‘aggregator’ is a known defensive aggregator such as AST, RPX or OIN. • ‘NPE’ is all other purchasers. Two of the 15 packages that sold (or 13% of the sales) had at least one subsequent onward transfer (after the brokered purchase), all to an operating entity as purchaser. When we looked at how many of the patents ended up in litigation, we were surprised that it was so few. Two of the 15 packages that sold (or 13% of the sales) had patents asserted in litigation, one by an operating company and the other by an NPE. More significantly, the operating company had been sued by a large corporation known for both products and patent assertion. It is clear that the purchaser used the patents to counter assert – a technique that has The leading brokers make evidence of use (EOU) readily available to interested parties without a non-disclosure agreement (NDA). Other brokers that prepare EOU require NDAs for access to EOU. Because the NDA will often include additional, specific patent purchasing language, the NDA negotiation can distract from the review process. While the emerging best practice is for brokers to make EOU available to interested parties without NDAs, common provisions to negotiate when NDAs are required include removing treble damages (35 USC 287), treating discussions as settlement discussions (eg, FRE 408), and treating the very fact you are a potential buyer as confidential information. Less common, but sometimes present is a standstill for a short number of days prohibiting filing a declaratory judgment action. Non-disclosure agreements 350 5 10 15 20 25 30 Communication services Application SW System infrastructure SW Wireless Communication equipment Components Development SW Cloud computing Miscellaneous Semiconductor Consumer electronics Imaging Computing equipment Number of packages Figure 3. Package by technology area (n=186) Table 4. Receipt to package disposition Days from receipt of package to disposition (includes purchase) ≤7 8 to 30 31 to 60 > 60 Percentage of packages 39% 35% 19% 7% Aggregator Operating company NPE Figure 4. Purchaser types (n=15)
- 6. www.iam-magazine.com16 Intellectual Asset Management January/February 2013 Market movers worked often for those finding themselves on the wrong end of a corporate patent assertion. The companies settled soon thereafter. Although the data does not highlight this as a common practice, we believe that the market for brokered patents is an important resource to counter corporate patent assertions. For the 15 packages that sold, the timing from the bid due date to the date on which the assignment was recorded averaged 108 days. Looking at all the steps, the process took, on average, 173 days (distribution of package as measured by our receipt to assignment recordation). Some sold packages moved much faster – fewer than 90 days from our receipt of the package to assignment; but a longer process matches both the data and our rule of thumb provided to potential sellers – it takes about six to nine months from start to finish to sell your patents. Interestingly, out of the 96 packages we reviewed for assignments, we found at least seven containing patents for which no assignment had ever been recorded. To be clear, the original assignment from the inventor had never been recorded. Surprised? So were we. How big is this market? We extrapolated our data on pricing, sales and packages to determine the size of this market. Bear in mind that we are sizing the market for deals with fewer than 200 assets in the package, sold by brokers, to the open market. We estimate US$153 million in annual sales with broker fees of about US$34 million. To derive the market size, we first estimated the number of new packages brought to the market in a year. Based on our most recent quarter and an estimate of the percentage of the entire market we see, we extrapolated the total number of new packages brought to the market generally. We also adjusted the number of packages because we do not see all brokered packages. We then used our previous sales rate and what we think the patents really sold for (75% of the asking price). We believe that the actual sales price is one of the more difficult areas to estimate because so few transactions are reported. We believe that the price could be 50% below or above this number. Using our average number of issued US patents per package brings us to a total market of US$153 million per year. Using an average commission rate of 22%, the revenue from this market for brokers is US$34 million per year. For this model, we did not account for growth or decline in the market from the previous year, so the time to close the transactions and collect the money does not affect the estimate. Clearly, this model can be refined, but we believe that it provides a good first approximation. Robust and chaotic Ultimately, we find the marketplace to be a robust, somewhat chaotic, arena in which to find interesting patent assets. With more than 100 packages on the market at any one time, there is always the opportunity to find something to fit your needs. Nearly 70% of the packages have a target price below US$2 million, allowing companies to purchase assets to address specific problems at a relatively low cost. The low percentage of sold packages – 16% – tells us that brokering patents can be a tough business. Also, with nearly 180 days from distribution to a sale, quick money seems unlikely. We are not surprised to see patent aggregators and NPEs buying the majority of patents. However, we also see that corporate buyers are willing to buy and Table 5. Brokered patent market (over 200 assets) 276 16% 44 US$433,000 8 US$3,462,000 US$152,882,000 US$33,634,000 Number of packages per year Sales rate Sold packages/year Price per US issued patent Number US issued per package Average sales price per package Total market Total commission • Evidence of use – An evidence of use (EOU) is a mapping of the elements of a claim to a potentially impacted product or service together with reasoned assumptions, including an identification of any additional information needed to complete the analysis. In contrast, a claim chart includes further supporting details, such as definitions, support in the specification identified for each term, reverse engineering concluded and documented, and/or references to terminology used in the prosecution. • Patent assets – We define a ‘patent asset’ as a single, unexpired pending or issued patent asset somewhere in the world. We have also found that the number of issued US patents is an additional relevant factor for evaluating packages, so we have included both metrics in many cases. Note that pending applications are not included in the US-issued count. Generally, pending applications do not affect the metrics unless there are very few assets. Of course, there are situations where a pending application is the most important patent in the package. Terminology Action plan When buying patents: • State the case for buying – what problem are you solving? • Model a return for your buying programme. • Recognise that most patents will not fit your needs – eliminating those patents from consideration early greatly reduces your costs. Programme parameters include: • Timeline. • Budget. • Buying team authority and responsibilities. • Buying criteria. • Listing of acceptable sources of patent packages. • Special requirements such as a whitelist of unlicensed companies. Fail-fast triage process for eliminating undesirable packages quickly: • Extract criteria from the business case to identify interesting markets and technologies, and to define the diligence needs. • This is a multi-part analysis of markets, technical knowledge, and legal analysis where a failure in any one area eliminates the package from further review. Bidding and buying: • Your model determines a maximum bid price. • Wait to place your bid unless there is a special circumstance. • Assume that diligence will take longer and that there will be at least some substantive work required to close the transaction. • Consider adding a consulting agreement with the inventors if they are available. A
- 7. Intellectual Asset Management January/February 2013 17www.iam-magazine.com Market movers counter assert patents. We continue to evaluate, bid and buy patents for our clients, and will continue to track the data and refine our database. Like all similar projects, as soon as the data started answering questions, additional detailed and in-depth questions presented themselves. We look forward to answering these. Further details and caveats When we started pulling this data together, we recognised not only the power of having this information for pricing and setting timelines and expectations, but also additional questions that we would like answered. Some of these could not be answered because we did not have the information in our database. We have removed these packages from our analysis. Similarly, we have removed packages where a project was stopped, meaning that the data for that package was incomplete and thus was not representative. In other cases, clients had a specific purpose for purchasing patents, which resulted in data that was skewed towards a particular technology area, price point or timeframe (we have removed or normalised data where needed). Additionally, our approach to the diligence process (‘fail fast’) meant that some data was never obtained. For example, where a package did not meet the initial buying criteria, no further diligence was performed. In that case, we did not test whether there was EOU for that package. Also, time to bid could not be meaningfully correlated with technology, price guidance or portfolio size. Other questions that we would like to answer but do not feel we have sufficient data to do so include: • How many packages fail with an open continuation versus without an open continuation? Our experience has been that we are much more willing to bid where we believe that we can address a claim problem in an open continuation. • How many packages fail on price expectations alone? Our sense is that this is less of a problem than even three years ago, but we did not track this data. Kent Richardson and Erik Oliver are partners in the Richardson Oliver Law Group kent@richardsonoliver.com erik@richardsonoliver.com The authors gratefully acknowledge Lex Machina’s assistance in this analysis. www.lexmachina.com