More Related Content Similar to HY16_Results_presentation - Capital Portfolio Management (20) 1. © Orica Limited Group24
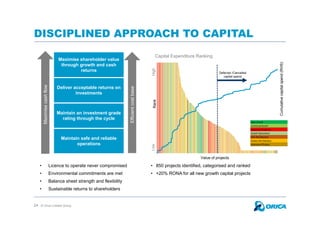
DISCIPLINED APPROACH TO CAPITAL
Maintain safe and reliable
operations
Maintain an investment grade
rating through the cycle
Deliver acceptable returns on
investments
Maximise shareholder value
through growth and cash
returns
Maximisecashflow
Efficientcostbase
• Licence to operate never compromised
• Environmental commitments are met
• Balance sheet strength and flexibility
• Sustainable returns to shareholders
• 850 projects identified, categorised and ranked
• +20% RONA for all new growth capital projects
Major Growth
Contractual Growth
Regulatory Compliance
Growth Improvement
SHEC Risk Reduction
Business Risk Reduction
Sustenance Efficiency
RankHighLow
Value of projects
Cumulativecapitalspend(RHS)
Deferred /Cancelled
capital spend
Capital Expenditure Ranking
3. © Orica Limited Group
• Total AN product volumes of 1.71 million tonnes (pcp: 1.86 million tonnes)
• Over 80% of revenue from down the hole and value add services
• Underlying EBIT1 of $317 million (pcp: $330 million)
• Underlying EBITDA1 of $450 million (pcp: $472 million)
• NPAT2 of $190 million (pcp: $211 million)
– Statutory net profit after tax (NPAT)3 was $149 million (pcp: $222 million)
• Business improvements4 delivered incremental net benefits of $52 million
• Capital Expenditure significantly reduced
• New dividend policy in place
• Interim dividend of 20.5 cents per share
5
RESILIENT RESULT DESPITE MARKET
ENVIRONMENT
1. From continuing operations before individual material items
2. After tax and non-controlling interests in controlling entities (refer to Note 2(d) of Appendix 4D - Orica Half Year Report)
3. Net profit for the period attributable to shareholders of Orica Limited in the Income Statement of Appendix 4D - Orica Half Year Report. Includes Australian Taxation Office Part IVA dispute $41 million settlement2
4. Business improvement includes transformation program benefits
Note: all comparisons are to the prior corresponding period unless stated otherwise
4. © Orica Limited Group
• Establishment of a capital and investment
management framework:
– Improve overall governance and rigour in capital
investment evaluations
– Supported by a formalised Investment Committee and
independent in progress and post investment reviews
– Focus on a long term approach to sustenance and
growth capital
• Classification of growth and sustenance
expenditure aligned to prioritisation tools
• Ranking of capital ensures all regions and
functions are prioritised consistently across the
Group
• Prioritisation focusses on delivering acceptable
returns on investments:
– Compliance and business risk capital will be prioritised
17
GROWTH
Major Growth
Contractual Growth
Growth Improvement
SUSTENANCE
Sustenance Efficiency
Business Risk
Reduction
Regulatory
Compliance
SHEC Risk Reduction
Financial metrics:
• Capital Index1
• NPV
• RONA
1. Capital Index = NPV / Total Project Cost
Ranking based risk
and regulatory
drivers; not
influenced by
financial metrics
DISCIPLINED APPROACH TO CAPITAL
5. © Orica Limited Group18
35% REDUCTION IN CAPEX
(EXCLUDING BURRUP)
1. Excludes capitalised interest
Capital Expenditure1
$m
• Burrup AN plant expected to be commissioned in 2H CY16
• Future capital expenditure to be in line with forecast FY16 spend
• FY16 Depreciation and Amortisation expected to be ~$285m
269
203 185
60
140 - 150
307
150 183
45
90 - 100
204
151
75
32
80
FY13
Group
FY14
Group
FY15
Continuing
Operations
HY16
Continuing
Operations
FY16
Forecast
Sustaining Capital Growth Capital Burrup AN Plant
780
504
443
137
~320