Download to read offline


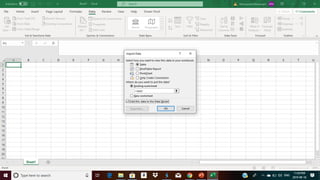
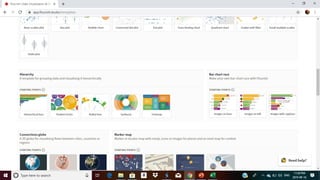
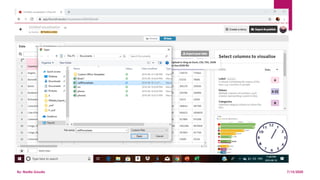
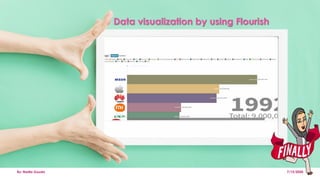


This document discusses using Flourish for data visualization. It outlines some of the key challenges in the data visualization process such as finding data, importing data, and cleaning data. It then explains how Flourish can help with visualizing data through its easy to use interface that allows users to quickly create interactive visuals without coding.


