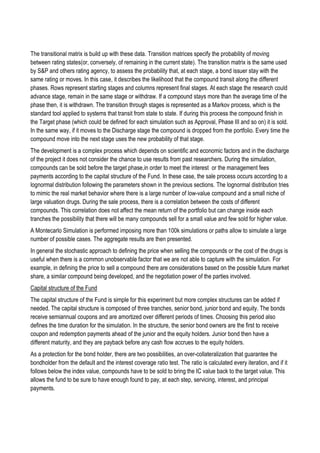
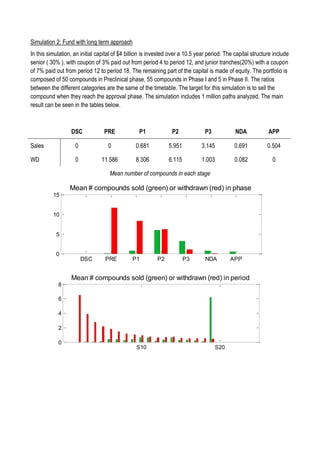
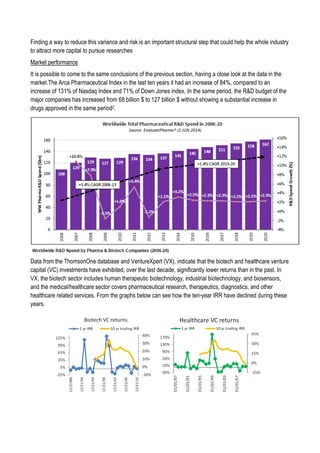
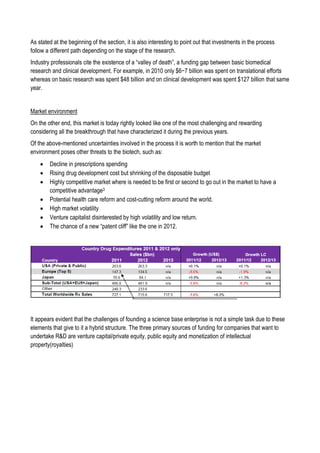
This document discusses financing biomedical research through securitization techniques. It first provides an overview of the biomedical research market, noting its risky and competitive nature. It then analyzes market performance data showing biotech investments have lower returns than other industries. The document also examines challenges in the market like high costs and volatility that make it difficult to attract capital. It proposes that securitization techniques may help reduce risk and variance, and attract more funding to support valuable research.

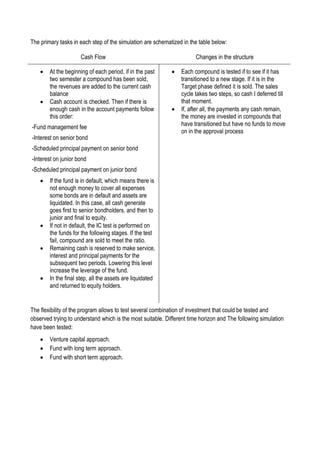
![Sell of compound
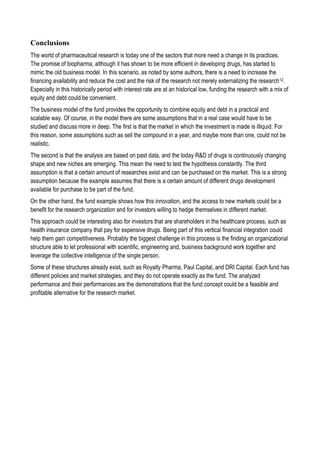
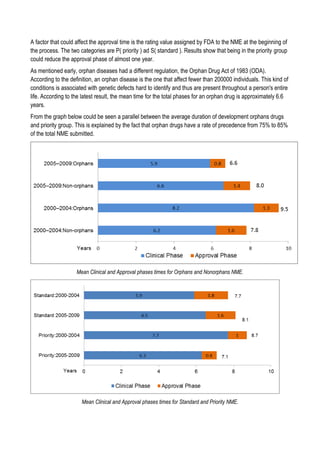
Since in the simulation involve the management of a fund which at each step of the simulation sell and buy
compounds in different clinical phases, it is necessary to define a compound value at each phase. To
accomplish this have been determined a mean value and a maximum value for each stage of the pipeline. The
cost of selling an approved drug depends on the cash flow that commercialization will generate in the future.
This depends upon several variables, and many practitioners refer to the success in the market as a black
swan. According to Munos (2009), the sales forecast for a new product is inaccurate nearly the 80% of the
time. For this reasons, the values have been extrapolated considering the selling or acquisition value of the
company with drugs at different stages. This value is aligned with the ones in the literature.
Stage Preclinical Phase I Phase II Phase III NDA Approved
Mean [ $ million ] 16.5 31 84 440 1560 1920
Max [ $ million ] 102 250 514 1028 2570 5142
Lognormal Mean 2.4 3.0 4.0 5.7 6.9 7.2
Lognormal SD 0.9 0.9 0.9 0.9 0.9 0.9](https://image.slidesharecdn.com/9a9bbad6-38ad-4c97-bba5-2d00bcc0ca38-150330095530-conversion-gate01/85/How-to-finance-the-biomedical-research-with-securitization-techniques-a-practical-study-10-320.jpg)
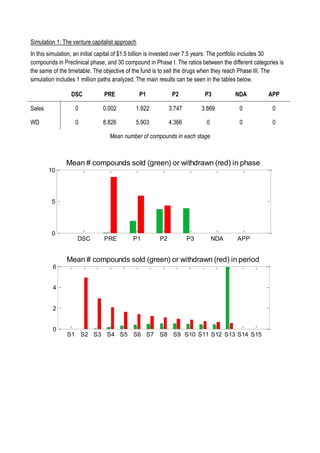
![Valuation and cost assumption for the fund
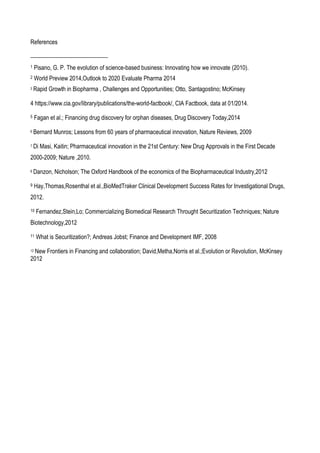
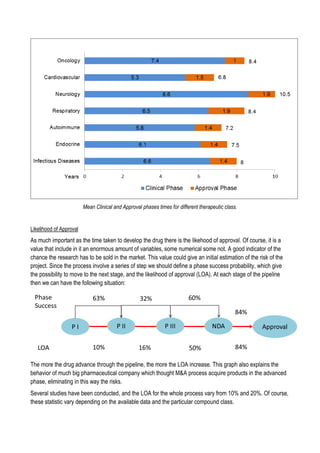
The assets of the Fund are assumed to be new drugs developed by pharma or biotech companies and
focused on the following different pharmaceutical class: Orphan, Infectious, and Neurology.
The choice of the classes has been made considering the opportunity to have classes with a short time and
high LOA, but with not a huge market. Neurology drugs instead have lower success rate and longer
development length but at the same time could have a bigger market share.
N
Preclinical
[ Years ]
Phase I
[ Years ]
Phase II
[ Years ]
Phase III
[ Years ]
NDA
[ Years ]
Total Time
[ Years ]
Orphan 10 1 1.6 2.2 2.1 0.8 7.7
Infectious diseases 60 0.8 2.2 2.6 2 1.4 9
Neurology 20 1.3 3.4 2.9 3.2 1.9 12.7
Total 90 0.9 2.4 2.6 2.3 1.4 9.68
The weighted average of the duration of each phase has then been used in the simulation. The cost of the
development has been reported below. Development costs are modeled as a lognormal distribution. The
standard deviation parameters are maintained the same while the cost have been increased according to the
trends of the market in the last years.
Preclinical Phase I Phase II Phase III Total
Mean Expected cost
[ $millions ]
6.3 20 52.5 197.3 276.1
SD cost/phase 6.3 16.8 49.5 138.5
Max cost/phase
[ $millions ]
21 52.5 126 525 724.5
Lognormal Mean 1.52 2.75 3.64 5.10
Lognormal SD 0.8 0.7 0.8 0.6
The probability of transition from each phase is shown below:
Preclinical Phase I Phase II Phase III NDA LOA
69% 67% 47% 56% 84% 10%](https://image.slidesharecdn.com/9a9bbad6-38ad-4c97-bba5-2d00bcc0ca38-150330095530-conversion-gate01/85/How-to-finance-the-biomedical-research-with-securitization-techniques-a-practical-study-14-320.jpg)