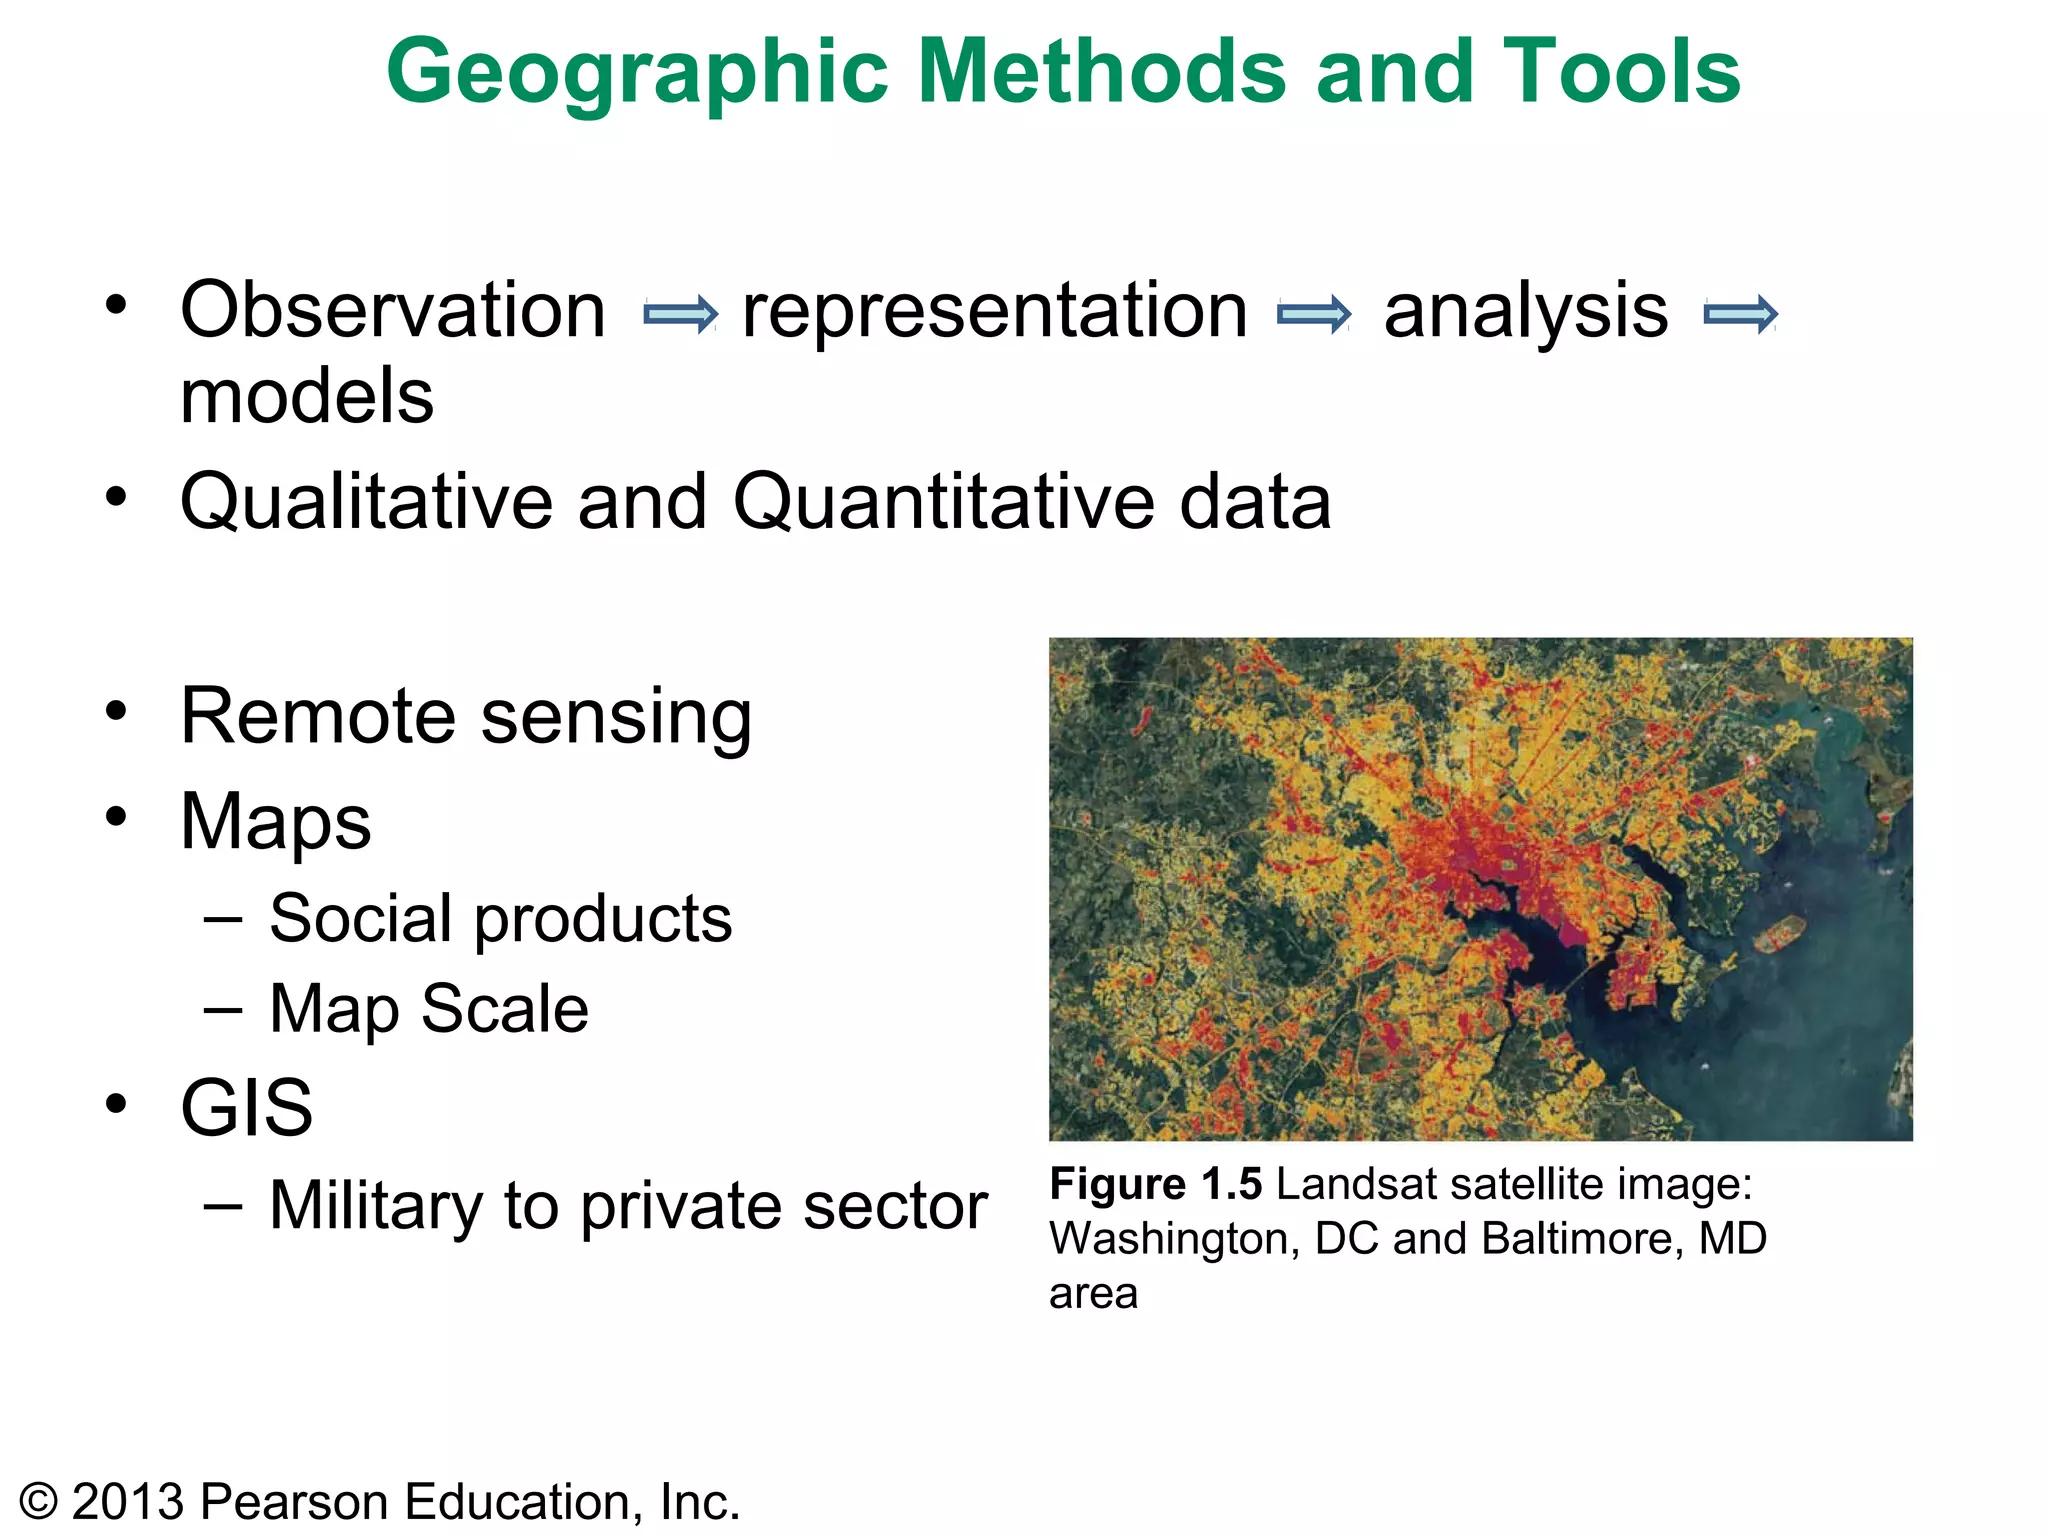
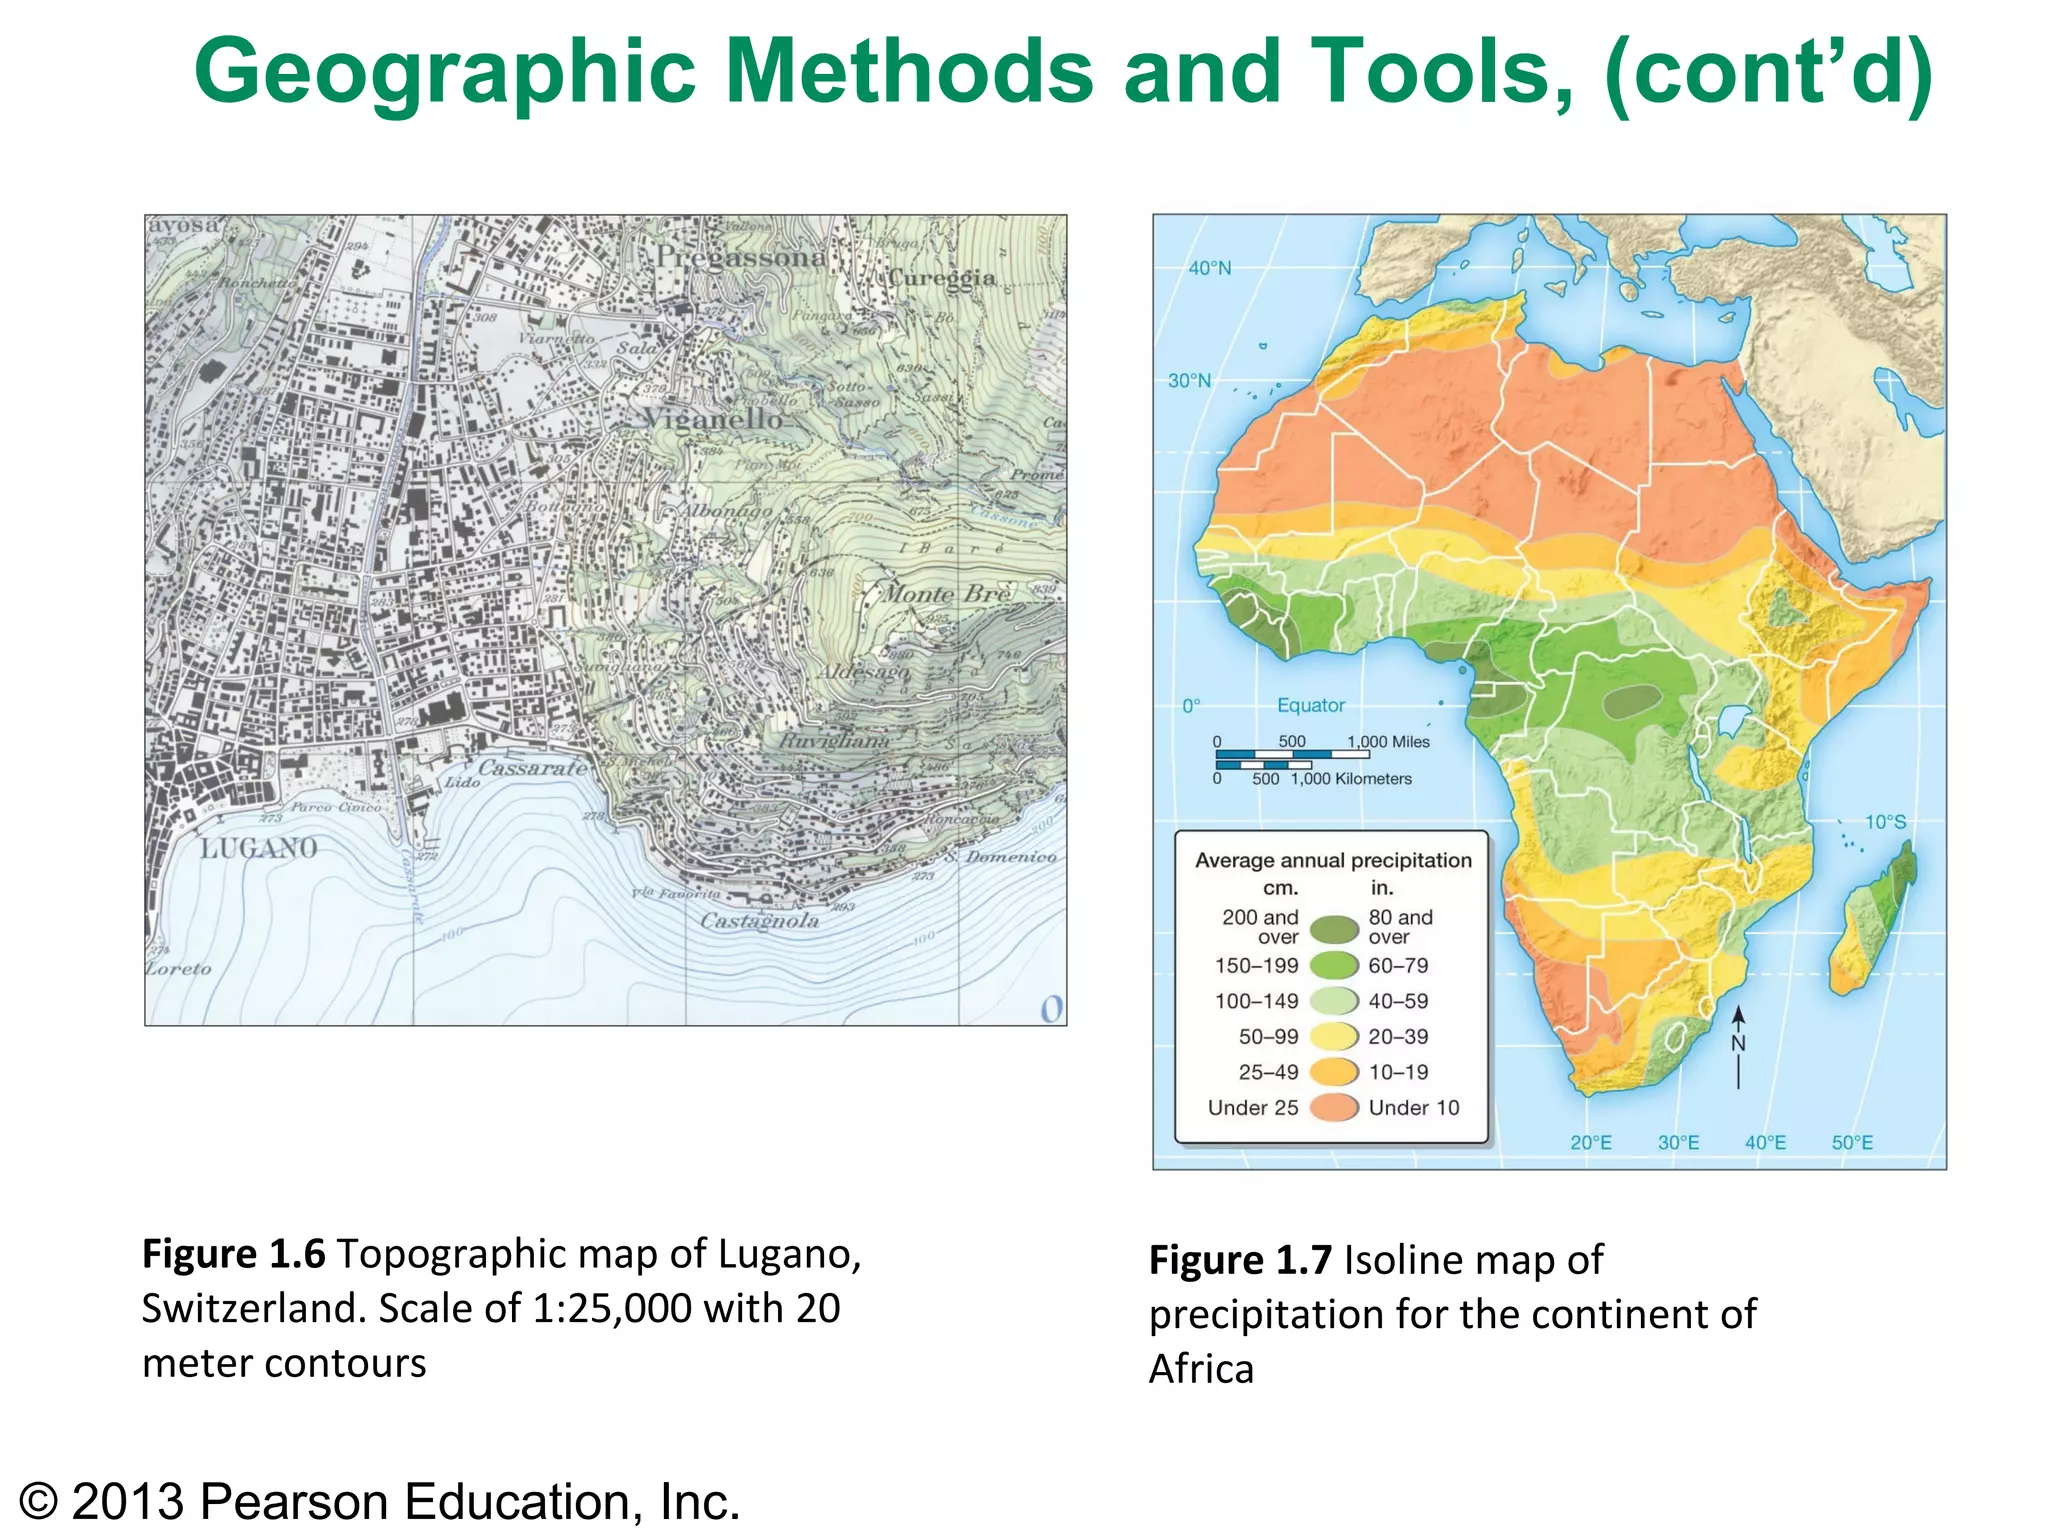
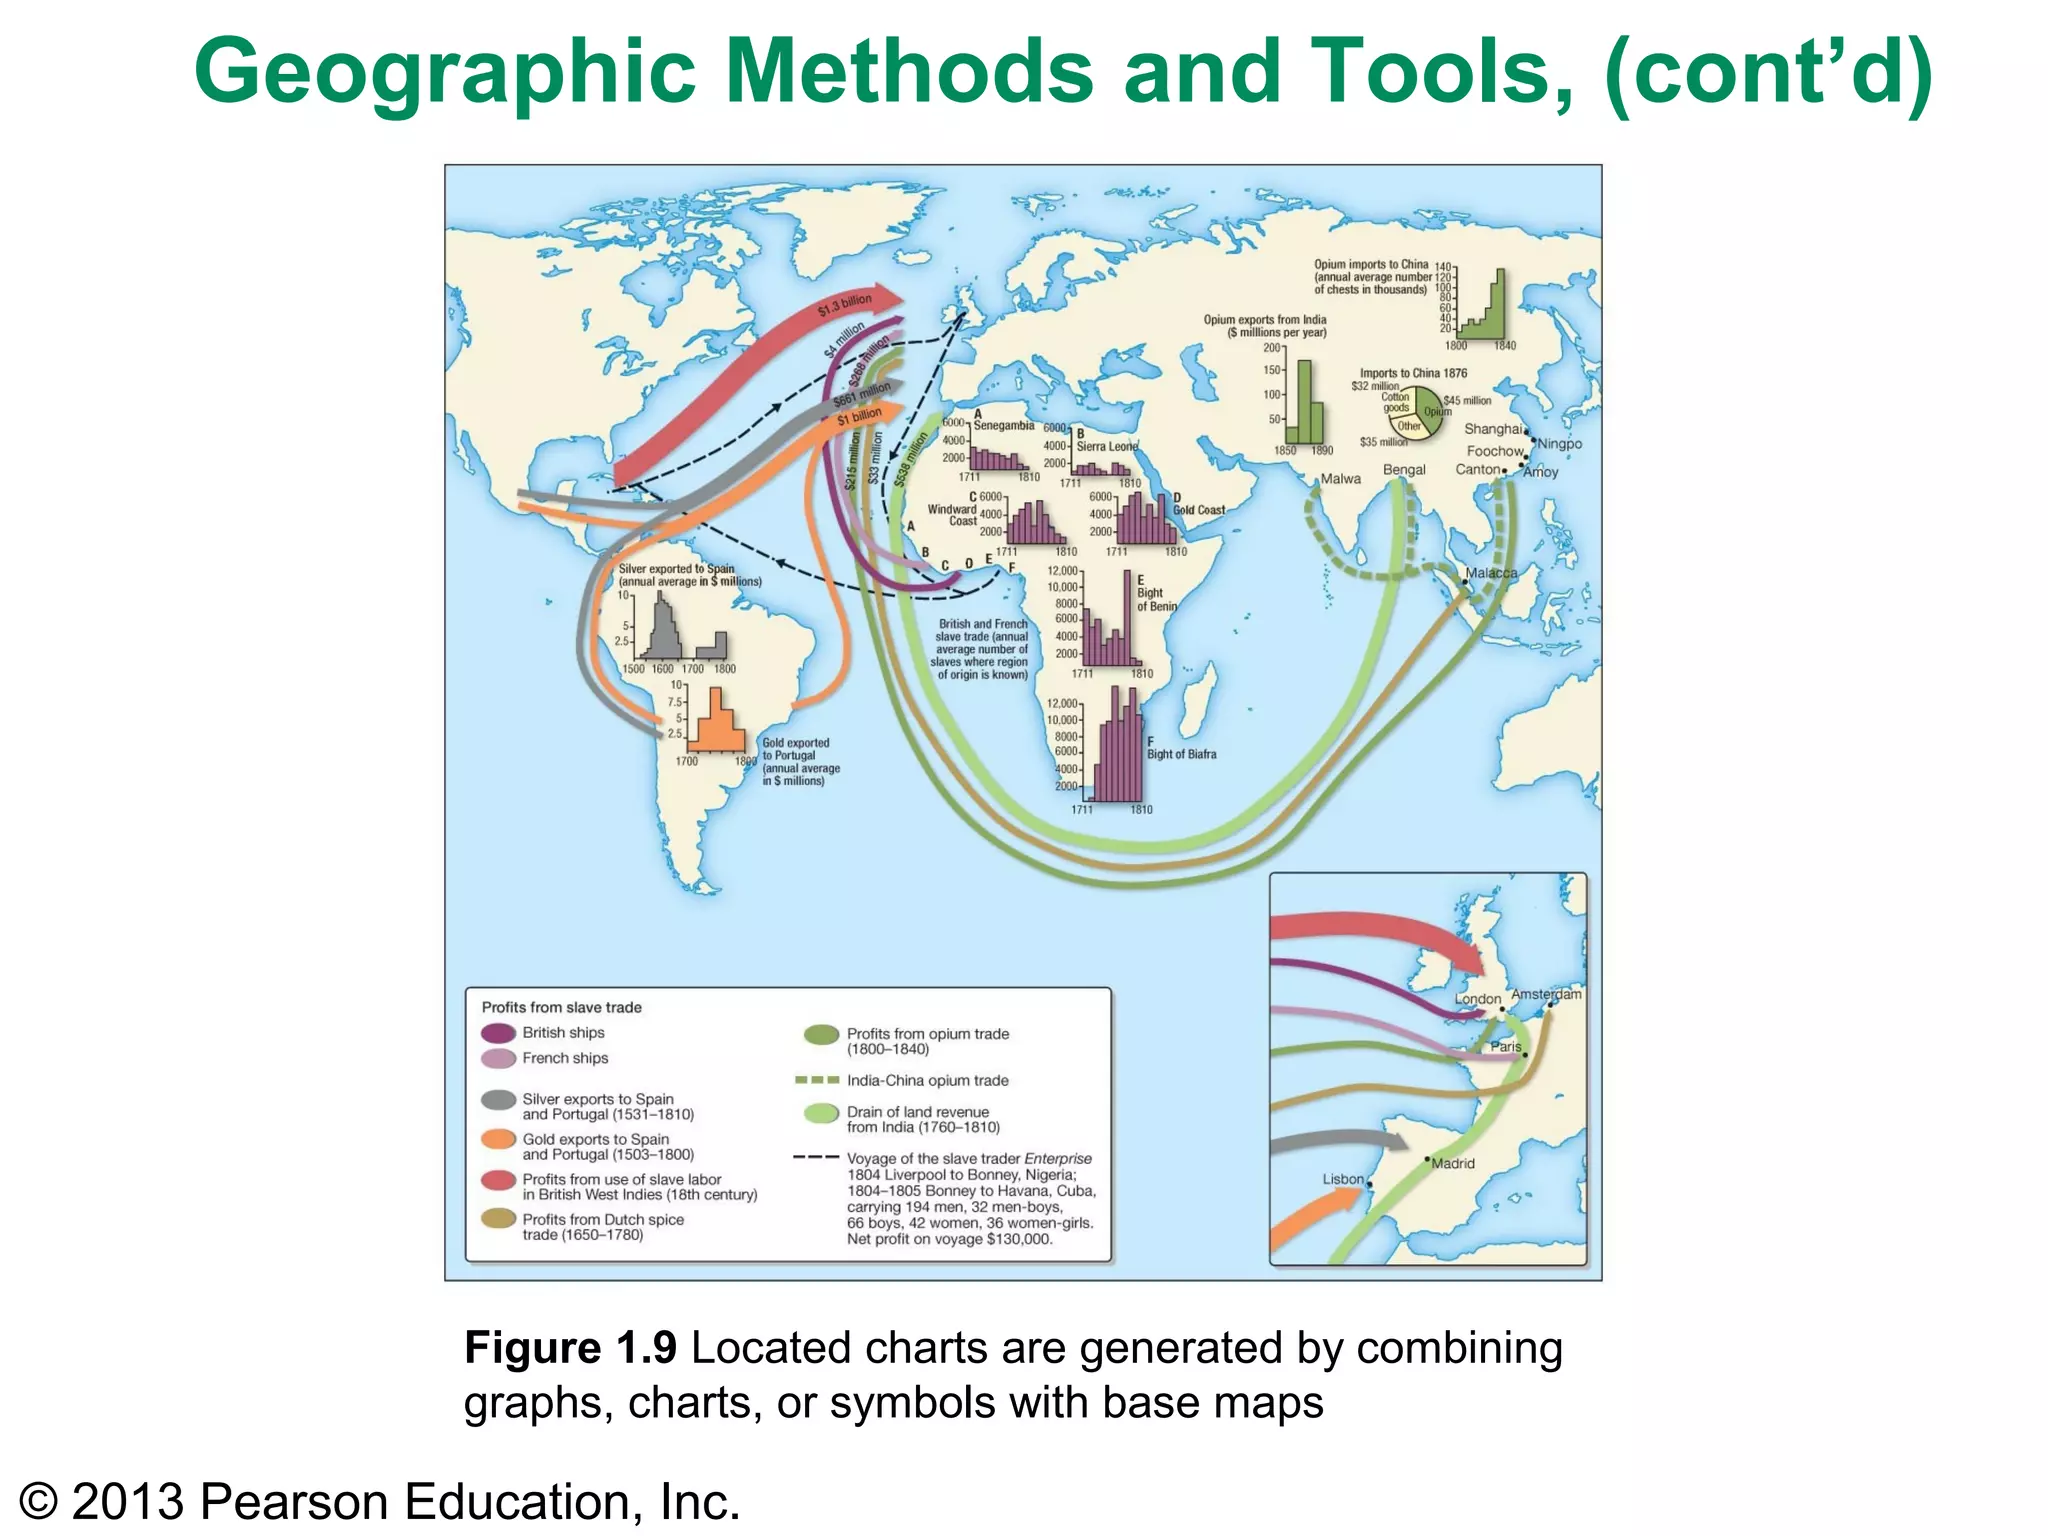
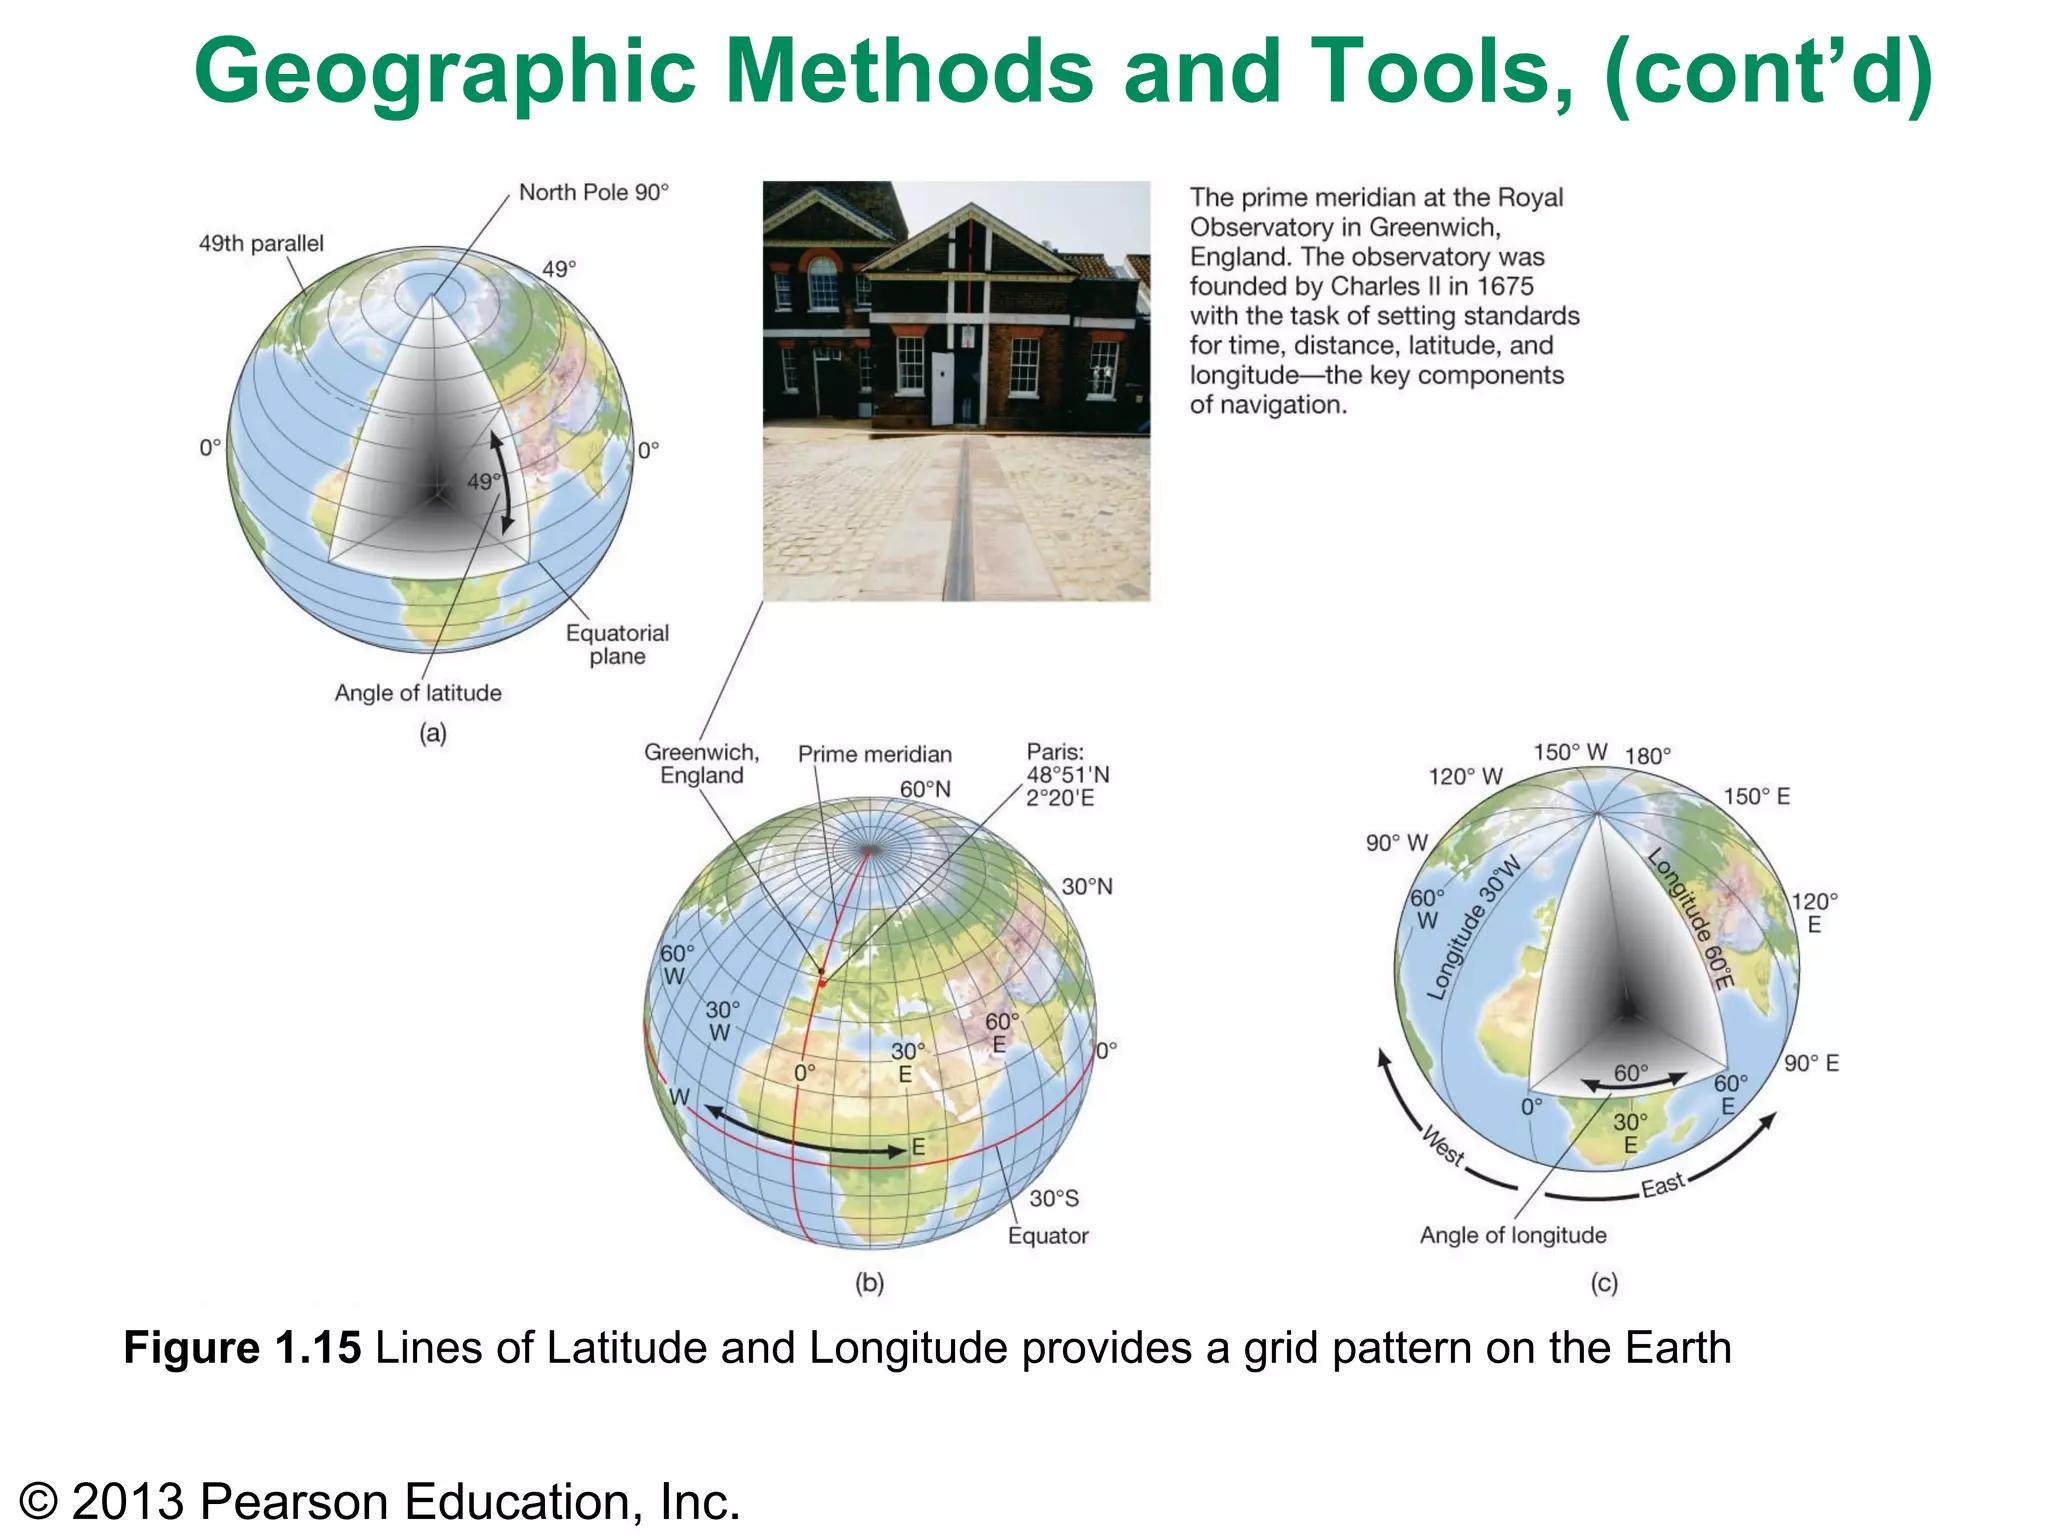
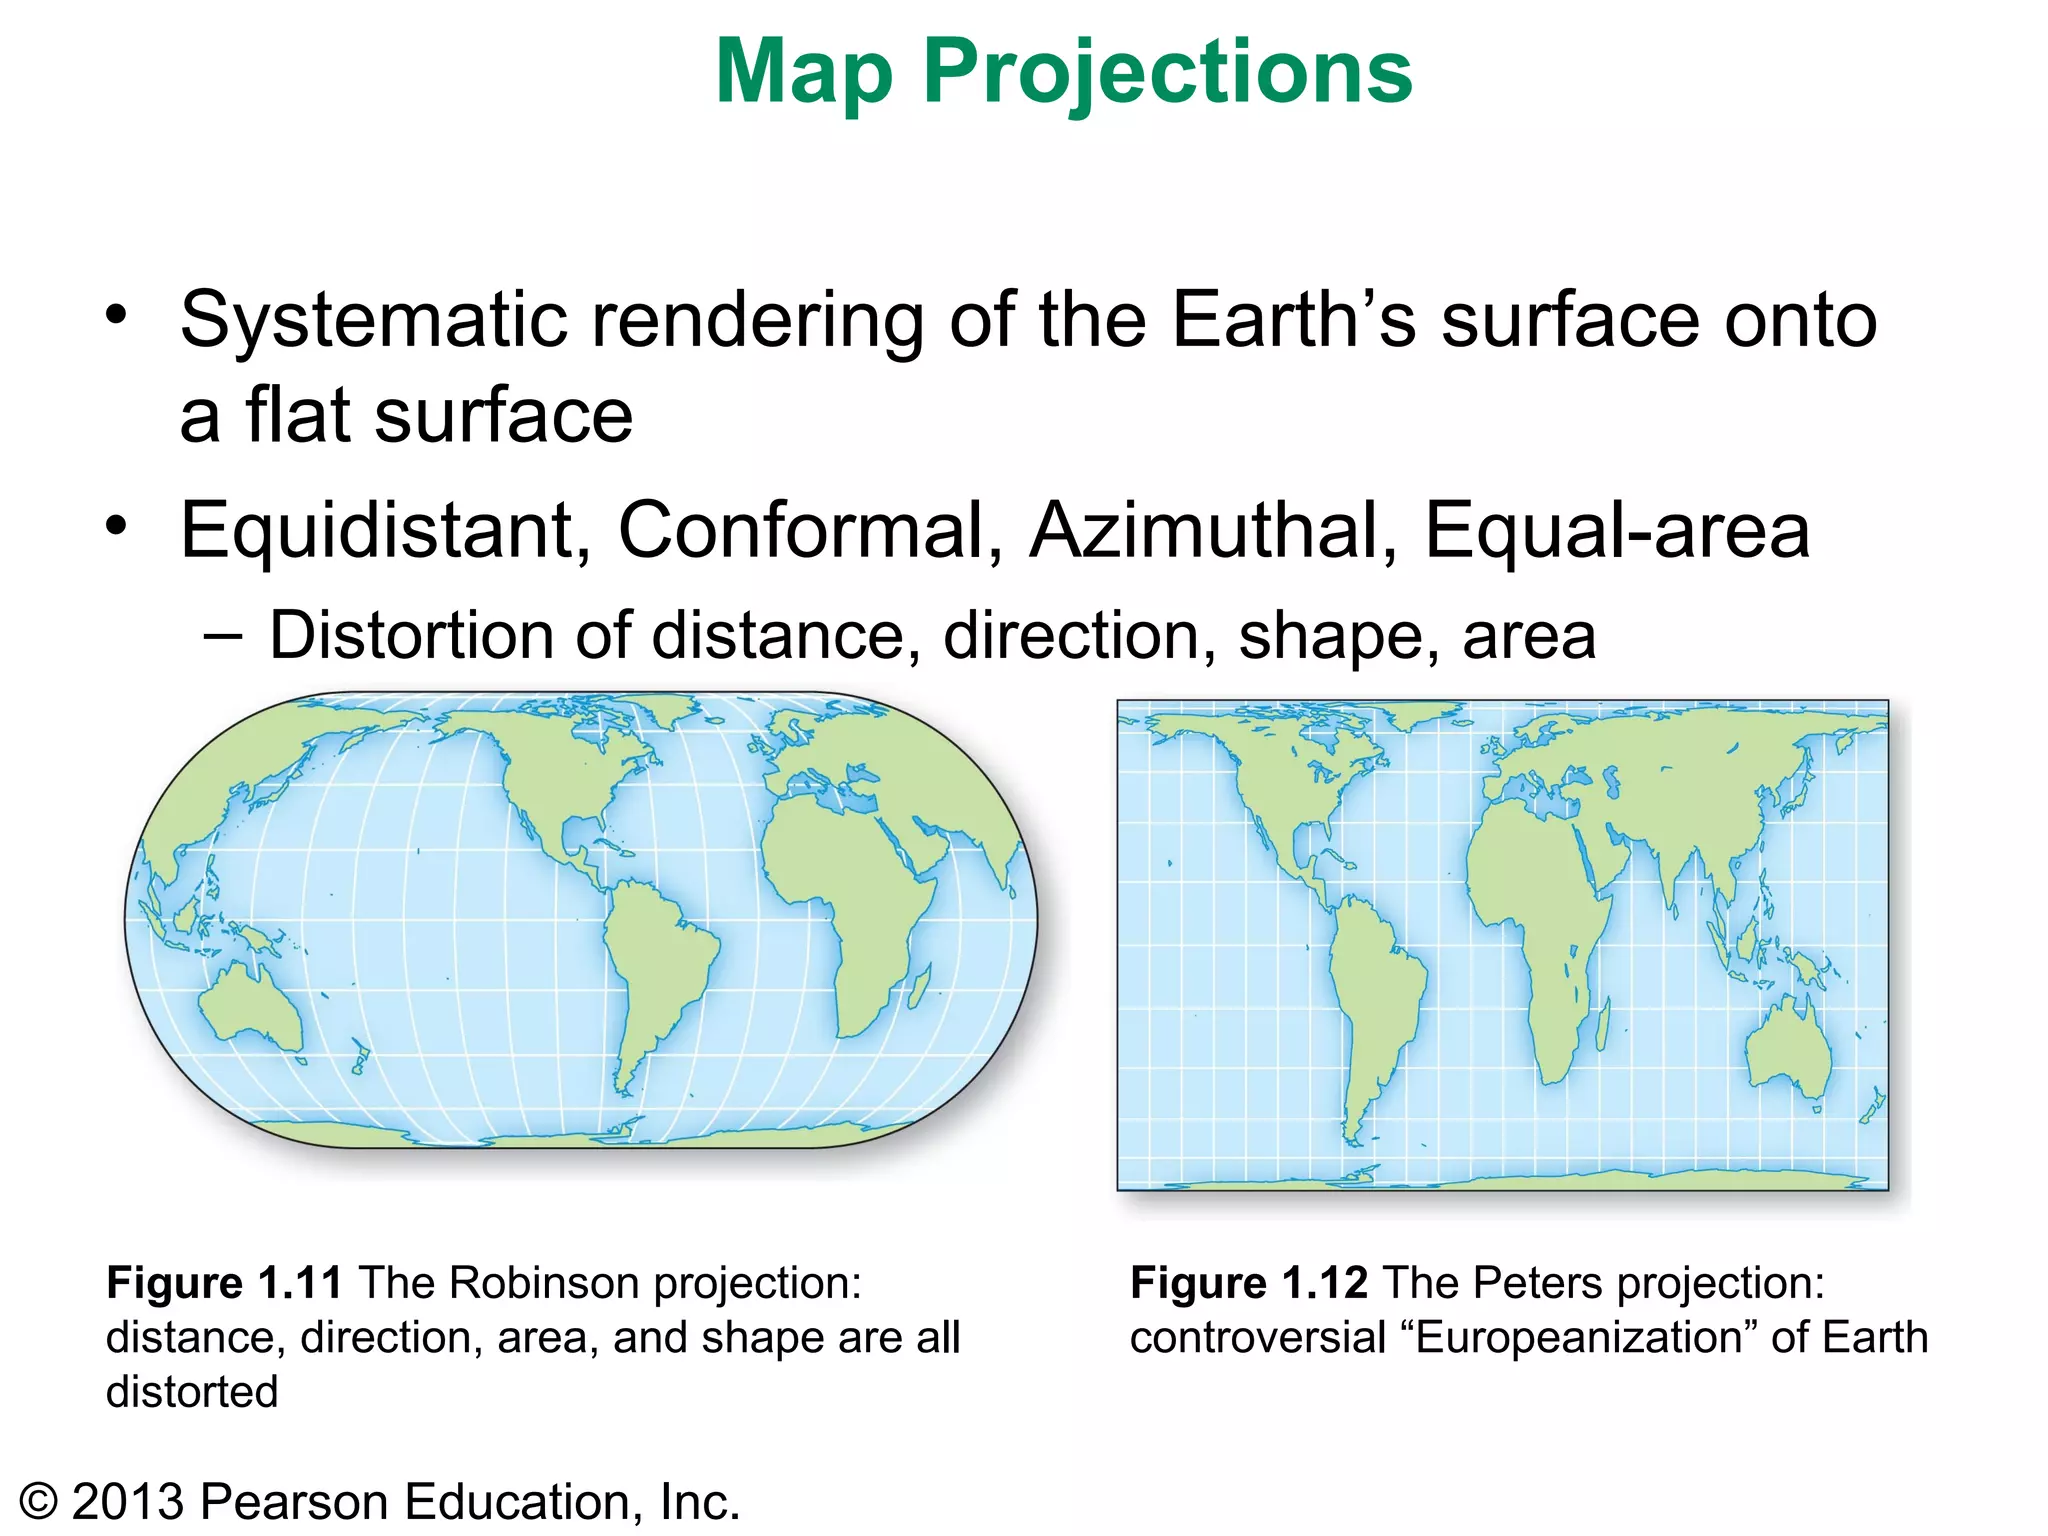
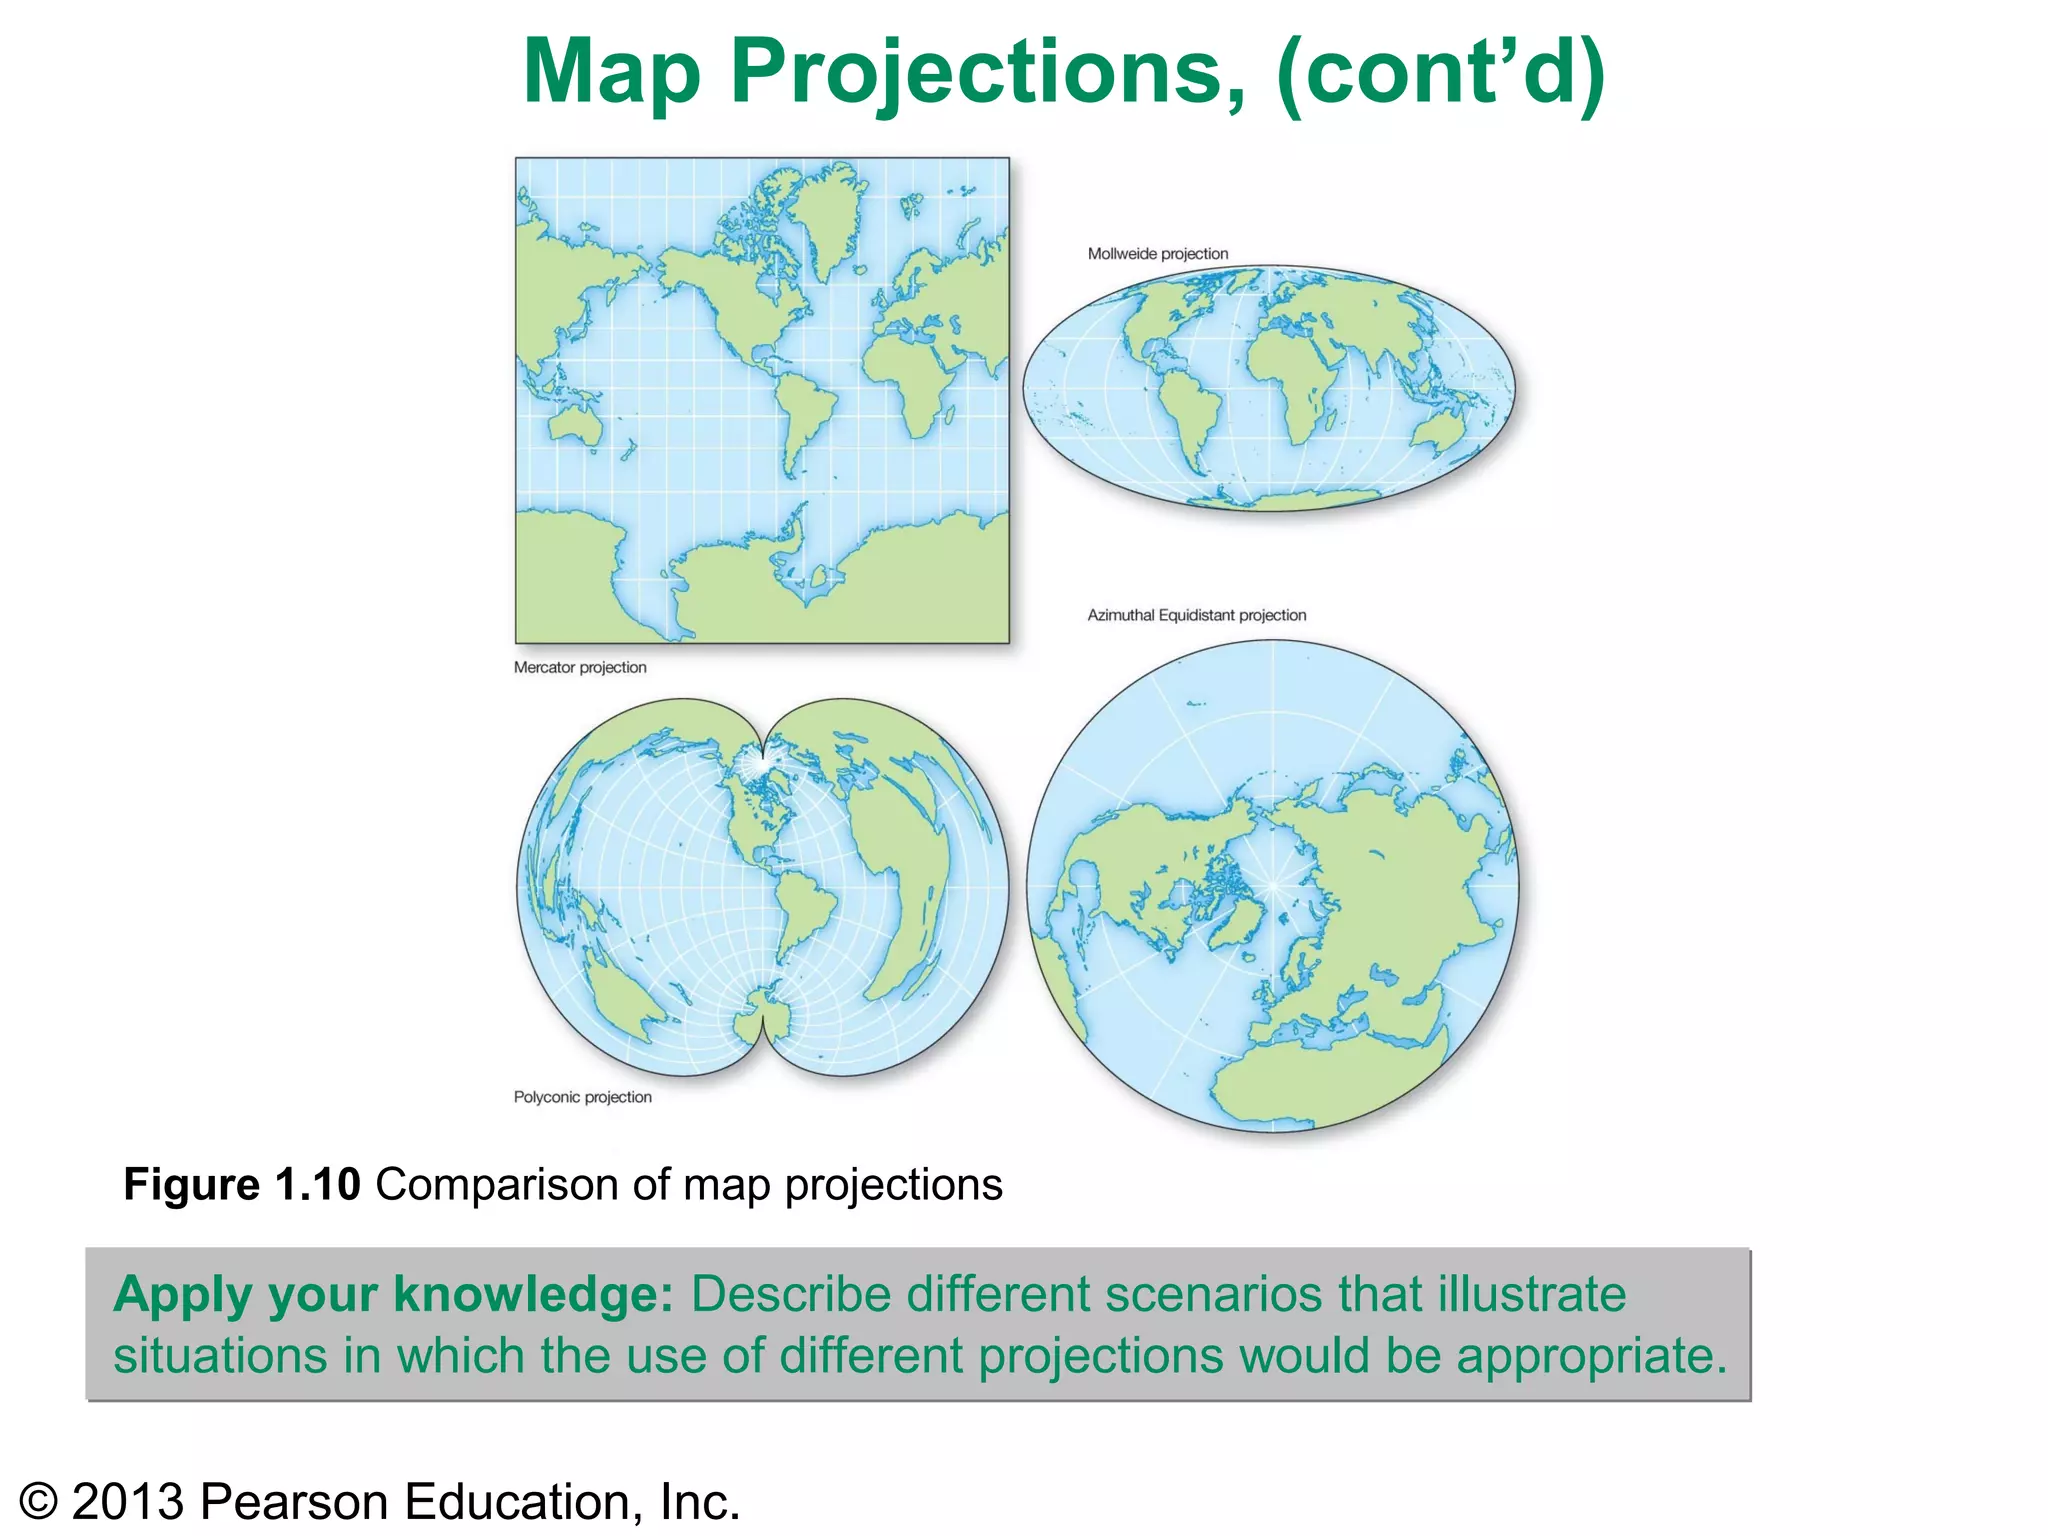
Chapter 1 Lecture

               Human Geography: Places and
                  Regions in Global Context
                                        Sixth Edition


Geography Matters


Wendy A. Mitteager
State University of New York, Oneonta
Key Concepts

   •   Geography Matters
   •   Place Matters
   •   Geographic Tools
   •   Spatial Relationships
   •   Regional Analysis
   •   Geographical Imagination
                                          Figure 1.3 Influence of
                                          place in a center city
                                          neighborhood, Boston

   Apply your knowledge: Why would a corporate
   employer value knowledge of geography in prospective
   employees?
© 2013 Pearson Education, Inc.
Geography Matters

   •   Increasing geographic interdependence of the world
   •   Instant global communications
   •   Rapidly changing international relationships
   •   Environmental degradation
   •   Places and Regions


   Figure: Chapter 1 Opener Protesting rising food prices in Maputo, Mozambique

© 2013 Pearson Education, Inc.
Places Matter

   • Geographic Literacy
       – Lack of geographic understanding and
         knowledge among Americans
   • Places are dynamic and complex


   Figure 1.1 Destruction caused in       Figure 1.2 Quality of life is impacted
   Japan by the March 2011 tsunami        by this petrochemical plant in
                                          California

© 2013 Pearson Education, Inc.
Places Matter (cont’d)

   • Emotional and cultural symbols
       – Graceland (Memphis)
   • Ordinary places with special meaning
       – Childhood neighborhood
   • Sites of innovation, change, conflict


   Figure 1.4 Anti-government demonstrators flood Tahir Square, Cairo,
   Egypt on February 11, 2011
© 2013 Pearson Education, Inc.
Human Geography

   •   Spatial organization of human activities
   •   Relationships between people and their environments
   •   How and why relationships are important
   •   Geographers solve a variety of problems on scales from
       local to global
       – Marketing, GIS, international affairs


    Figure 1.A Urban planners examine a model of a new town near Stuttgart, Germany


© 2013 Pearson Education, Inc.
Geographic Methods and Tools

   • Observation     representation    analysis
     models
   • Qualitative and Quantitative data

   • Remote sensing
   • Maps
       – Social products
       – Map Scale
   • GIS
                                      Figure 1.5 Landsat satellite image:
       – Military to private sector   Washington, DC and Baltimore, MD
                                      area


© 2013 Pearson Education, Inc.
Geographic Methods and Tools, (cont’d)


     Figure 1.6 Topographic map of Lugano,    Figure 1.7 Isoline map of
     Switzerland. Scale of 1:25,000 with 20   precipitation for the continent of
     meter contours                           Africa

© 2013 Pearson Education, Inc.
Geographic Methods and Tools, (cont’d)


                  Figure 1.9 Located charts are generated by combining
                  graphs, charts, or symbols with base maps

© 2013 Pearson Education, Inc.
Geographic Methods and Tools, (cont’d)


    Figure 1.15 Lines of Latitude and Longitude provides a grid pattern on the Earth


© 2013 Pearson Education, Inc.
Map Projections

   • Systematic rendering of the Earth’s surface onto
     a flat surface
   • Equidistant, Conformal, Azimuthal, Equal-area
        – Distortion of distance, direction, shape, area


   Figure 1.11 The Robinson projection:           Figure 1.12 The Peters projection:
   distance, direction, area, and shape are all   controversial “Europeanization” of Earth
   distorted

© 2013 Pearson Education, Inc.
Map Projections, (cont’d)


    Figure 1.10 Comparison of map projections

   Apply your knowledge: Describe different scenarios that illustrate
   situations in which the use of different projections would be appropriate.

© 2013 Pearson Education, Inc.
Maps and GIS


  Figure 1.13 GIS technology used to map   Figure 1.14 Cartogram
  land cover                               demonstrating spatial inequality of all
                                           people living on US$10 or less a day


© 2013 Pearson Education, Inc.
GIS Applications

   • Geodemographic research


    Census data combined with commercial data for market research in NYC


© 2013 Pearson Education, Inc.
Spatial Analysis

   • Location
       – fixed coordinates of latitude and longitude
       – GPS
   • Site and Situation
       – Physical attributes and relative location


  Figure 1.16 Denver, Colorado is a major center for cable TV because of site
   and situation
© 2013 Pearson Education, Inc.
Spatial Analysis, (cont’d)

   • Cognitive images (mental maps)
       – Based on perception and experience


                                 Figure 1.17 Detail of Washington DC
                                 depends on this person’s experiences and
                                 perception


© 2013 Pearson Education, Inc.
Spatial Analysis, (cont’d)

   • Distance                               • Space
       – Absolute or relative                    – Absolute or relative
       – Cognitive distance                      – Cognitive space
       – “Everything is related to               – Topological space
         everything else”                          (connectivity)
       – Friction of distance
       – Distance-decay


   Apply your knowledge: Provide examples of the inhibiting effect distance has
   on human activity

© 2013 Pearson Education, Inc.
Spatial Analysis, (cont’d)

   • Accessibility
       –   Opportunity for interaction
       –   Proximity
       –   Distance and connectivity
       –   Airline hub cities are more
           accessible than other cities


                                          Figure 1.18 Metro map of Milan, Italy is a
                                          topological map showing connectivity
                                          between points in the city.


© 2013 Pearson Education, Inc.
Spatial Analysis, (cont’d)

    • Spatial Interaction
        – Movement and flows
          of human activity
        – Places can
          complement each
          other
        – Transferability
        – Spatial organization of
          activity is continually
          changing
        – Time-space
          convergence
                                    Figure 1.19 The effects of changing
                                    transportation technologies, “shrinking”
                                    the world

© 2013 Pearson Education, Inc.
Spatial Analysis, (cont’d)

    • Spatial Interaction                      • Spatial Diffusion
        – Intervening                              – The way things spread
          Opportunities                              through space and
          determine the volume                       over time
          and pattern of                           – Expansion diffusion
          movement and flows                       – Hierarchical diffusion


   Apply your knowledge: Referring to spatial analysis concepts, discuss a
   national or international environmental issue. Relate complementarity,
   transferability, intervening opportunities, and diffusion.


© 2013 Pearson Education, Inc.
Regional Analysis

   • Regionalization
       – Functional regions
       – Regionalism
       – Sectionalism
       – Irredentism


                                 Figure 1.21 The Mormon cultural region


© 2013 Pearson Education, Inc.
Regional Analysis, (cont’d)

   • Landscape
       – Ordinary and Symbolic
       – Many layers of meaning


                                                 Figure 1.22 Landscapes can be symbolic of
                                                 national identity as this landscape in Tuscany
                                                 has for Italy


  Figure 1.24 Picturesque landscape in England
  emblematic of the nation even though much
  change has occurred


© 2013 Pearson Education, Inc.
Regional Analysis, (cont’d)

   • Sense of Place
        – Insiders and lifeworld
        – Intersubjectivity


                                                    Figure 1.25 Routine encounters in
                                                    Italy help develop a sense of community


   Figure 1.26 Community art helps create a sense
   of place in San Francisco

    Apply your knowledge: What are the most distinctive characteristics of
    your region? Describe the landscape and the sense of place.

© 2013 Pearson Education, Inc.
Geographical Imagination

   • Allows us to understand geographic change
   • Places and regions represent the cumulative
     legacy of successive periods of change
       – General effects and unique outcomes


                                 Figure 1.27 This German town was once a
                                 prosperous regional center, but now is
                                 isolated and economically disadvantaged


© 2013 Pearson Education, Inc.
Geographical Imagination, (cont’d)


    Figure 1.D South Beach, Miami embodies      Figure 1.E “SoFi” was redeveloped with
    the layered legacy of successive waves of   exclusive, resortlike condominium towers
    development and change. Art Deco            and became a playground for the young
    architecture reflects the past.             and affluent.


© 2013 Pearson Education, Inc.
Future Geographies


                 Figure 1.28 The consequences of the unprecedented
                 shift of relative wealth and economic power from West to
                 East are highly uncertain.

    Apply your knowledge: What are the likely future changes to the
    geography of your region?

© 2013 Pearson Education, Inc.
End of Chapter 1


© 2013 Pearson Education, Inc.

Hg 6e ch_01_lecture

  • 1.
    Chapter 1 Lecture Human Geography: Places and Regions in Global Context Sixth Edition Geography Matters Wendy A. Mitteager State University of New York, Oneonta
  • 2.
    Key Concepts • Geography Matters • Place Matters • Geographic Tools • Spatial Relationships • Regional Analysis • Geographical Imagination Figure 1.3 Influence of place in a center city neighborhood, Boston Apply your knowledge: Why would a corporate employer value knowledge of geography in prospective employees? © 2013 Pearson Education, Inc.
  • 3.
    Geography Matters • Increasing geographic interdependence of the world • Instant global communications • Rapidly changing international relationships • Environmental degradation • Places and Regions Figure: Chapter 1 Opener Protesting rising food prices in Maputo, Mozambique © 2013 Pearson Education, Inc.
  • 4.
    Places Matter • Geographic Literacy – Lack of geographic understanding and knowledge among Americans • Places are dynamic and complex Figure 1.1 Destruction caused in Figure 1.2 Quality of life is impacted Japan by the March 2011 tsunami by this petrochemical plant in California © 2013 Pearson Education, Inc.
  • 5.
    Places Matter (cont’d) • Emotional and cultural symbols – Graceland (Memphis) • Ordinary places with special meaning – Childhood neighborhood • Sites of innovation, change, conflict Figure 1.4 Anti-government demonstrators flood Tahir Square, Cairo, Egypt on February 11, 2011 © 2013 Pearson Education, Inc.
  • 6.
    Human Geography • Spatial organization of human activities • Relationships between people and their environments • How and why relationships are important • Geographers solve a variety of problems on scales from local to global – Marketing, GIS, international affairs Figure 1.A Urban planners examine a model of a new town near Stuttgart, Germany © 2013 Pearson Education, Inc.
  • 7.
    Geographic Methods andTools • Observation representation analysis models • Qualitative and Quantitative data • Remote sensing • Maps – Social products – Map Scale • GIS Figure 1.5 Landsat satellite image: – Military to private sector Washington, DC and Baltimore, MD area © 2013 Pearson Education, Inc.
  • 8.
    Geographic Methods andTools, (cont’d) Figure 1.6 Topographic map of Lugano, Figure 1.7 Isoline map of Switzerland. Scale of 1:25,000 with 20 precipitation for the continent of meter contours Africa © 2013 Pearson Education, Inc.
  • 9.
    Geographic Methods andTools, (cont’d) Figure 1.9 Located charts are generated by combining graphs, charts, or symbols with base maps © 2013 Pearson Education, Inc.
  • 10.
    Geographic Methods andTools, (cont’d) Figure 1.15 Lines of Latitude and Longitude provides a grid pattern on the Earth © 2013 Pearson Education, Inc.
  • 11.
    Map Projections • Systematic rendering of the Earth’s surface onto a flat surface • Equidistant, Conformal, Azimuthal, Equal-area – Distortion of distance, direction, shape, area Figure 1.11 The Robinson projection: Figure 1.12 The Peters projection: distance, direction, area, and shape are all controversial “Europeanization” of Earth distorted © 2013 Pearson Education, Inc.
  • 12.
    Map Projections, (cont’d) Figure 1.10 Comparison of map projections Apply your knowledge: Describe different scenarios that illustrate situations in which the use of different projections would be appropriate. © 2013 Pearson Education, Inc.
  • 13.
    Maps and GIS Figure 1.13 GIS technology used to map Figure 1.14 Cartogram land cover demonstrating spatial inequality of all people living on US$10 or less a day © 2013 Pearson Education, Inc.
  • 14.
    GIS Applications • Geodemographic research Census data combined with commercial data for market research in NYC © 2013 Pearson Education, Inc.
  • 15.
    Spatial Analysis • Location – fixed coordinates of latitude and longitude – GPS • Site and Situation – Physical attributes and relative location Figure 1.16 Denver, Colorado is a major center for cable TV because of site and situation © 2013 Pearson Education, Inc.
  • 16.
    Spatial Analysis, (cont’d) • Cognitive images (mental maps) – Based on perception and experience Figure 1.17 Detail of Washington DC depends on this person’s experiences and perception © 2013 Pearson Education, Inc.
  • 17.
    Spatial Analysis, (cont’d) • Distance • Space – Absolute or relative – Absolute or relative – Cognitive distance – Cognitive space – “Everything is related to – Topological space everything else” (connectivity) – Friction of distance – Distance-decay Apply your knowledge: Provide examples of the inhibiting effect distance has on human activity © 2013 Pearson Education, Inc.
  • 18.
    Spatial Analysis, (cont’d) • Accessibility – Opportunity for interaction – Proximity – Distance and connectivity – Airline hub cities are more accessible than other cities Figure 1.18 Metro map of Milan, Italy is a topological map showing connectivity between points in the city. © 2013 Pearson Education, Inc.
  • 19.
    Spatial Analysis, (cont’d) • Spatial Interaction – Movement and flows of human activity – Places can complement each other – Transferability – Spatial organization of activity is continually changing – Time-space convergence Figure 1.19 The effects of changing transportation technologies, “shrinking” the world © 2013 Pearson Education, Inc.
  • 20.
    Spatial Analysis, (cont’d) • Spatial Interaction • Spatial Diffusion – Intervening – The way things spread Opportunities through space and determine the volume over time and pattern of – Expansion diffusion movement and flows – Hierarchical diffusion Apply your knowledge: Referring to spatial analysis concepts, discuss a national or international environmental issue. Relate complementarity, transferability, intervening opportunities, and diffusion. © 2013 Pearson Education, Inc.
  • 21.
    Regional Analysis • Regionalization – Functional regions – Regionalism – Sectionalism – Irredentism Figure 1.21 The Mormon cultural region © 2013 Pearson Education, Inc.
  • 22.
    Regional Analysis, (cont’d) • Landscape – Ordinary and Symbolic – Many layers of meaning Figure 1.22 Landscapes can be symbolic of national identity as this landscape in Tuscany has for Italy Figure 1.24 Picturesque landscape in England emblematic of the nation even though much change has occurred © 2013 Pearson Education, Inc.
  • 23.
    Regional Analysis, (cont’d) • Sense of Place – Insiders and lifeworld – Intersubjectivity Figure 1.25 Routine encounters in Italy help develop a sense of community Figure 1.26 Community art helps create a sense of place in San Francisco Apply your knowledge: What are the most distinctive characteristics of your region? Describe the landscape and the sense of place. © 2013 Pearson Education, Inc.
  • 24.
    Geographical Imagination • Allows us to understand geographic change • Places and regions represent the cumulative legacy of successive periods of change – General effects and unique outcomes Figure 1.27 This German town was once a prosperous regional center, but now is isolated and economically disadvantaged © 2013 Pearson Education, Inc.
  • 25.
    Geographical Imagination, (cont’d) Figure 1.D South Beach, Miami embodies Figure 1.E “SoFi” was redeveloped with the layered legacy of successive waves of exclusive, resortlike condominium towers development and change. Art Deco and became a playground for the young architecture reflects the past. and affluent. © 2013 Pearson Education, Inc.
  • 26.
    Future Geographies Figure 1.28 The consequences of the unprecedented shift of relative wealth and economic power from West to East are highly uncertain. Apply your knowledge: What are the likely future changes to the geography of your region? © 2013 Pearson Education, Inc.
  • 27.
    End of Chapter1 © 2013 Pearson Education, Inc.