Hfp ind
•
0 likes•10 views

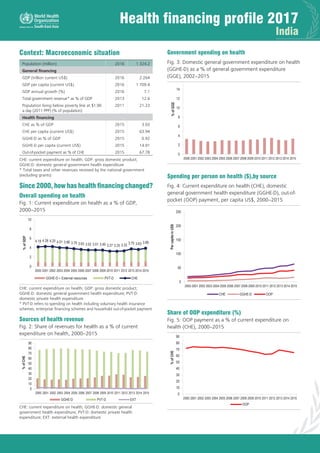
- Current health expenditure as a share of GDP in India has remained stable at around 3.84% since 2000, with private expenditure making up around three times the share of government expenditure. - Government spending on health as a share of total government spending averages 3%, while out-of-pocket expenditures make up around 69% of current health expenditures on average. - In 2011, high out-of-pocket payments contributed to 17% of the population spending over 10% of their budget on health, equivalent to 216 million people, and pushed 52.5 million people below the poverty line.
![Funding for health by donors
Fig. 6: External expenditure on health (EXT) as a % of
current expenditure on health (CHE), 2000–2015
EXT as % of CHE
0
5
10
15
20
25
30
2000 2001 2002 2003 2004 2005 2006 2007 2008 2009 2010 2011 2012 2013 2014 2015
%
of
CHE
How many households experience financial
hardship from health-care expenditure?
Table 1: Catastrophic health expenditure and impoverishment
due to health spending, 2011
Population
Catastrophic
expenditure
Impoverishment
due to OOP
Threshold
= 10%
Threshold
= 25%
Poverty
line =
PPP$ 1.90
Poverty
line =
PPP$ 3.10
% 17.33 3.89 4.21 4.56
Headcount 216.11 48.51 52.50 56.86
Source: India: National Sample Survey, sixty-eighth round. Household
Consumer Expenditure, 2011. Calculations by staff of the WHO Regional
Office for South-East Asia.
Key messages
~
~ Current expenditure on health (CHE) as a share of gross
domestic product (GDP) has been stable since 2000, averaging
3.84%. Private expenditure as a share of CHE is three times
more than government’s.
~
~ Government spending on health as a share of total
government spending averages 3% of general spending.
~
~ Out-of-pocket (OOP) expenditure has decreased from the
highest around 74% of CHE to 65% in 2015, but is still fairly
high, averaging 69.3% of CHE.
~
~ High OOP payments contribute to a serious lack of
financial protection. In 2011, 17% spent more than 10% of
their total budget on health, translating to 216 million people;
in addition, 52.5 million of the population were pushed below
the poverty line of PPP$ 1.90 per capita per day.
Sources
1. World development indicators. In: The World Bank [website];
2017 (https://data.worldbank.org/indicator/, accessed 23
November 2017).
2. Indicators and data: In: WHO Global Health Expenditure
database [online database] updated 20 November 2017 (http://
apps.who.int/nha/database/Select/Indicators/en, accessed 23
November 2017).
3. National Health Systems Resource Centre. National Health
Accounts: Estimates for India (2013-2014). New Delhi: Ministry
of Health and Family Welfare, Government of India, 2016
Health financing flows
Fig. 7: Health financing flow
Industry/enterprises
Households
Central
Government
(MoF)
State
Government
NGOs (NPISHs) and external
donors can provide finances
for any of the above level
Private Health insurance
State department forhealth (DoHFW)/
AYUSH/Medical Education
Ministry of Health and Family Welfare
(MoHFW)
Central
Taxes
State government
health facilities
Premium Out-of-Pocket payments
Other ministries/
PSUs for health
purposes
Local Gov’t
funds
(Urban/ Rural)
State health society
(National Health Mission)
Private health
centres
District health society
State
/
Local
Taxes
Fund Flows from GoI (MoF)
Fund flow from ministries / state to intermediates
Fund flow from people (taxes, OOPs)/ enterprises
Line item budgets
Payment to healthcare providers
Central
government health
facilities
Employees’ State Insurance
Schemes (ESIS)(Social security )
State Health Insurance Schemes
Contribution
Municipal bodies
Village health, Nutrition
and Sanitation Committee
Central Government Health
Schemes (CGHS)for central government
employees, pensioners, their dependents
Rashtiya Swasthiya Bima Yojana
(RSBY)for BPL families
ESIS Hospital &
Clinics
Municipal gov’t
hospital, clinics, etc.
Public health
services
Source: WHO SEARO, adapted from National Health Accounts: Estimates for India (2013-2014)](data:image/gif;base64,R0lGODlhAQABAIAAAAAAAP///yH5BAEAAAAALAAAAAABAAEAAAIBRAA7)
Recommended
Recommended
More Related Content
What's hot
What's hot (19)
Similar to Hfp ind
Similar to Hfp ind (20)
Recently uploaded
Recently uploaded (20)
Hfp ind
- 1. Health financing profile 2017 India Context: Macroeconomic situation Population (million) 2016 1 324.2 General financing GDP (trillion current US$) 2016 2.264 GDP per capita (current US$) 2016 1 709.4 GDP annual growth (%) 2016 7.1 Total government revenue* as % of GDP 2013 12.6 Population living below poverty line at $1.90 a day (2011 PPP) (% of population) 2011 21.23 Health financing CHE as % of GDP 2015 3.93 CHE per capita (current US$) 2015 63.94 GGHE-D as % of GDP 2015 0.92 GGHE-D per capita (current US$) 2015 14.91 Out-of-pocket payment as % of CHE 2015 67.78 CHE: current expenditure on health; GDP: gross domestic product; GGHE-D: domestic general government health expenditure * Total taxes and other revenues received by the national government (excluding grants) Since 2000, how has health financing changed? Overall spending on health Fig. 1: Current expenditure on health as a % of GDP, 2000–2015 4.18 4.28 4.25 4.01 3.96 3.79 3.63 3.52 3.51 3.49 3.27 3.25 3.33 3.75 3.63 3.89 0 2 4 6 8 10 2000 2001 2002 2003 2004 2005 2006 2007 2008 2009 2010 2011 2012 2013 2014 2015 % of GDP GGHE-D + External resources PVT-D CHE CHE: current expenditure on health; GDP: gross domestic product; GGHE-D: domestic general government health expenditure; PVT-D: domestic private health expenditure * PVT-D refers to spending on health including voluntary health insurance schemes, enterprise financing schemes and household out-of-pocket payment Sources of health revenue Fig. 2: Share of revenues for health as a % of current expenditure on health, 2000–2015 0 10 20 30 40 50 60 70 80 90 2000 2001 2002 2003 2004 2005 2006 2007 2008 2009 2010 2011 2012 2013 2014 2015 % of CHE GGHE-D PVT-D EXT CHE: current expenditure on health; GGHE-D: domestic general government health expenditure; PVT-D: domestic private health expenditure; EXT: external health expenditure Government spending on health Fig. 3: Domestic general government expenditure on health (GGHE-D) as a % of general government expenditure (GGE), 2002–2015 0 2 4 6 8 10 12 14 2000 2001 2002 2003 2004 2005 2006 2007 2008 2009 2010 2011 2012 2013 2014 2015 % of GGE Spending per person on health ($),by source Fig. 4: Current expenditure on health (CHE), domestic general government health expenditure (GGHE-D), out-of- pocket (OOP) payment, per capita US$, 2000–2015 0 50 100 150 200 250 2000 2001 2002 2003 2004 2005 2006 2007 2008 2009 2010 2011 2012 2013 2014 2015 Per capita in US$ CHE GGHE-D OOP Share of OOP expenditure (%) Fig. 5: OOP payment as a % of current expenditure on health (CHE), 2000–2015 0 10 20 30 40 50 60 70 80 90 2000 2001 2002 2003 2004 2005 2006 2007 2008 2009 2010 2011 2012 2013 2014 2015 % of CHE OOP
- 2. Funding for health by donors Fig. 6: External expenditure on health (EXT) as a % of current expenditure on health (CHE), 2000–2015 EXT as % of CHE 0 5 10 15 20 25 30 2000 2001 2002 2003 2004 2005 2006 2007 2008 2009 2010 2011 2012 2013 2014 2015 % of CHE How many households experience financial hardship from health-care expenditure? Table 1: Catastrophic health expenditure and impoverishment due to health spending, 2011 Population Catastrophic expenditure Impoverishment due to OOP Threshold = 10% Threshold = 25% Poverty line = PPP$ 1.90 Poverty line = PPP$ 3.10 % 17.33 3.89 4.21 4.56 Headcount 216.11 48.51 52.50 56.86 Source: India: National Sample Survey, sixty-eighth round. Household Consumer Expenditure, 2011. Calculations by staff of the WHO Regional Office for South-East Asia. Key messages ~ ~ Current expenditure on health (CHE) as a share of gross domestic product (GDP) has been stable since 2000, averaging 3.84%. Private expenditure as a share of CHE is three times more than government’s. ~ ~ Government spending on health as a share of total government spending averages 3% of general spending. ~ ~ Out-of-pocket (OOP) expenditure has decreased from the highest around 74% of CHE to 65% in 2015, but is still fairly high, averaging 69.3% of CHE. ~ ~ High OOP payments contribute to a serious lack of financial protection. In 2011, 17% spent more than 10% of their total budget on health, translating to 216 million people; in addition, 52.5 million of the population were pushed below the poverty line of PPP$ 1.90 per capita per day. Sources 1. World development indicators. In: The World Bank [website]; 2017 (https://data.worldbank.org/indicator/, accessed 23 November 2017). 2. Indicators and data: In: WHO Global Health Expenditure database [online database] updated 20 November 2017 (http:// apps.who.int/nha/database/Select/Indicators/en, accessed 23 November 2017). 3. National Health Systems Resource Centre. National Health Accounts: Estimates for India (2013-2014). New Delhi: Ministry of Health and Family Welfare, Government of India, 2016 Health financing flows Fig. 7: Health financing flow Industry/enterprises Households Central Government (MoF) State Government NGOs (NPISHs) and external donors can provide finances for any of the above level Private Health insurance State department forhealth (DoHFW)/ AYUSH/Medical Education Ministry of Health and Family Welfare (MoHFW) Central Taxes State government health facilities Premium Out-of-Pocket payments Other ministries/ PSUs for health purposes Local Gov’t funds (Urban/ Rural) State health society (National Health Mission) Private health centres District health society State / Local Taxes Fund Flows from GoI (MoF) Fund flow from ministries / state to intermediates Fund flow from people (taxes, OOPs)/ enterprises Line item budgets Payment to healthcare providers Central government health facilities Employees’ State Insurance Schemes (ESIS)(Social security ) State Health Insurance Schemes Contribution Municipal bodies Village health, Nutrition and Sanitation Committee Central Government Health Schemes (CGHS)for central government employees, pensioners, their dependents Rashtiya Swasthiya Bima Yojana (RSBY)for BPL families ESIS Hospital & Clinics Municipal gov’t hospital, clinics, etc. Public health services Source: WHO SEARO, adapted from National Health Accounts: Estimates for India (2013-2014)