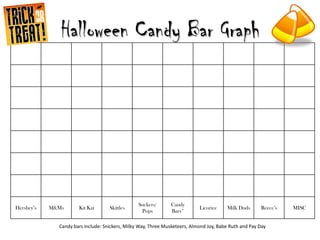
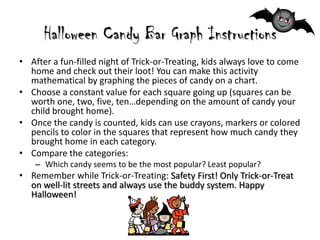
This document provides instructions for creating a bar graph to categorize and quantify Halloween candy collected by kids after trick-or-treating. It explains that squares on the graph should represent a constant value for each piece of candy and be colored in based on the amount in each category which includes: Hershey's, M&Ms, Kit Kat, Skittles, suckers/pops, candy bars, licorice, milk duds, Reese's, and misc. The activity allows kids to compare candy categories and determine which are most and least popular while following safety tips for trick-or-treating.